Gene: BCAT2
chr19: 49298318-49314269Expression Profile
(log scale)
Graphical Connections
Distribution of linked clusters:
You may find it interesting if many of the connected DHS sites belong to the same cluster.| Cluster Profile | Cluster ID | Number of DHS sites in this cluster |
|---|---|---|
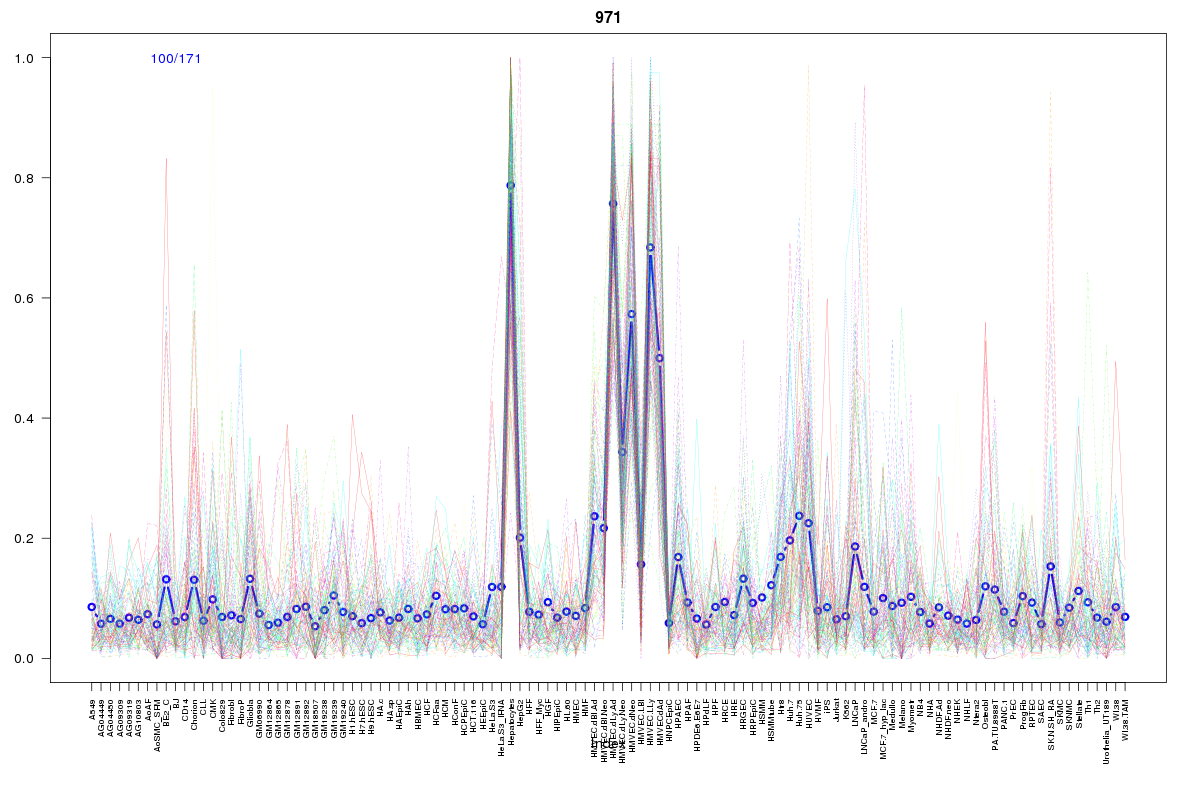 | 971 | 1 |
 | 626 | 1 |
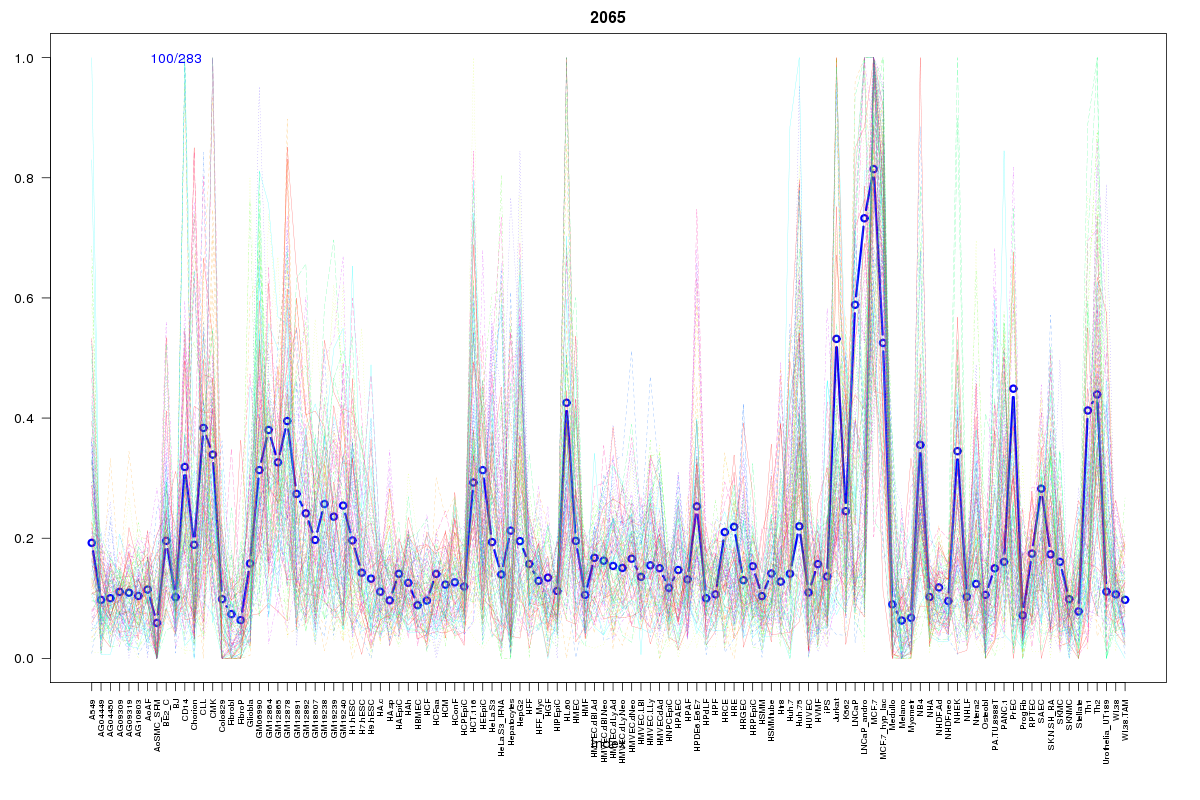 | 2065 | 1 |
 | 1056 | 1 |
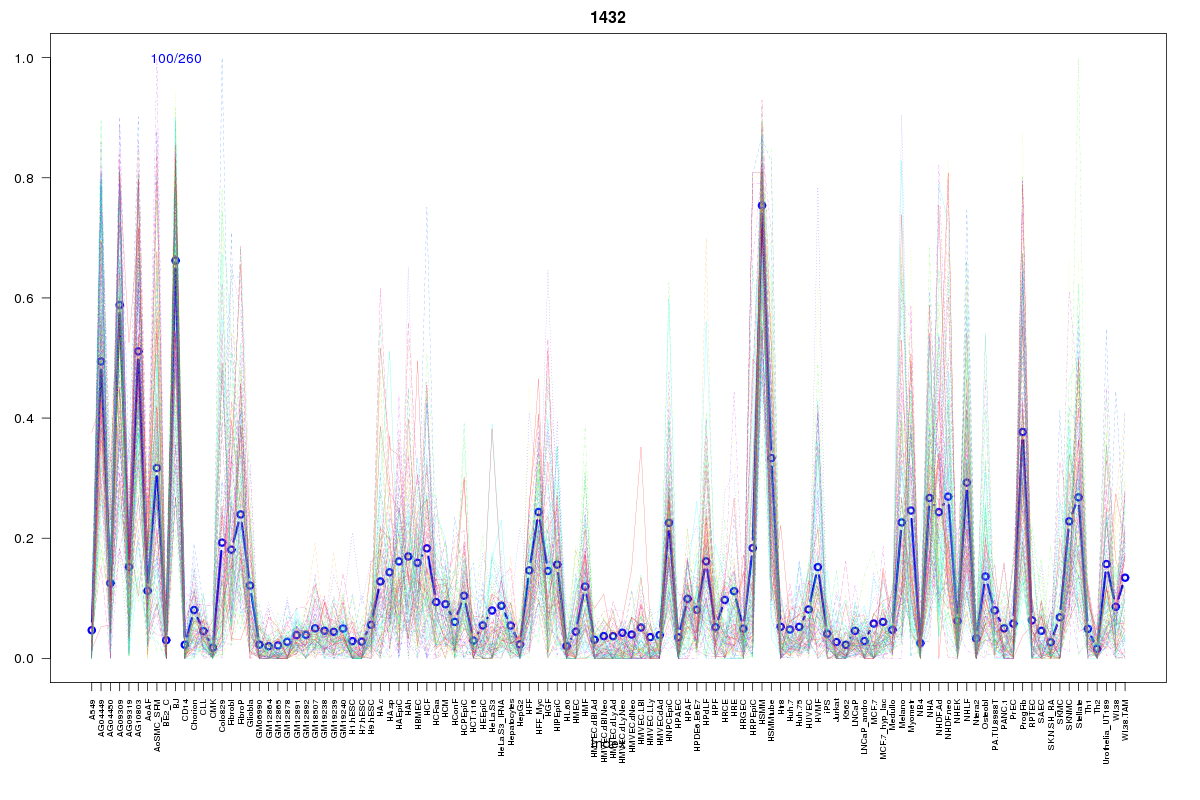 | 1432 | 1 |
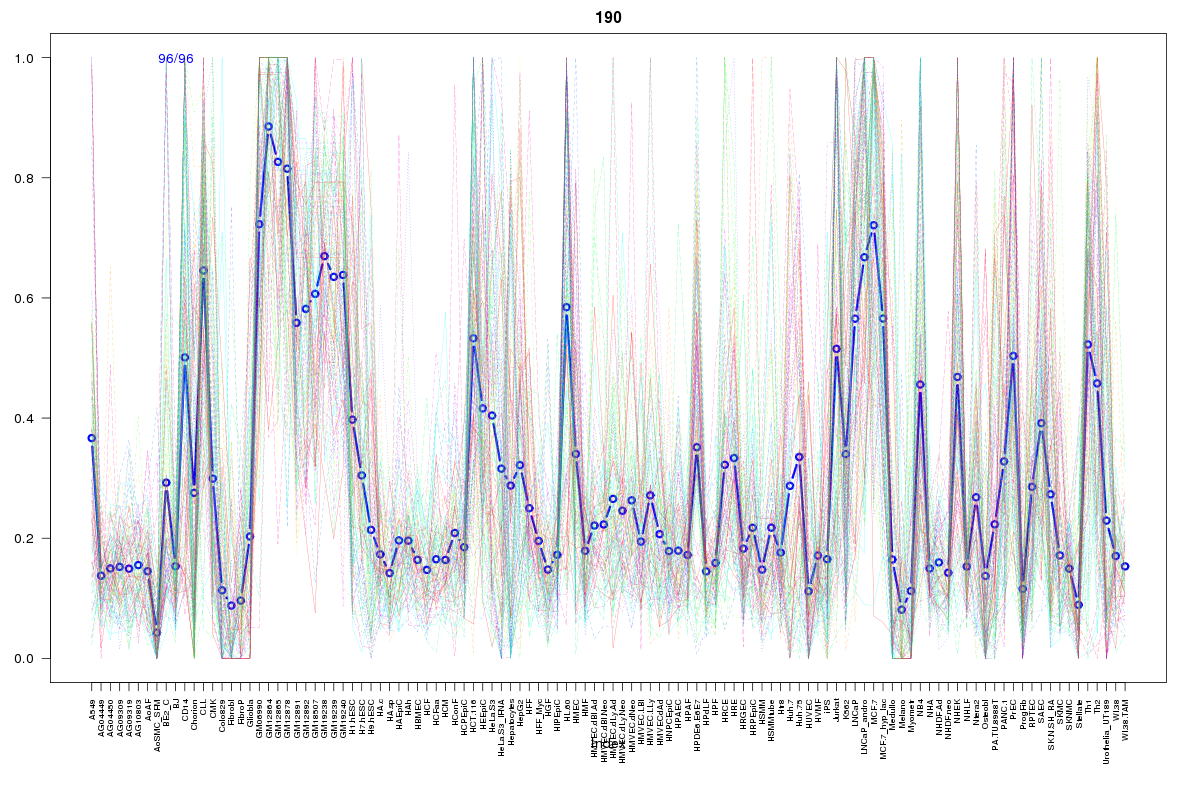 | 190 | 1 |
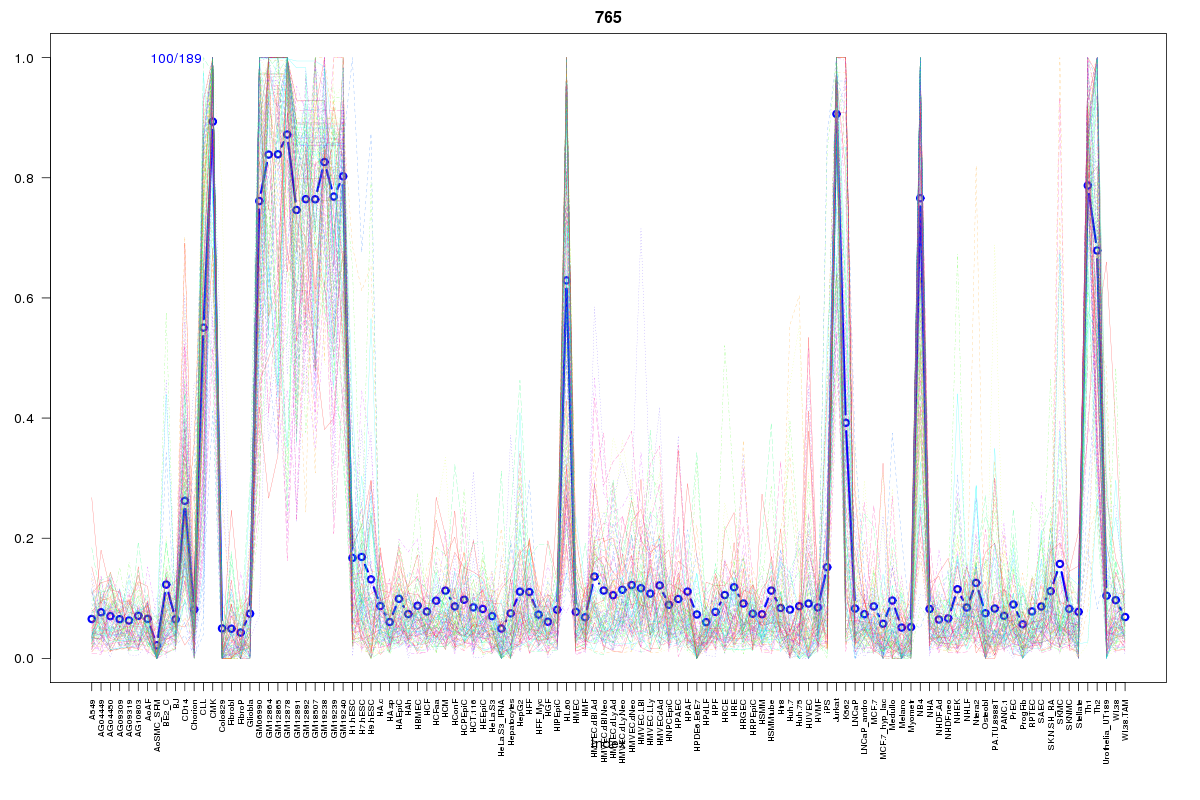 | 765 | 1 |
 | 66 | 1 |
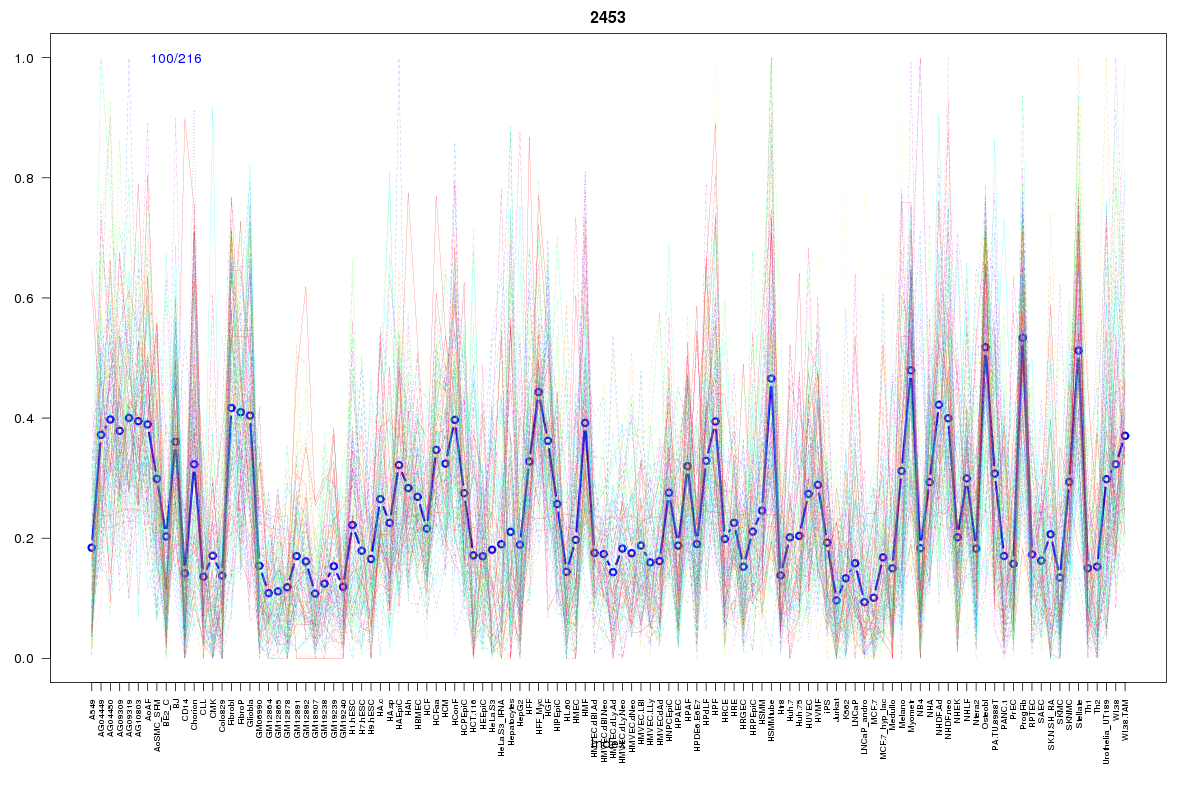 | 2453 | 1 |
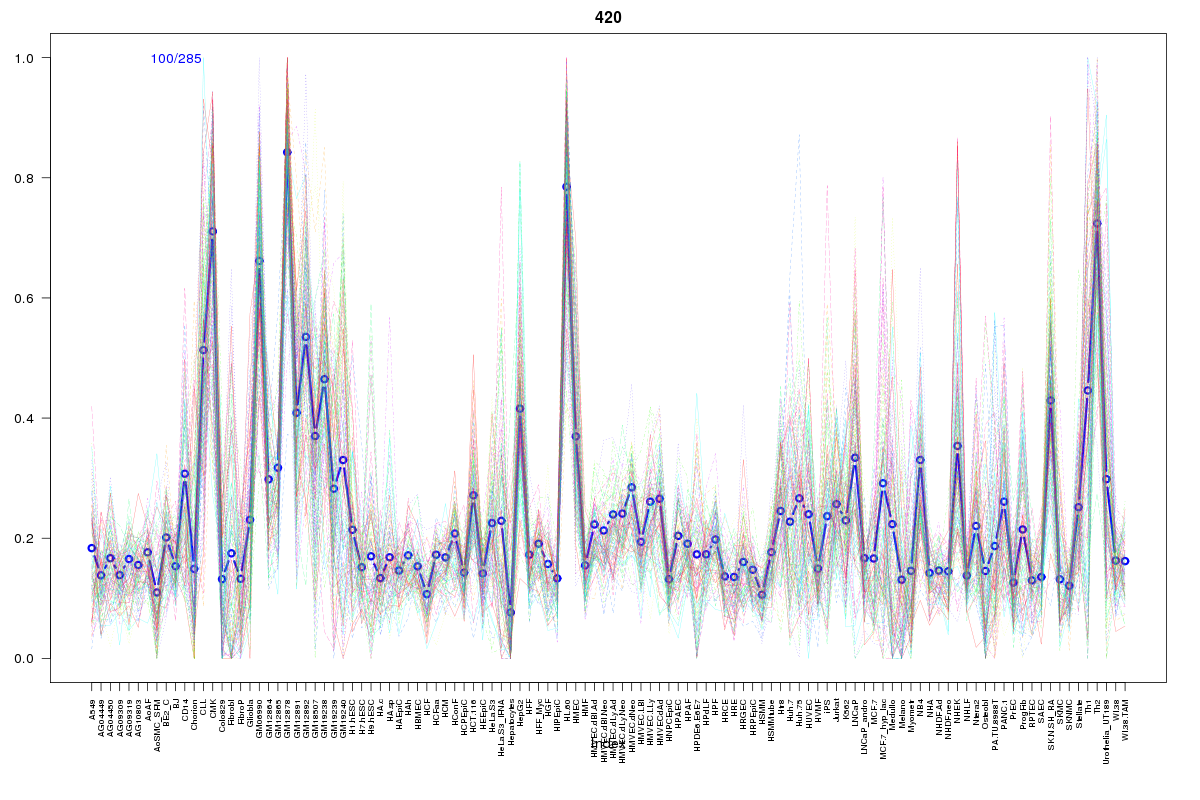 | 420 | 1 |
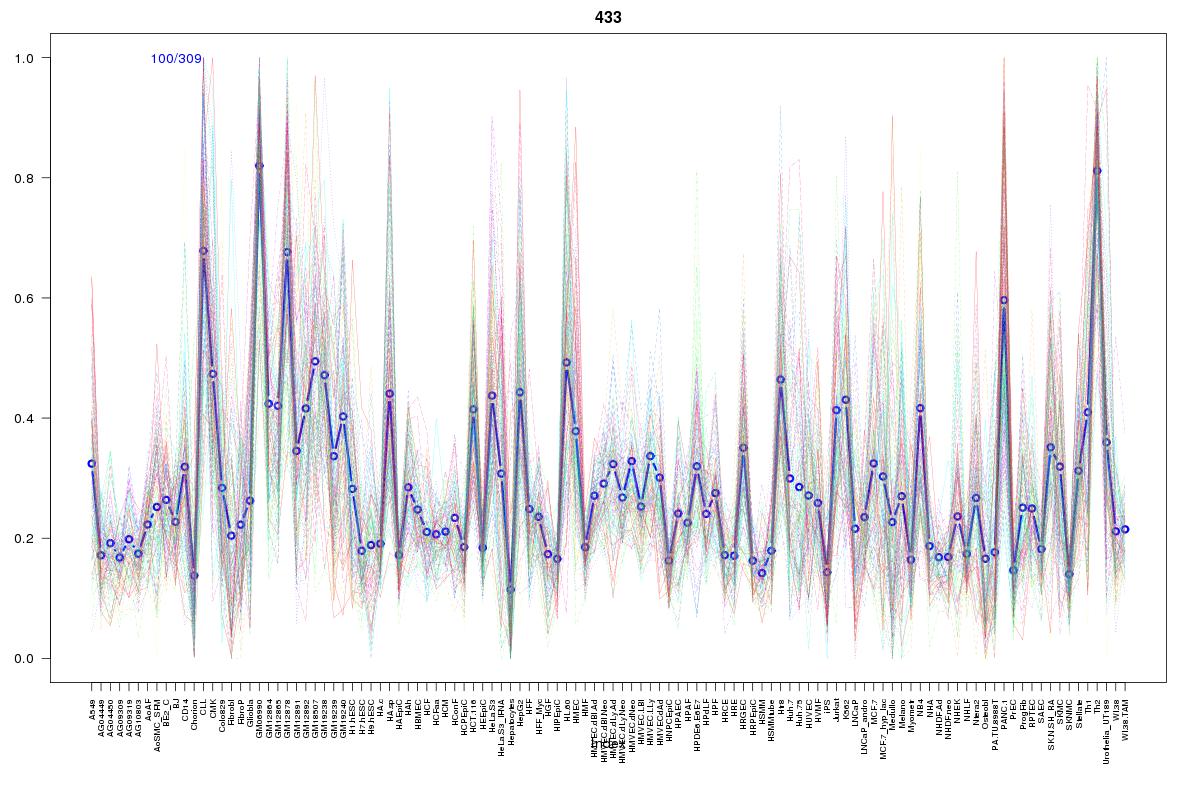 | 433 | 1 |
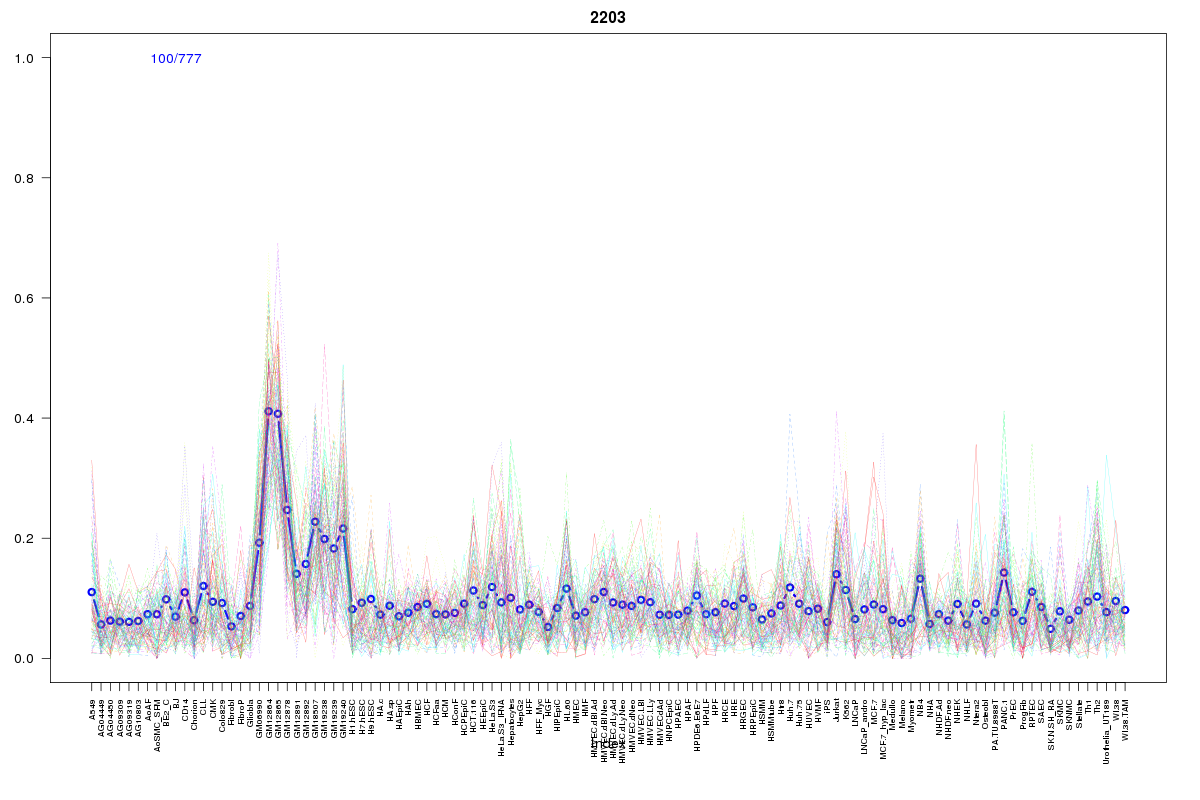 | 2203 | 1 |
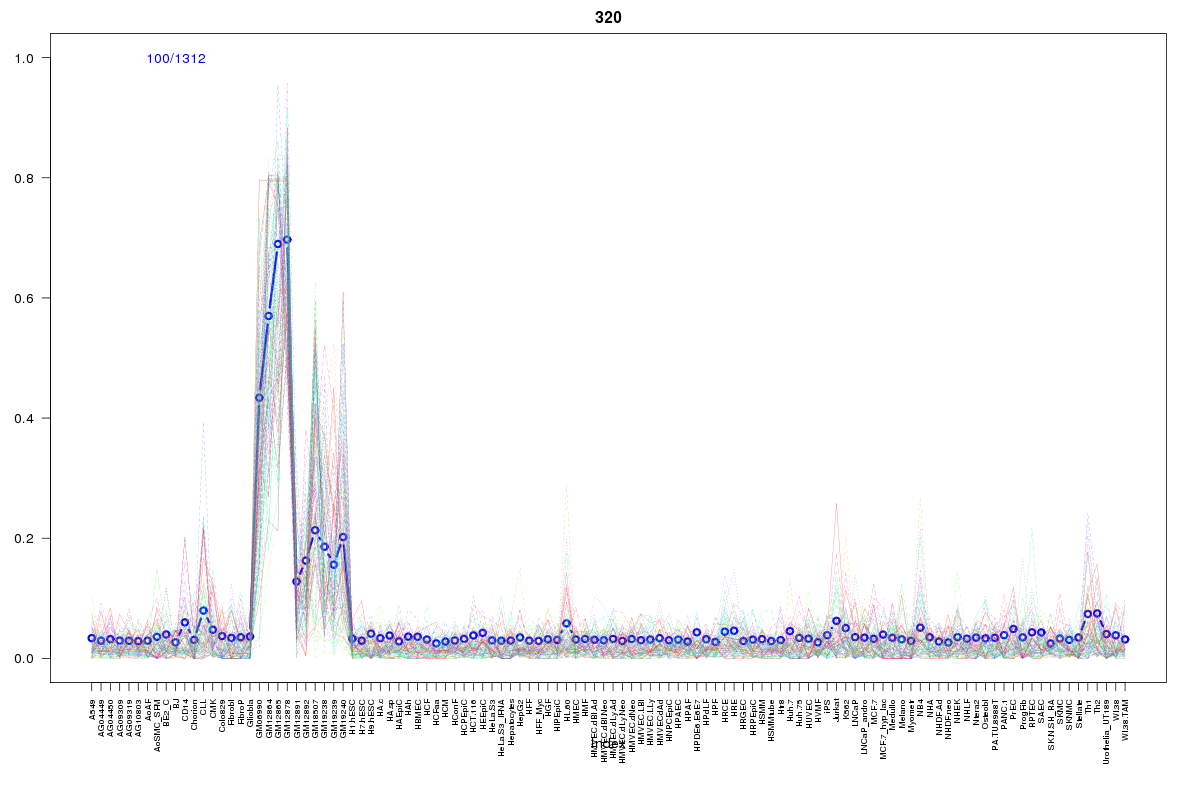 | 320 | 1 |
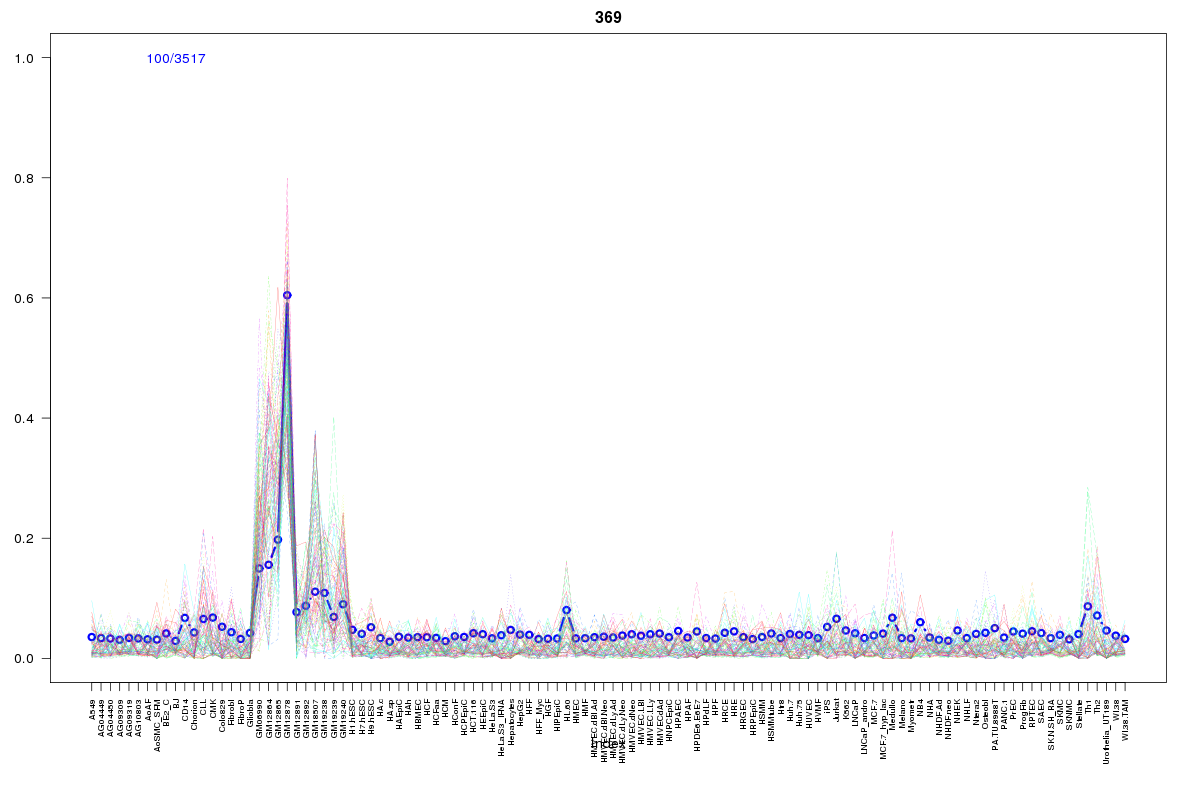 | 369 | 1 |
 | 957 | 1 |
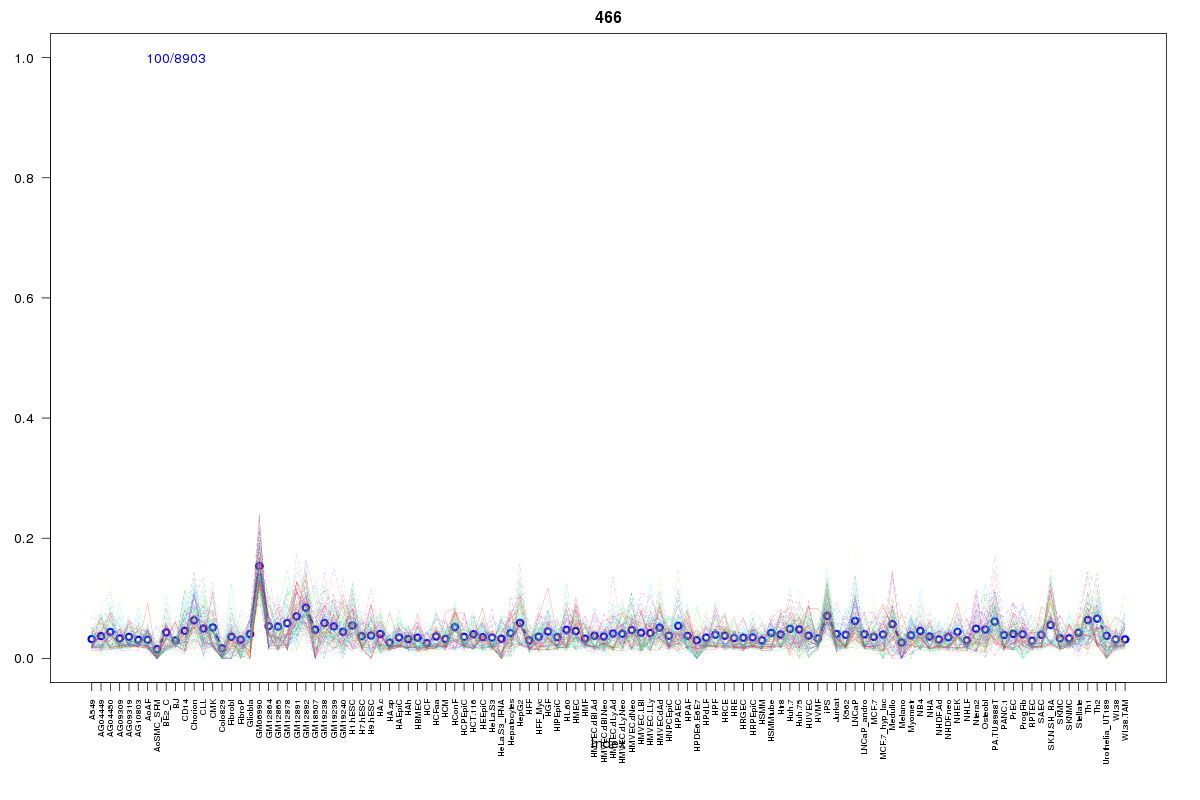 | 466 | 1 |
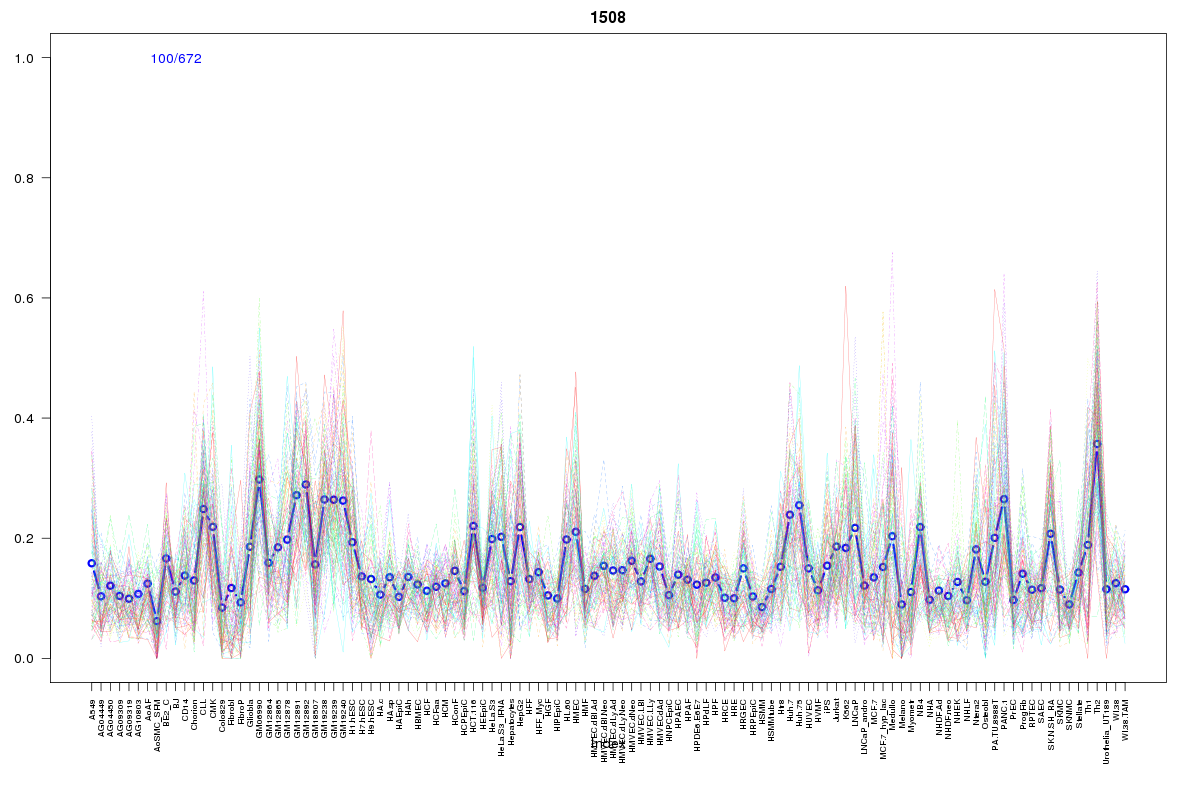 | 1508 | 1 |
Resources
BED file downloads
Connects to 17 DHS sitesTop 10 Correlated DHS Sites
p-values indiciate significant higher or lower correlation| Location | Cluster | P-value |
|---|---|---|
| chr19:49379940-49380090 | 2203 | 0.002 |
| chr19:49361980-49362130 | 190 | 0.004 |
| chr19:49339340-49339490 | 1056 | 0.007 |
| chr19:49362600-49362750 | 765 | 0.009 |
| chr19:49394680-49394830 | 320 | 0.009 |
| chr19:49223605-49223755 | 1508 | 0.011 |
| chr19:49394865-49395015 | 369 | 0.011 |
| chr19:49319360-49319510 | 2065 | 0.011 |
| chr19:49376000-49376150 | 433 | 0.011 |
| chr19:49400705-49400855 | 466 | 0.012 |
| chr19:49375785-49375935 | 420 | 0.015 |
External Databases
UCSCEnsembl (ENSG00000105552)