Gene: ATP4A
chr19: 36040944-36054560Expression Profile
(log scale)
Graphical Connections
Distribution of linked clusters:
You may find it interesting if many of the connected DHS sites belong to the same cluster.| Cluster Profile | Cluster ID | Number of DHS sites in this cluster |
|---|---|---|
 | 569 | 2 |
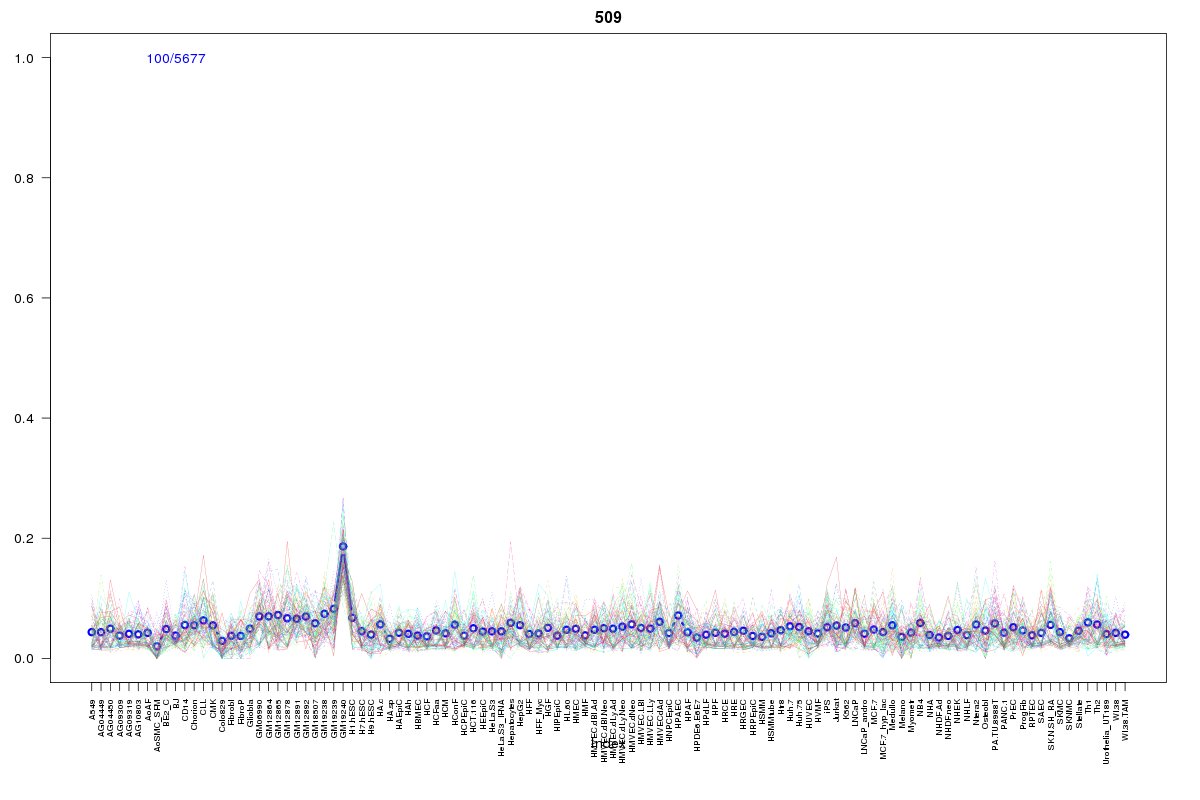 | 509 | 2 |
 | 2055 | 2 |
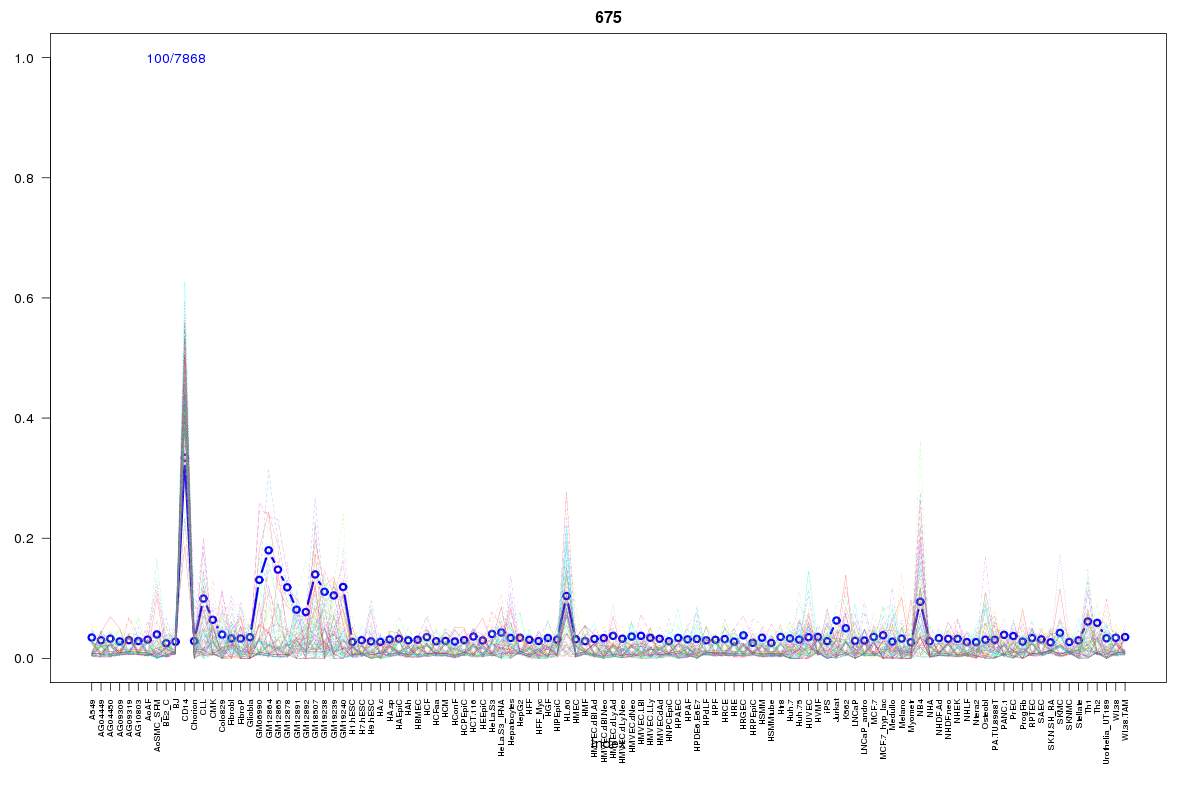 | 675 | 1 |
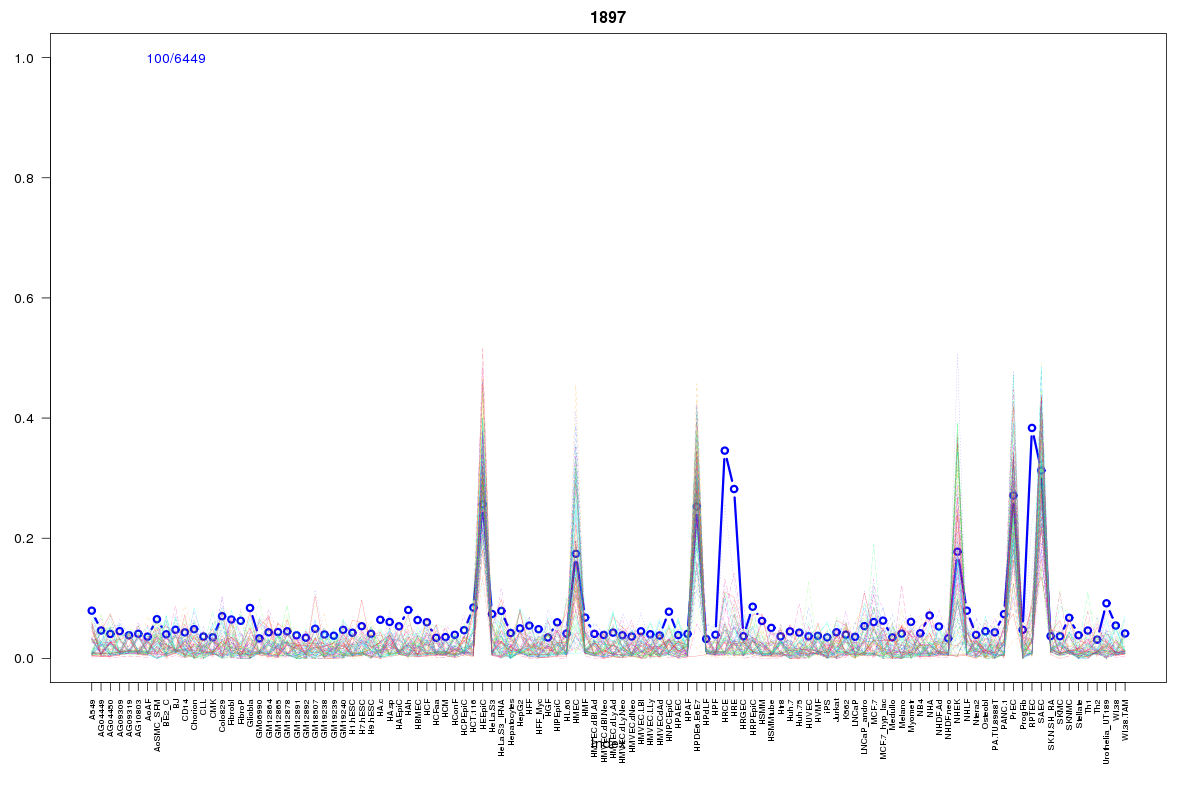 | 1897 | 1 |
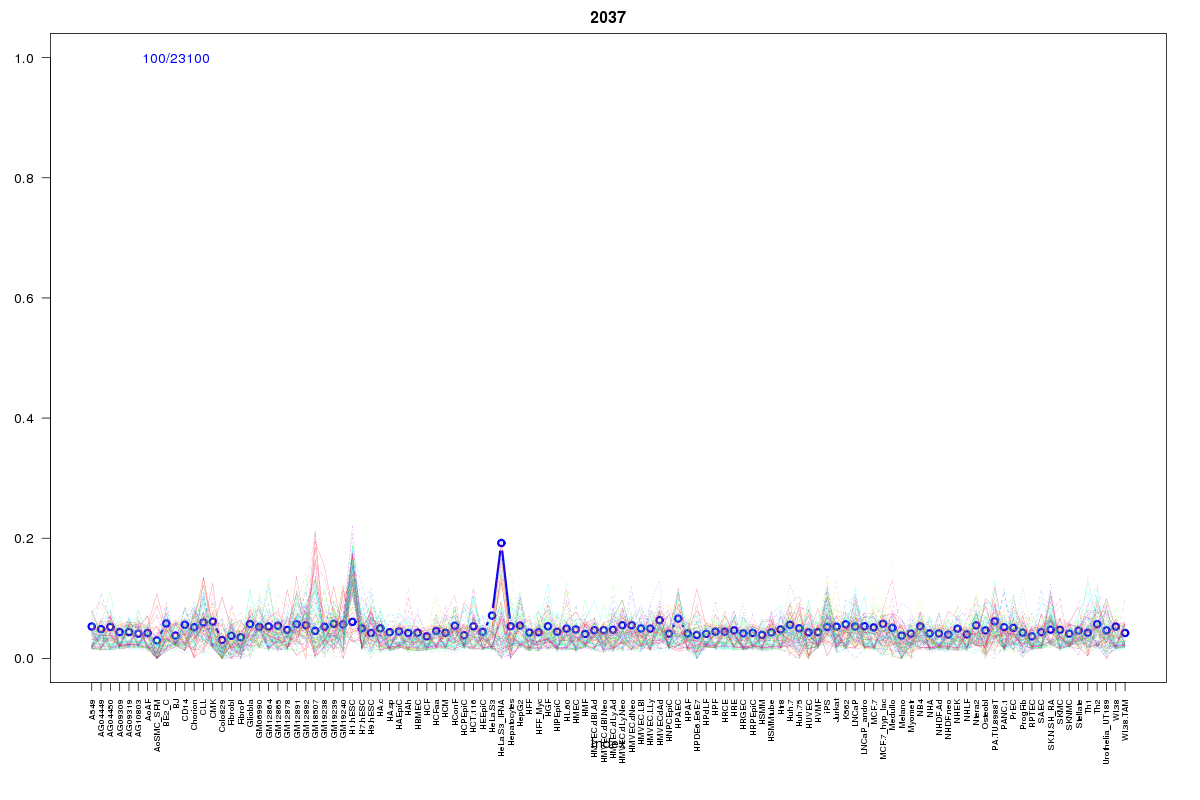 | 2037 | 1 |
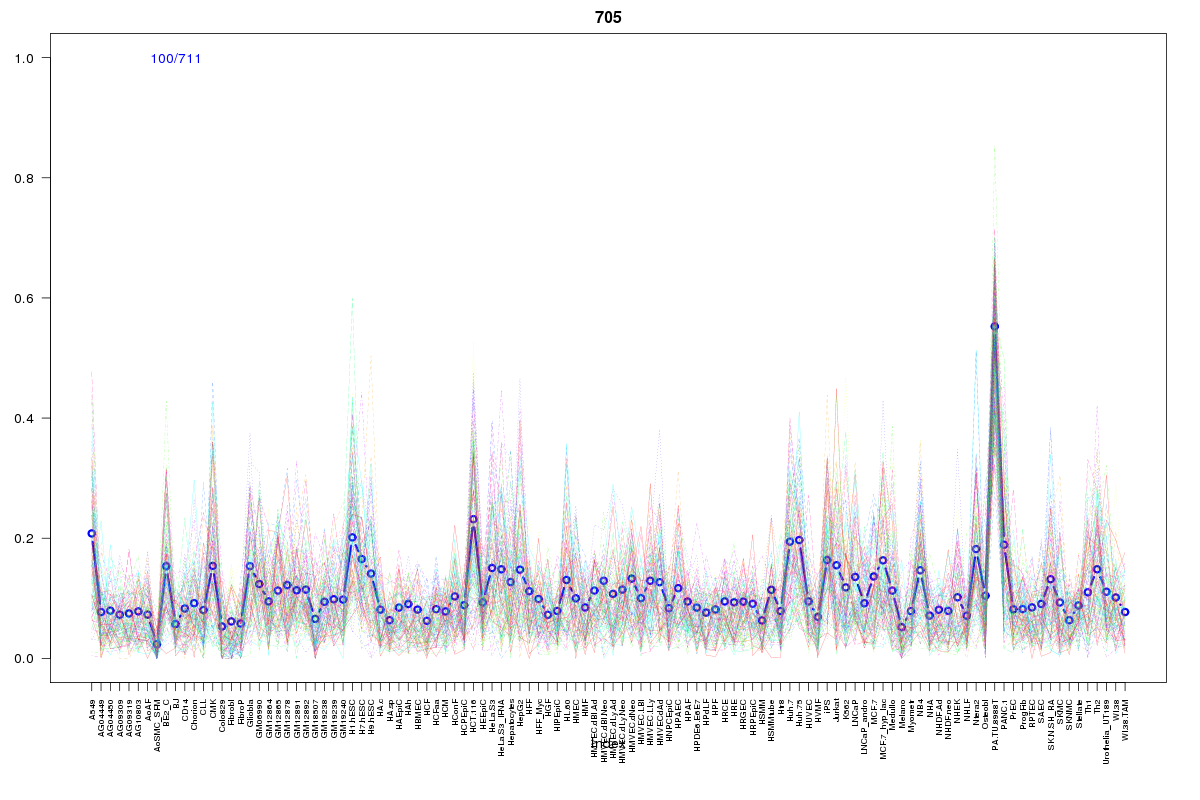 | 705 | 1 |
 | 2191 | 1 |
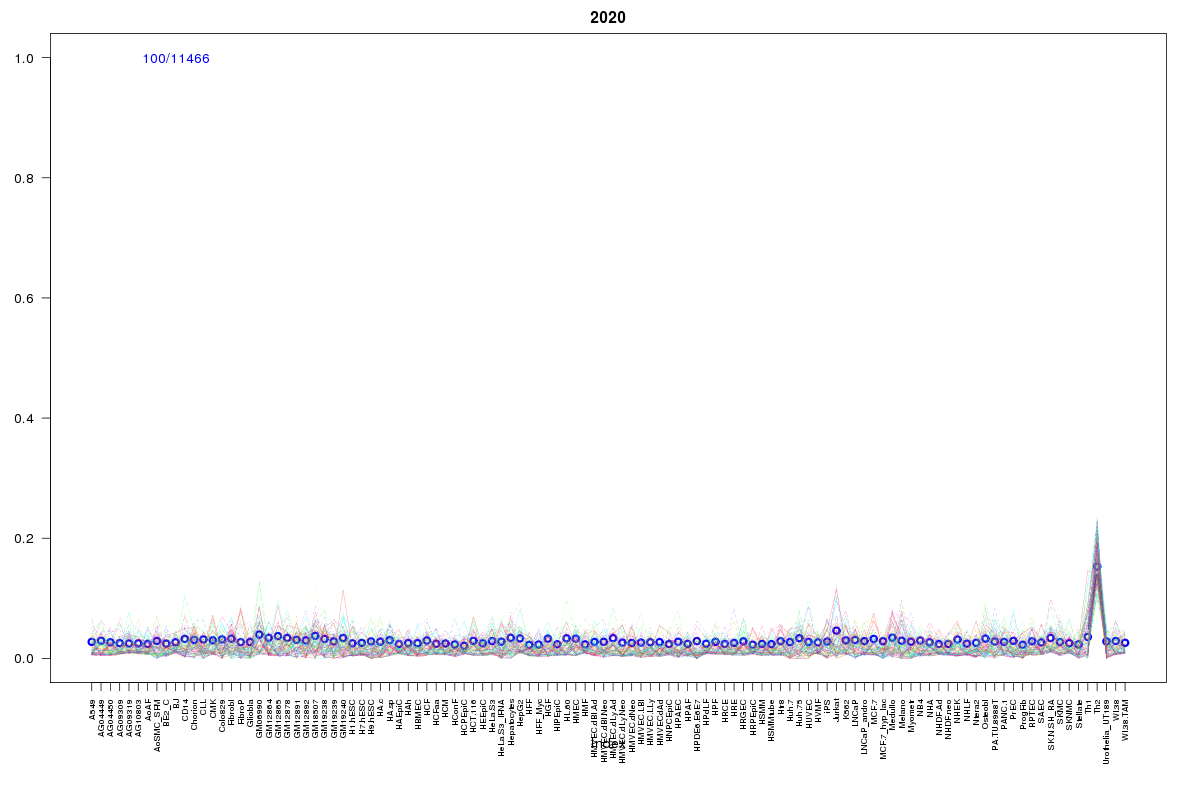 | 2020 | 1 |
 | 1213 | 1 |
 | 881 | 1 |
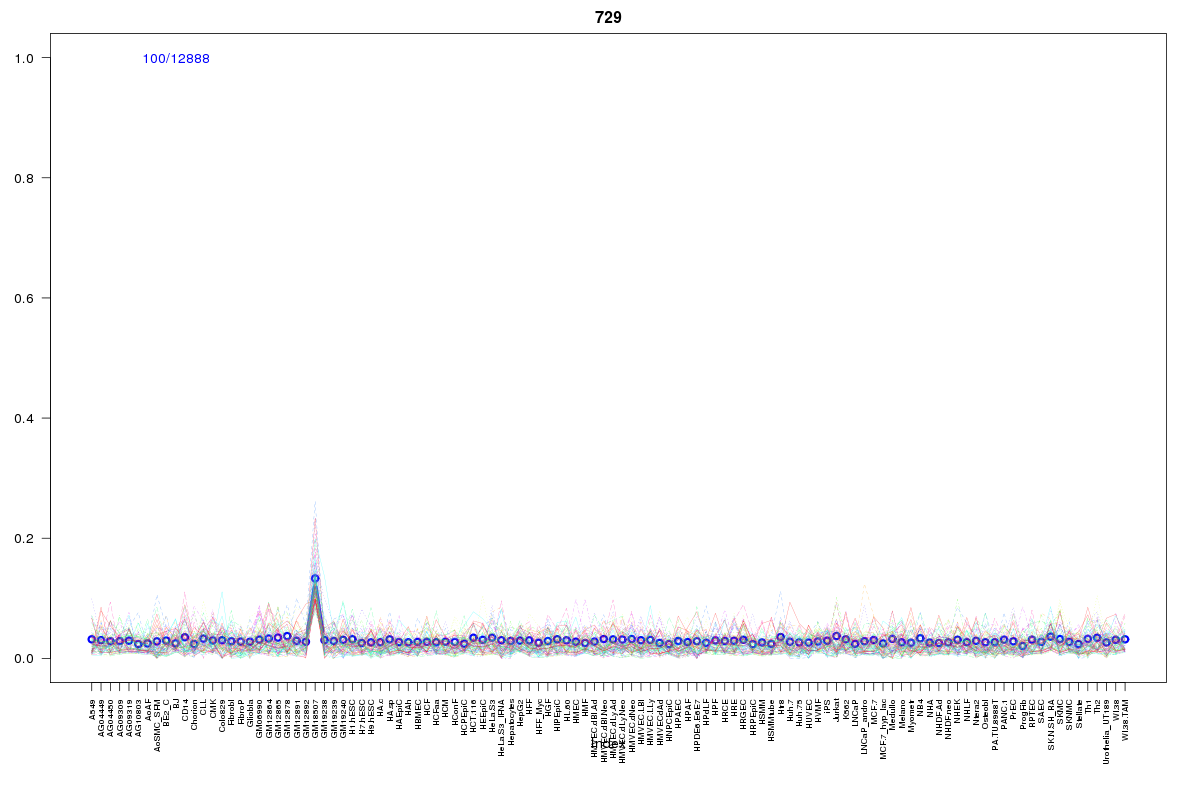 | 729 | 1 |
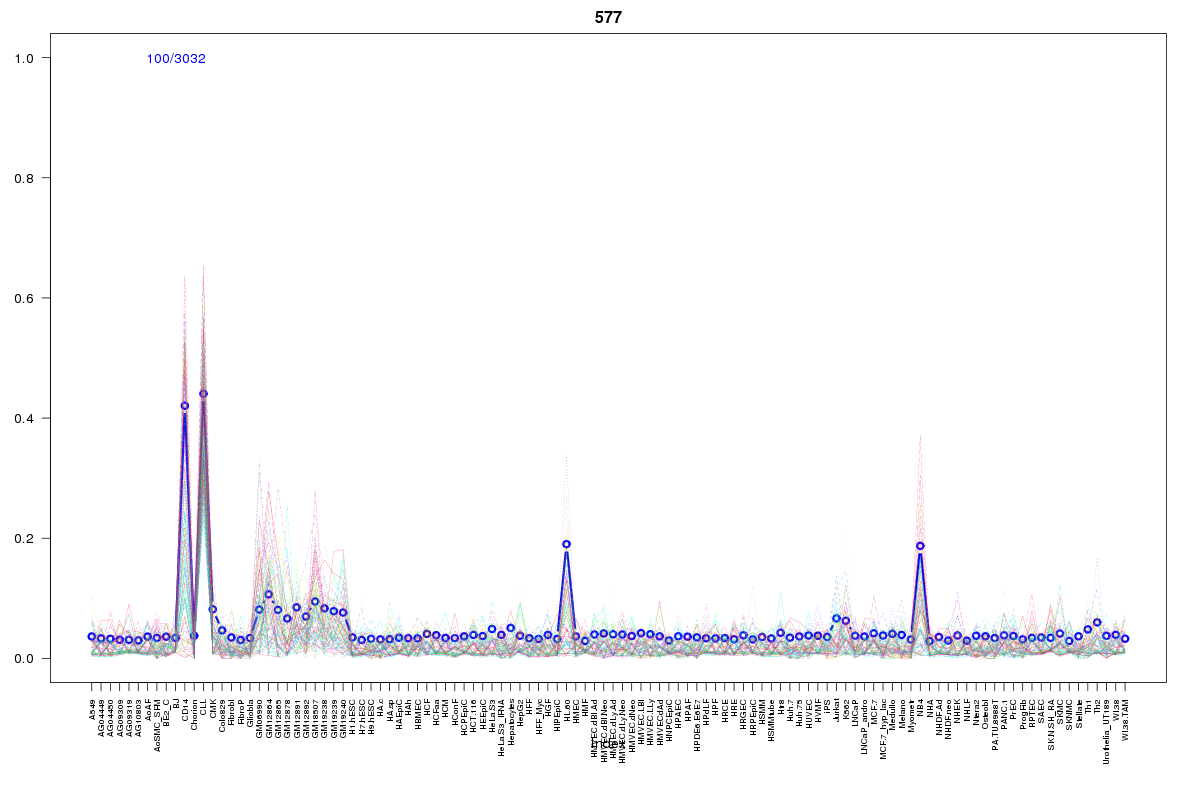 | 577 | 1 |
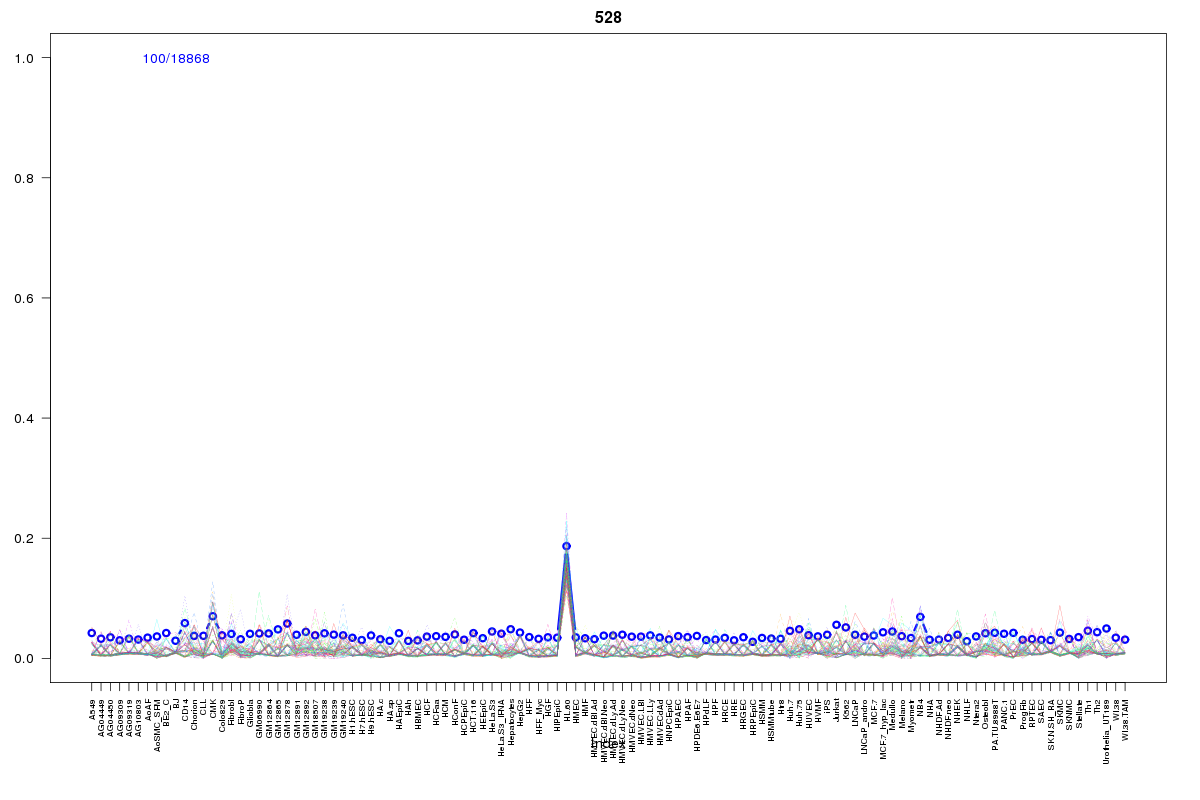 | 528 | 1 |
 | 1970 | 1 |
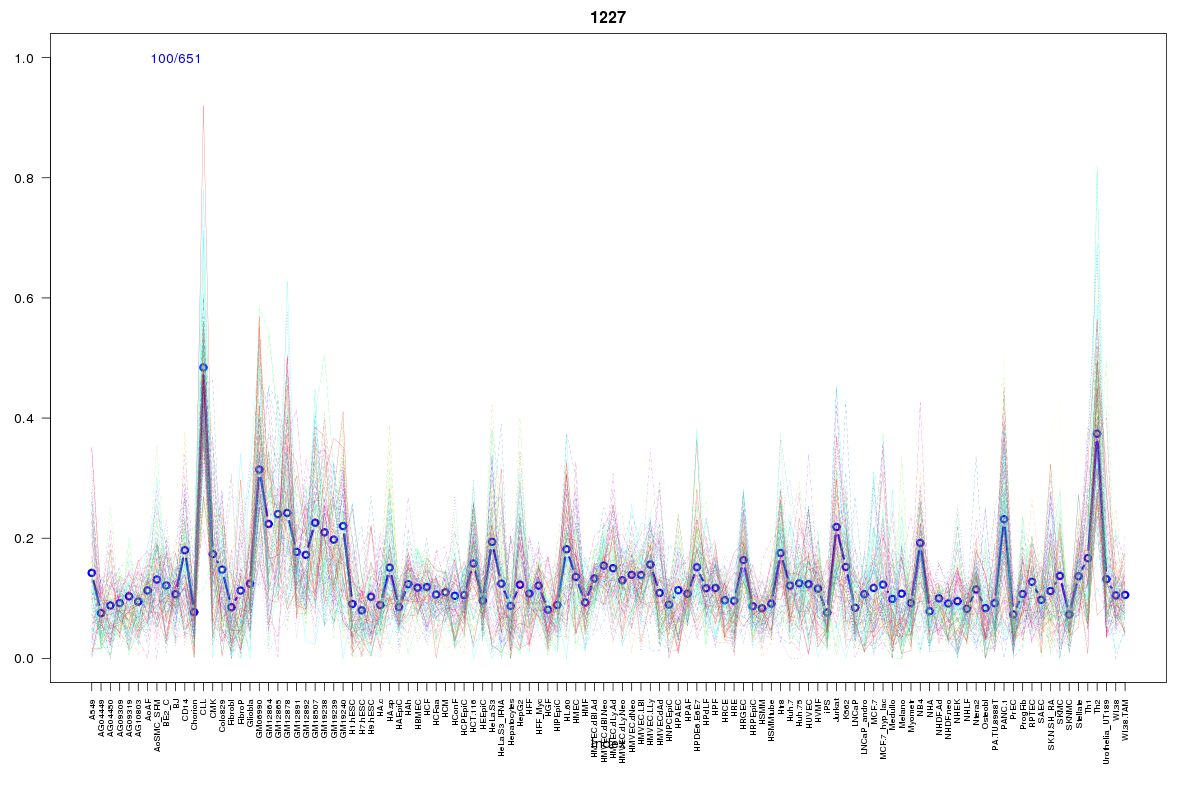 | 1227 | 1 |
 | 2211 | 1 |
Resources
BED file downloads
Connects to 20 DHS sitesTop 10 Correlated DHS Sites
p-values indiciate significant higher or lower correlation| Location | Cluster | P-value |
|---|---|---|
| chr19:36127765-36127915 | 569 | 0.002 |
| chr19:35952300-35952450 | 2211 | 0.005 |
| chr19:36001145-36001295 | 2191 | 0.005 |
| chr19:35984980-35985130 | 1897 | 0.012 |
| chr19:35995025-35995175 | 2037 | 0.012 |
| chr19:35995705-35995855 | 569 | 0.015 |
| chr19:36074385-36074535 | 729 | 0.016 |
| chr19:36000685-36000835 | 705 | 0.017 |
| chr19:36054440-36054590 | 2055 | 0.023 |
| chr19:36036645-36036795 | 1213 | 0.02 |
| chr19:36114125-36114275 | 2055 | 0.019 |
External Databases
UCSCEnsembl (ENSG00000105675)