Gene: PITX3
chr10: 103989942-103991840Expression Profile
(log scale)
Graphical Connections
Distribution of linked clusters:
You may find it interesting if many of the connected DHS sites belong to the same cluster.| Cluster Profile | Cluster ID | Number of DHS sites in this cluster |
|---|---|---|
 | 15 | 2 |
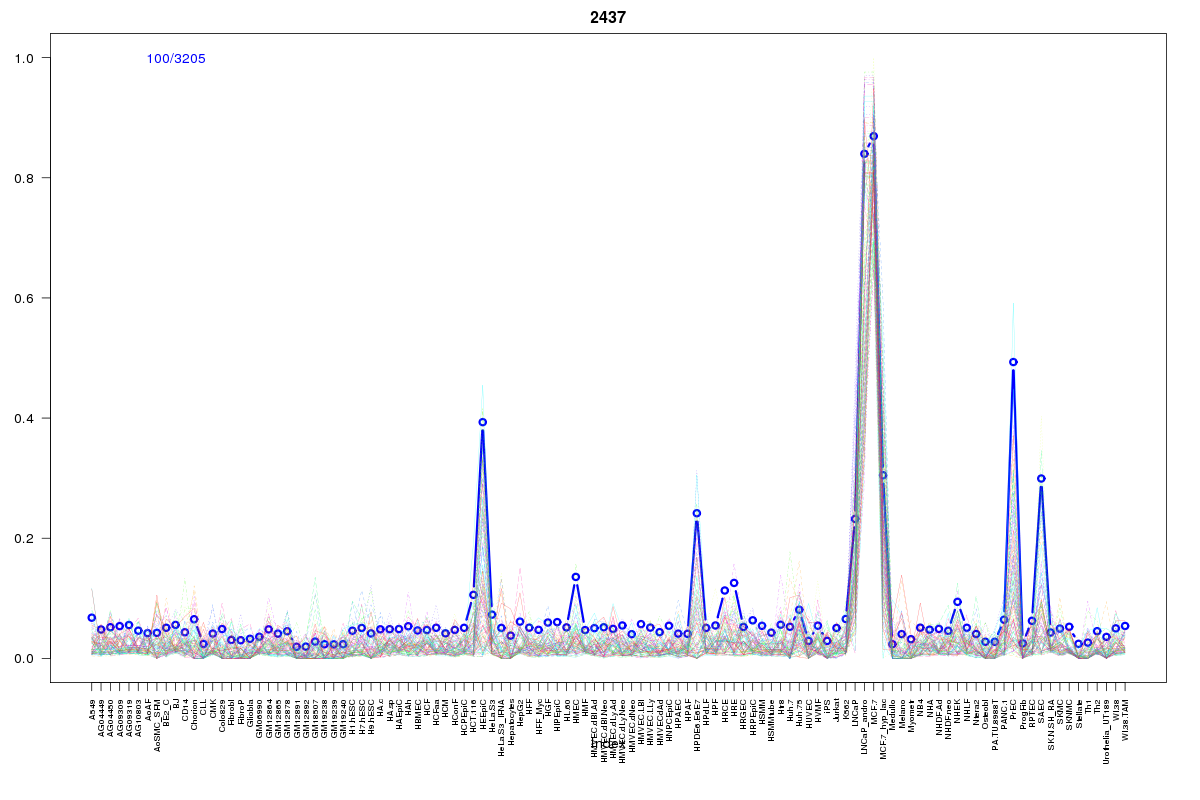 | 2437 | 1 |
 | 66 | 1 |
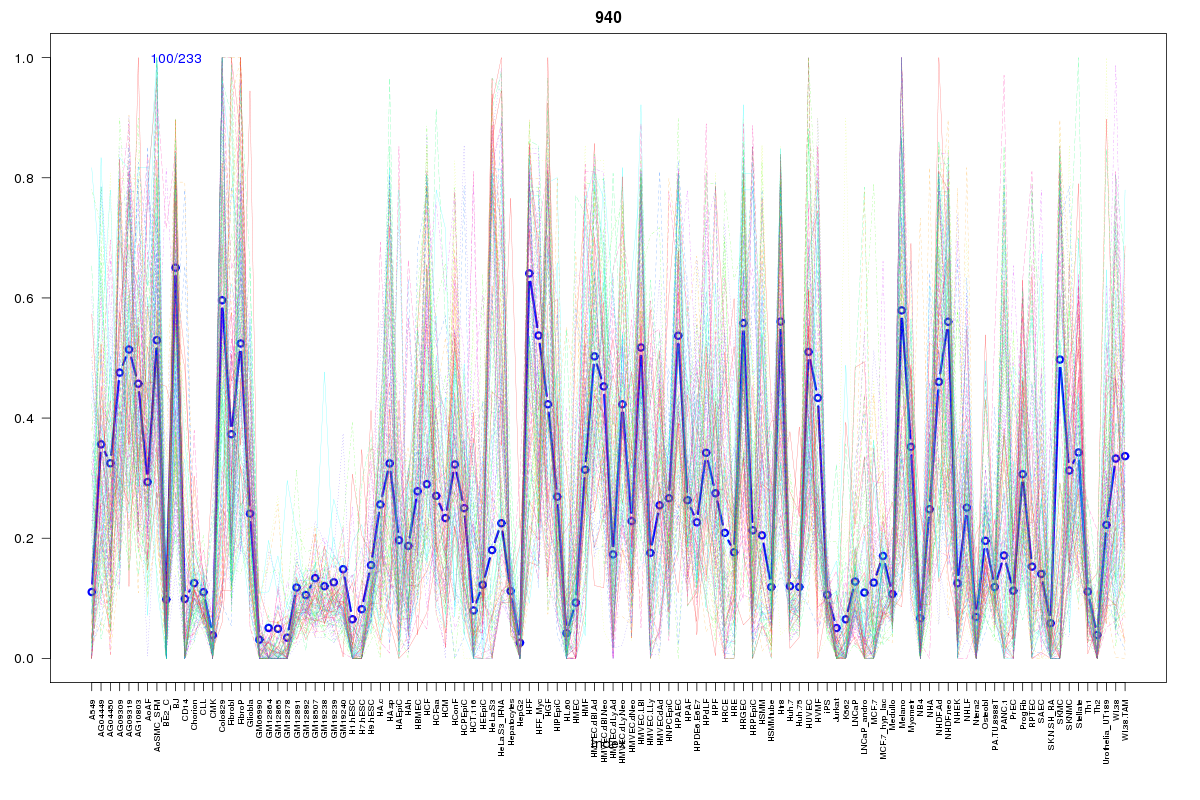 | 940 | 1 |
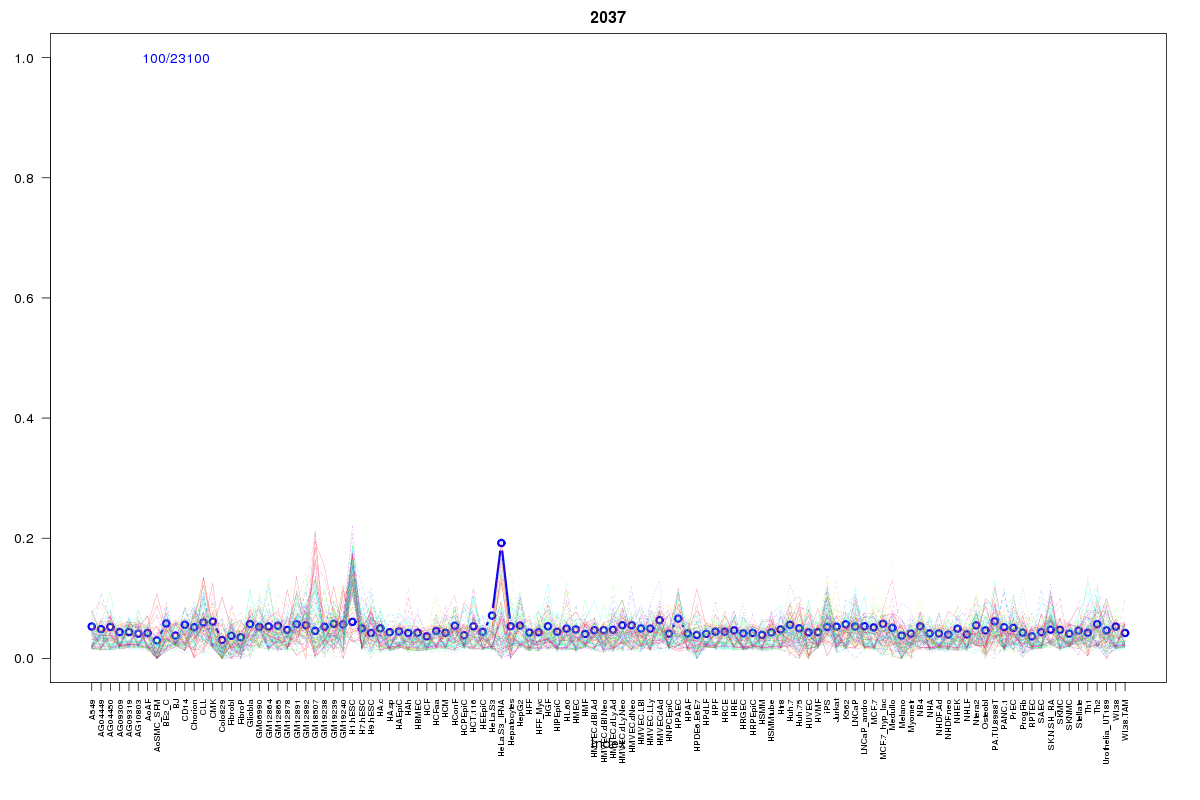 | 2037 | 1 |
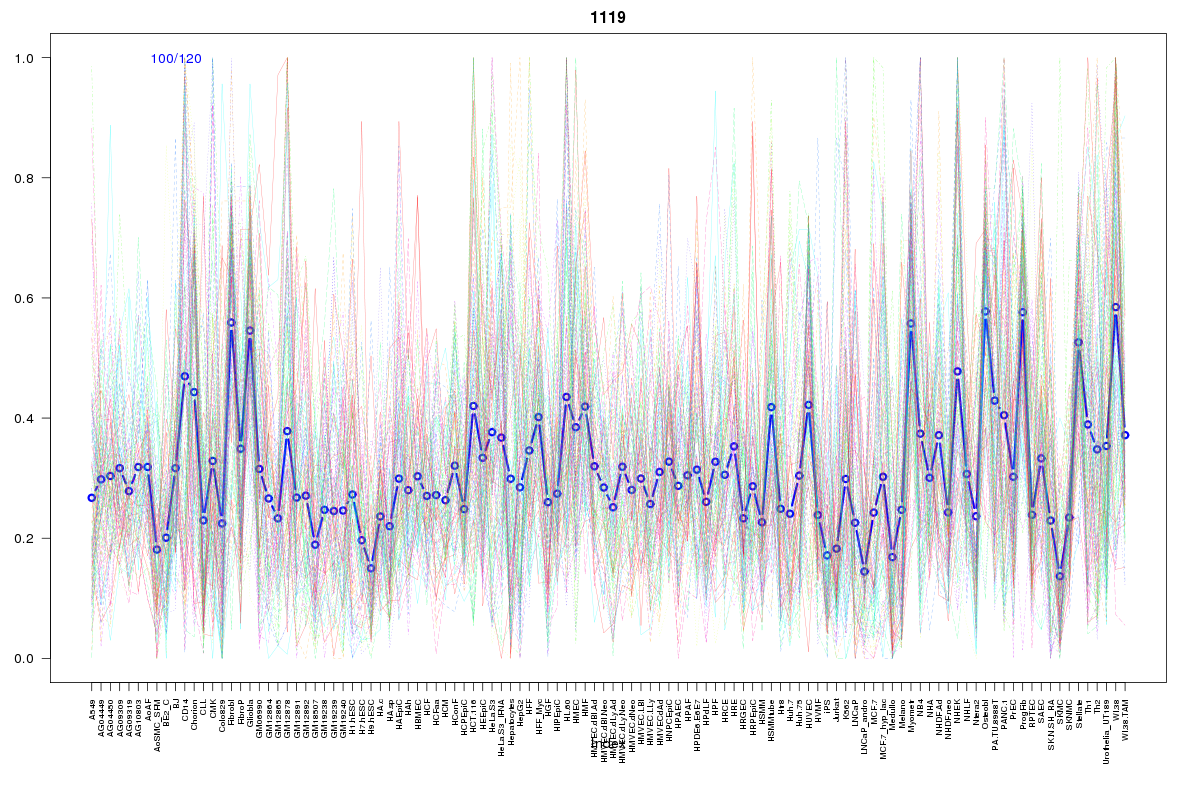 | 1119 | 1 |
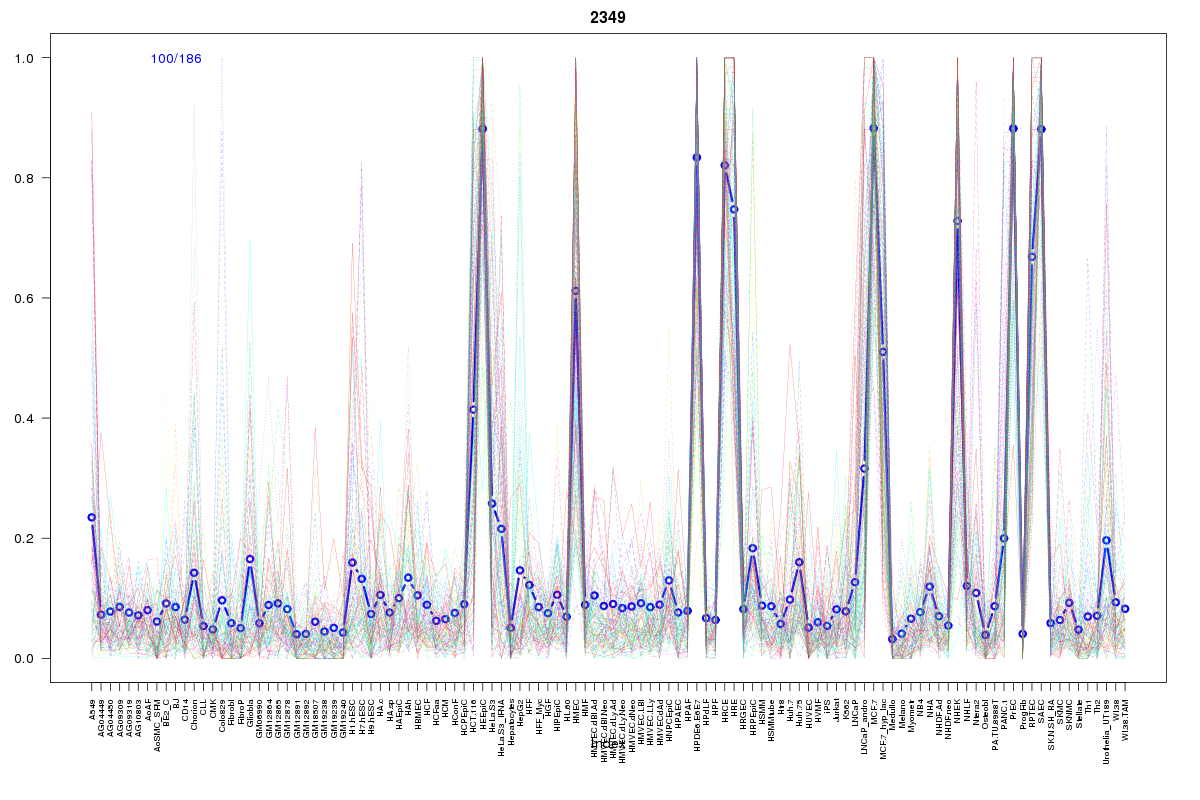 | 2349 | 1 |
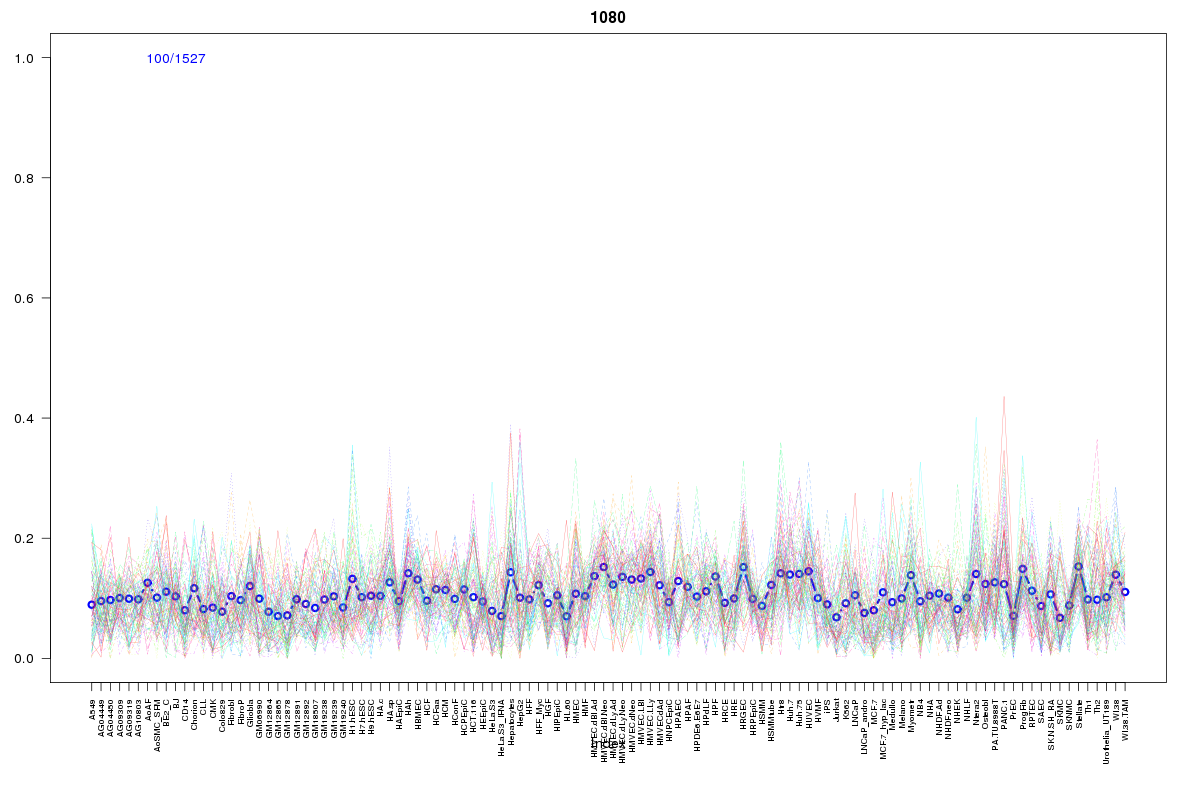 | 1080 | 1 |
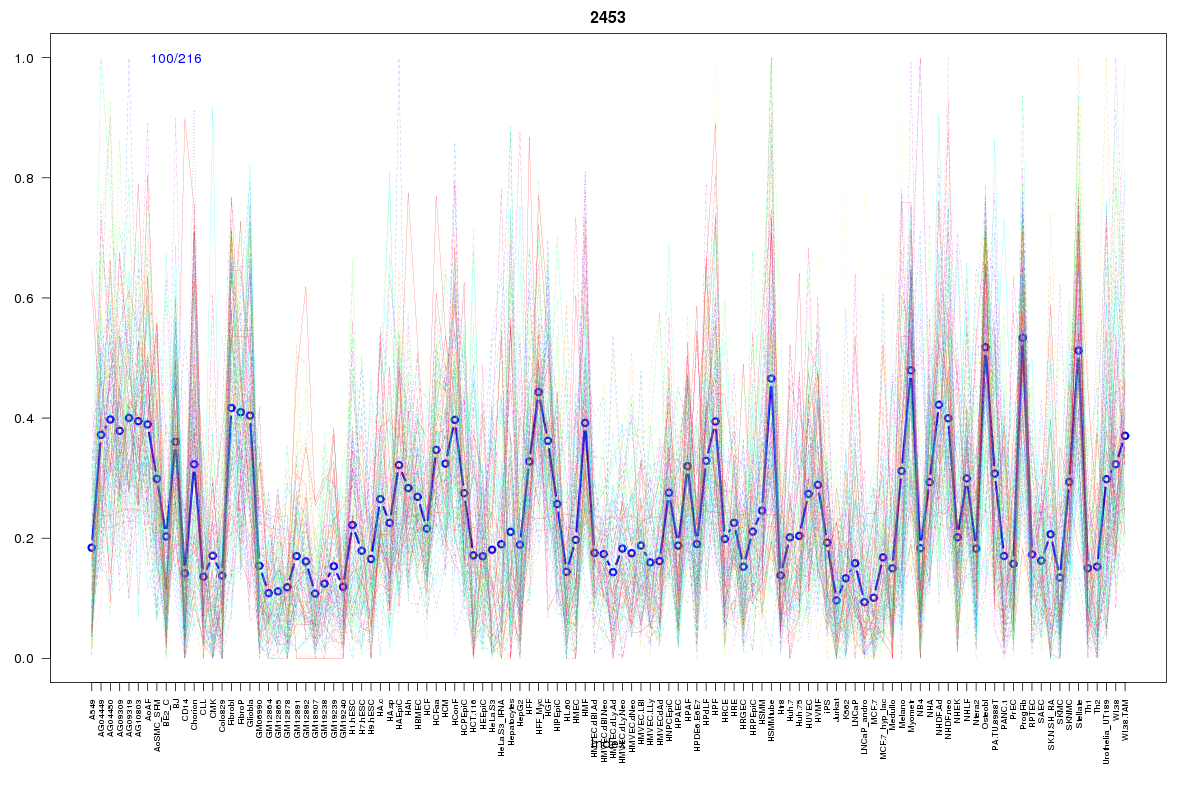 | 2453 | 1 |
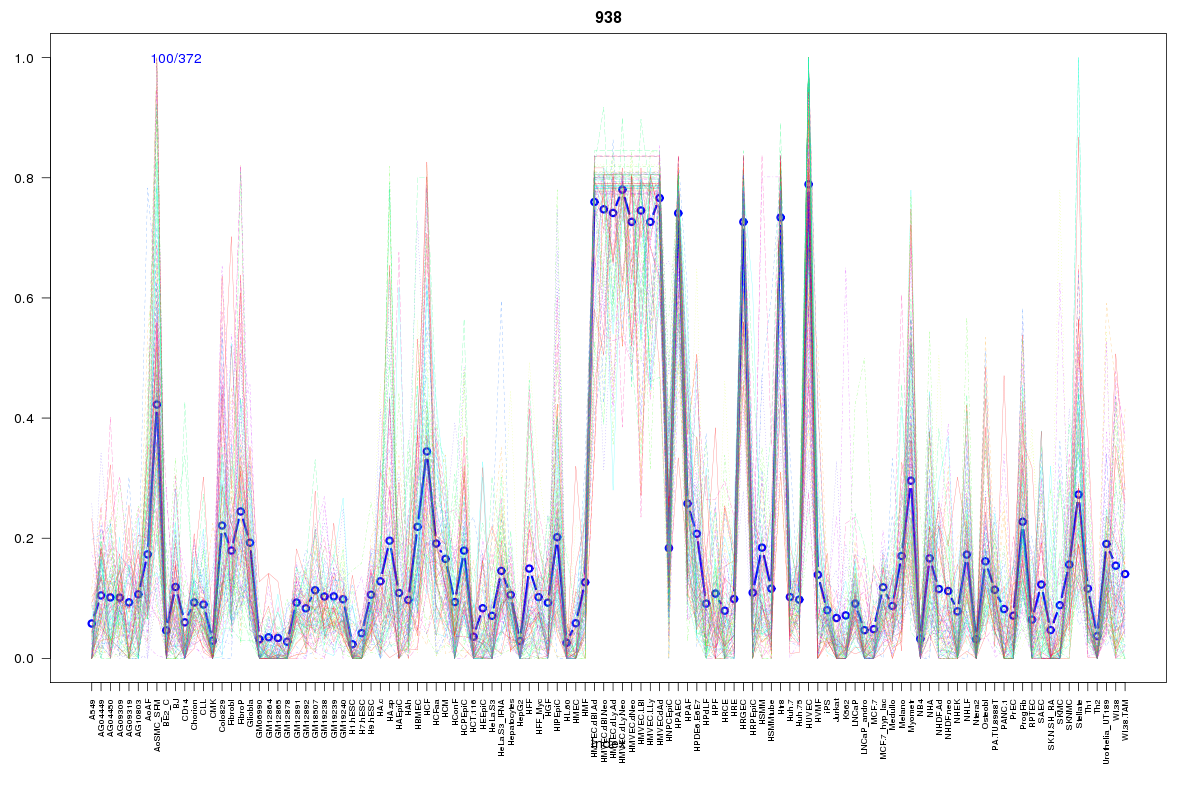 | 938 | 1 |
 | 510 | 1 |
 | 2394 | 1 |
 | 860 | 1 |
 | 569 | 1 |
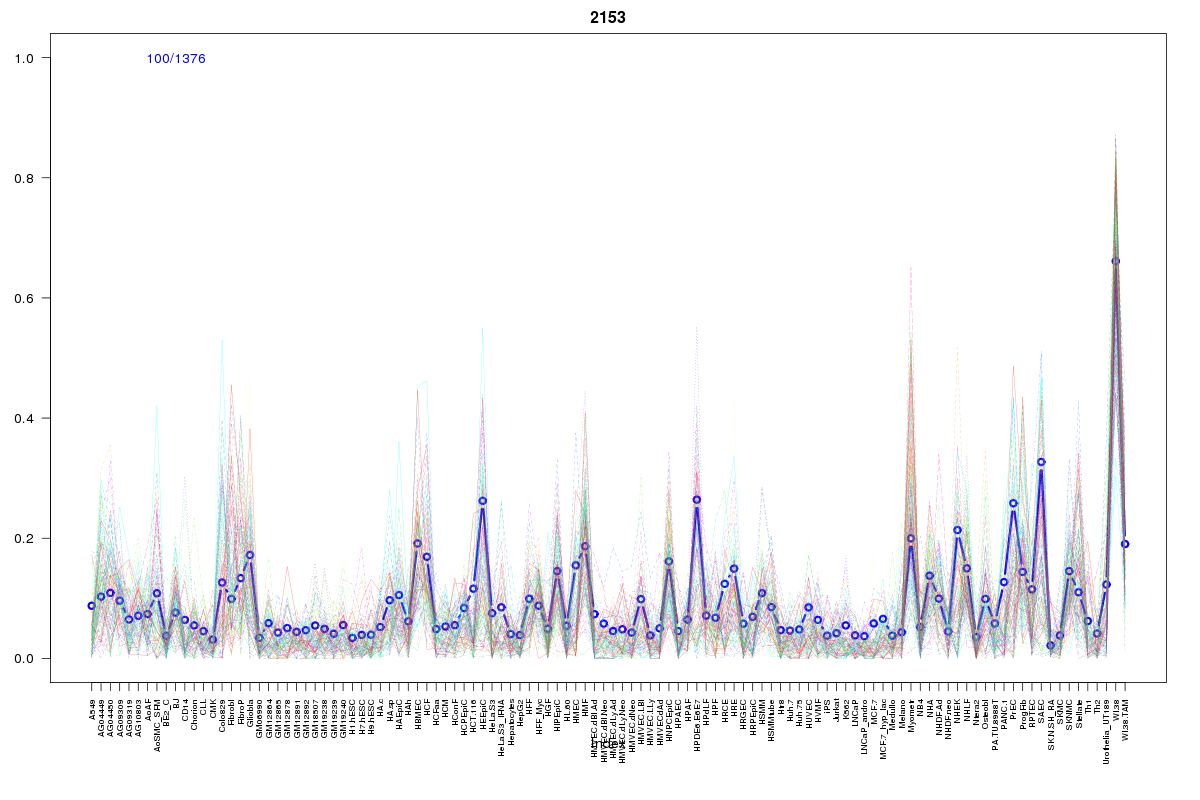 | 2153 | 1 |
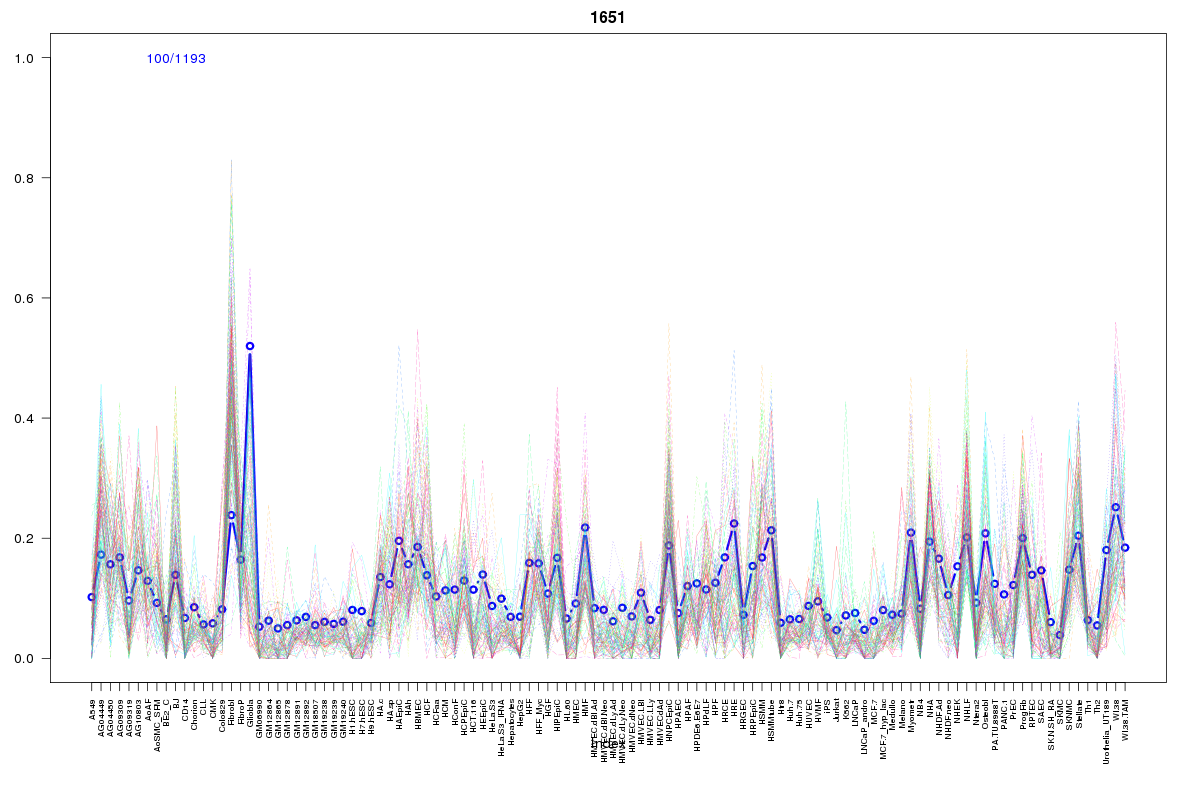 | 1651 | 1 |
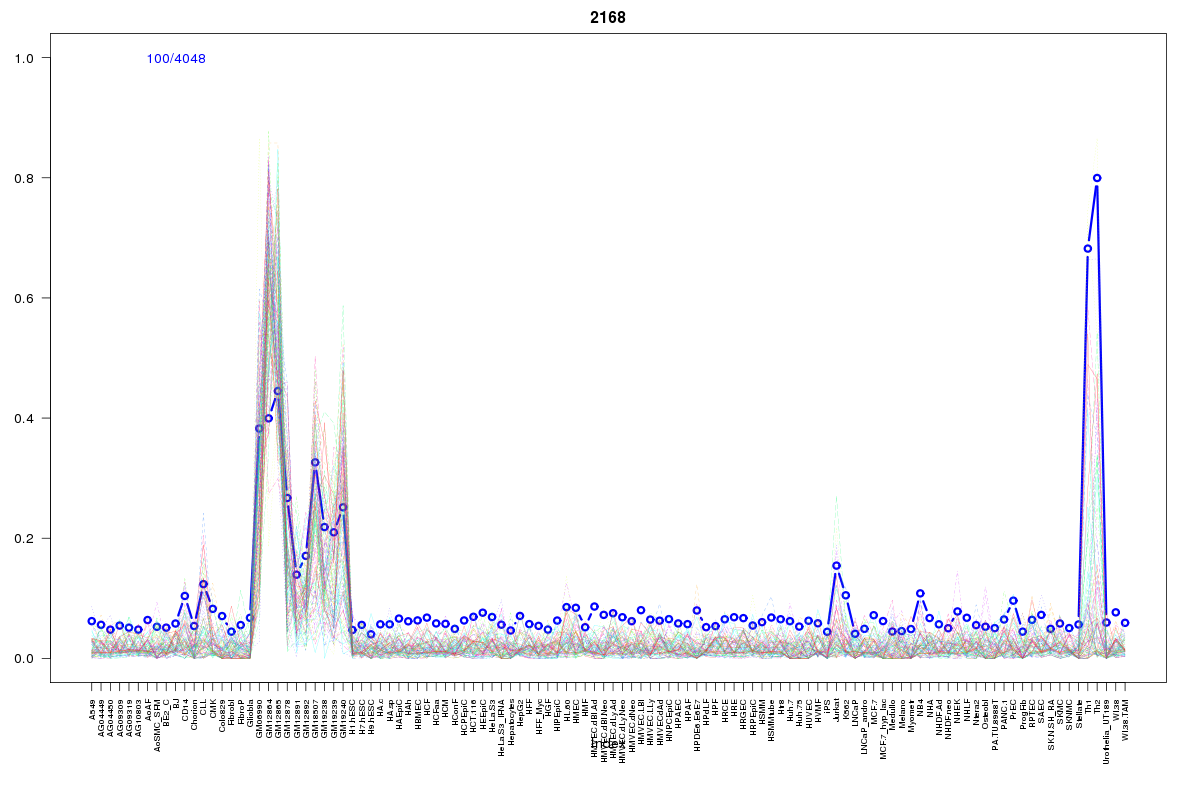 | 2168 | 1 |
Resources
BED file downloads
Connects to 18 DHS sitesTop 10 Correlated DHS Sites
p-values indiciate significant higher or lower correlation| Location | Cluster | P-value |
|---|---|---|
| chr10:103989885-103990035 | 1119 | 0.007 |
| chr10:103958640-103958790 | 2437 | 0.009 |
| chr10:104001660-104001810 | 2453 | 0.009 |
| chr10:103918900-103919050 | 2153 | 0.01 |
| chr10:103911280-103911430 | 2394 | 0.014 |
| chr10:103935340-103935490 | 1651 | 0.016 |
| chr10:103916880-103917030 | 569 | 0.016 |
| chr10:103995420-103995570 | 2349 | 0.018 |
| chr10:104040480-104040630 | 938 | 0.023 |
| chr10:104000465-104000615 | 1080 | 0.023 |
| chr10:103985400-103985550 | 940 | 0.024 |
External Databases
UCSCEnsembl (ENSG00000107859)