Gene: ACAP3
chr1: 1227755-1243398Expression Profile
(log scale)
Graphical Connections
Distribution of linked clusters:
You may find it interesting if many of the connected DHS sites belong to the same cluster.| Cluster Profile | Cluster ID | Number of DHS sites in this cluster |
|---|---|---|
 | 2122 | 3 |
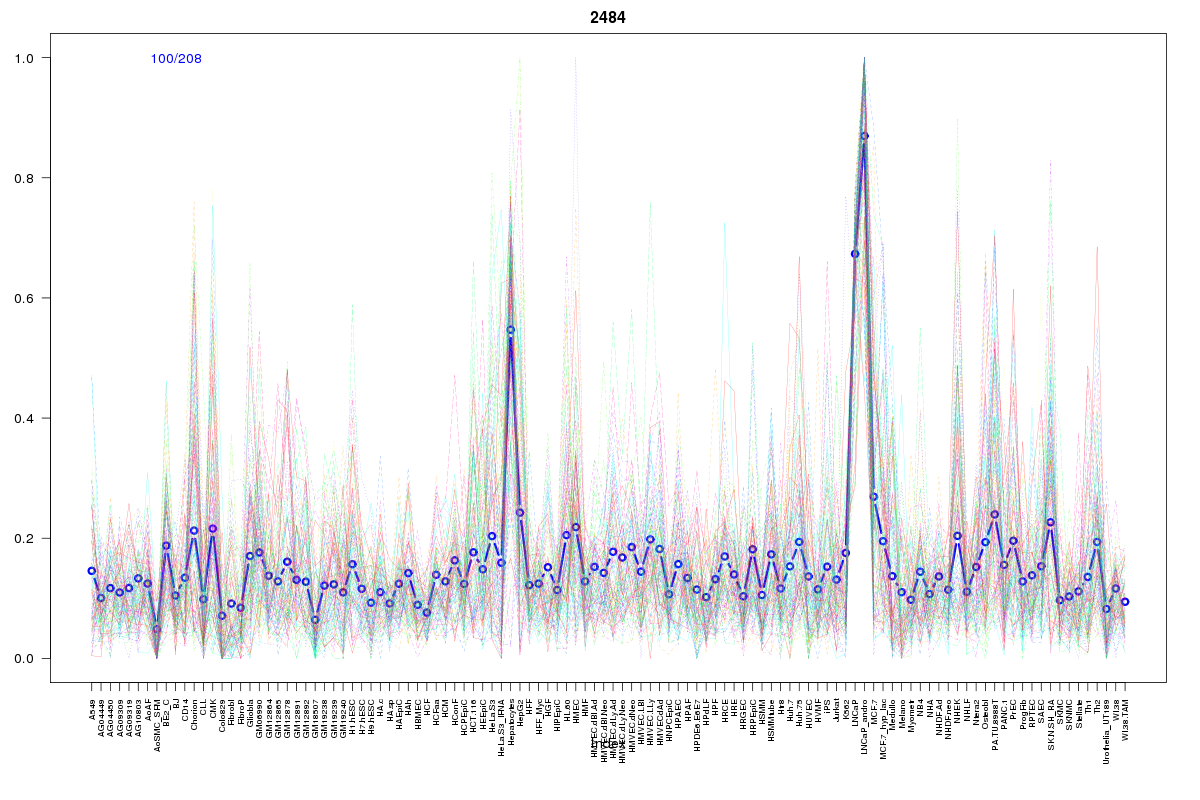 | 2484 | 2 |
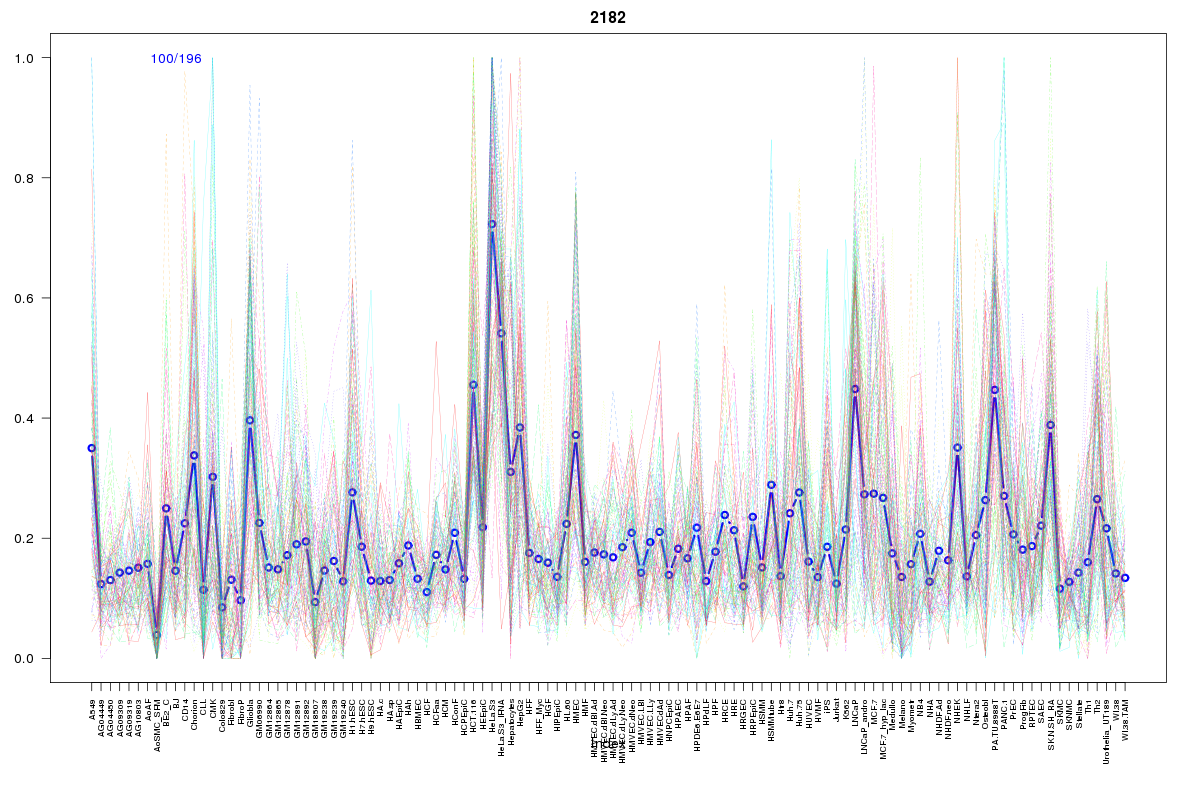 | 2182 | 2 |
 | 2279 | 1 |
 | 77 | 1 |
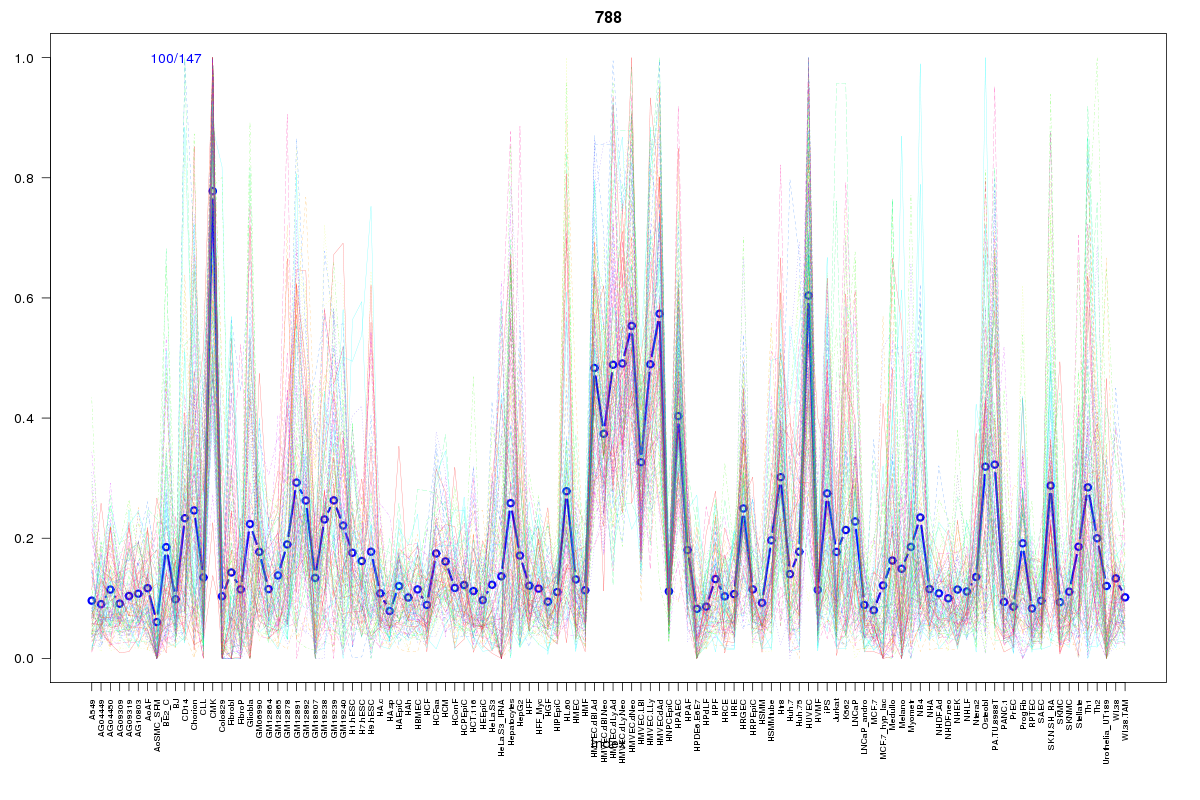 | 788 | 1 |
 | 1072 | 1 |
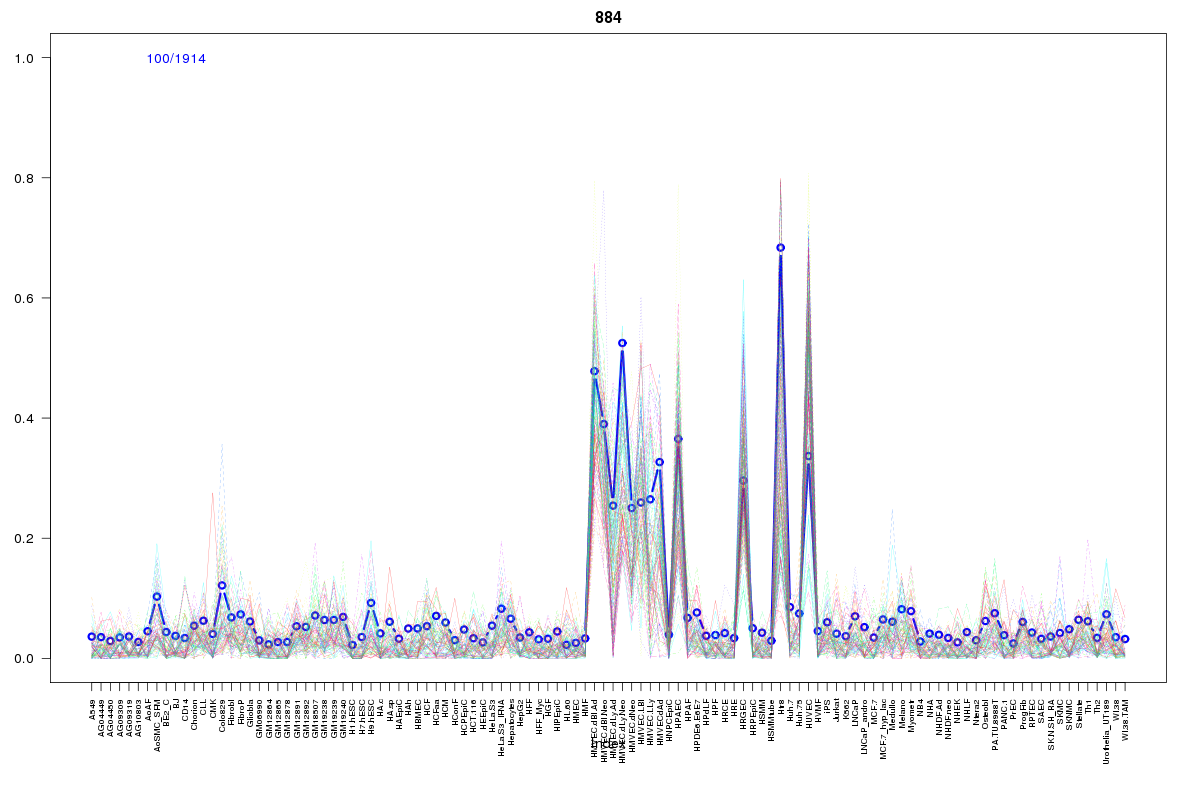 | 884 | 1 |
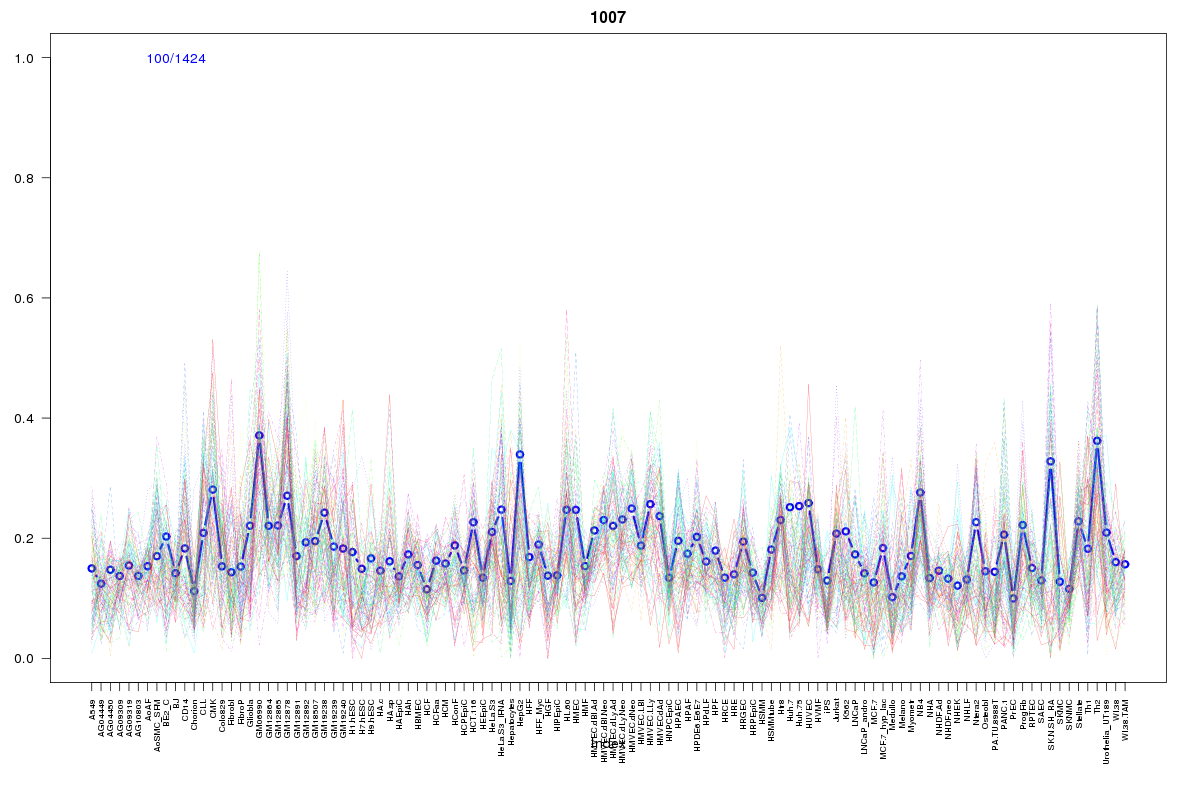 | 1007 | 1 |
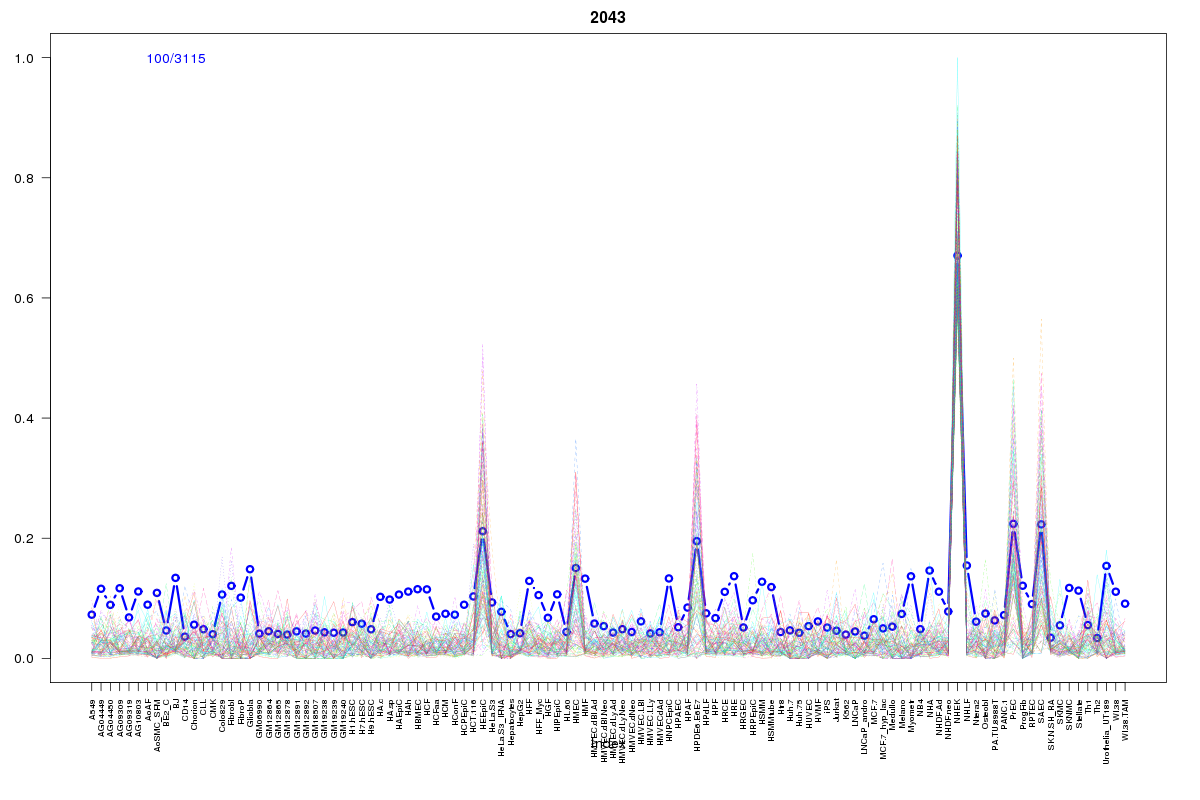 | 2043 | 1 |
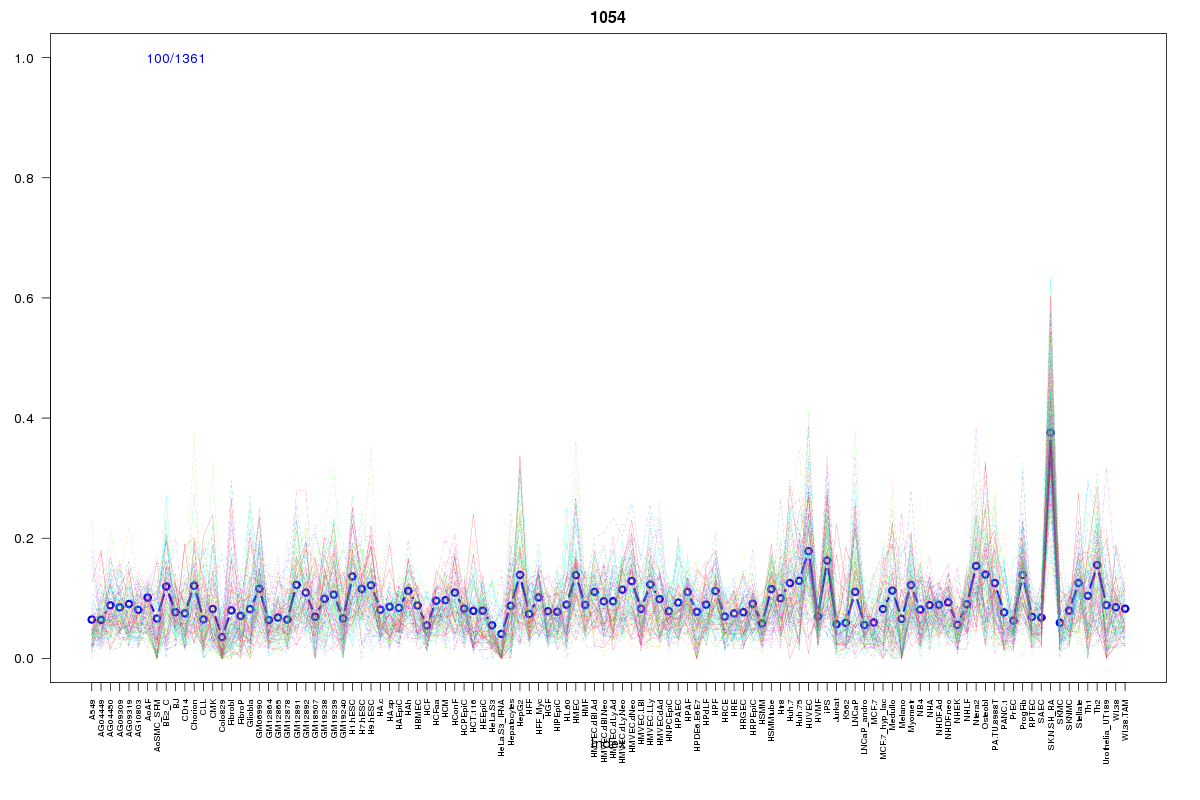 | 1054 | 1 |
 | 2394 | 1 |
 | 1127 | 1 |
Resources
BED file downloads
Connects to 17 DHS sitesTop 10 Correlated DHS Sites
p-values indiciate significant higher or lower correlation| Location | Cluster | P-value |
|---|---|---|
| chr1:1176325-1176475 | 1072 | 0 |
| chr1:1139605-1139755 | 2279 | 0.002 |
| chr1:1266520-1266670 | 2182 | 0.002 |
| chr1:1240600-1240750 | 2122 | 0.002 |
| chr1:1280240-1280390 | 2394 | 0.006 |
| chr1:1238780-1238930 | 2043 | 0.006 |
| chr1:1217225-1217375 | 2484 | 0.006 |
| chr1:1265985-1266135 | 1054 | 0.007 |
| chr1:1283045-1283195 | 2182 | 0.007 |
| chr1:1172605-1172755 | 2484 | 0.009 |
| chr1:1307805-1307955 | 2122 | 0.022 |
External Databases
UCSCEnsembl (ENSG00000131584)