Gene: MATN1
chr1: 31184123-31196434Expression Profile
(log scale)
Graphical Connections
Distribution of linked clusters:
You may find it interesting if many of the connected DHS sites belong to the same cluster.| Cluster Profile | Cluster ID | Number of DHS sites in this cluster |
|---|---|---|
 | 615 | 8 |
 | 2055 | 3 |
 | 1963 | 2 |
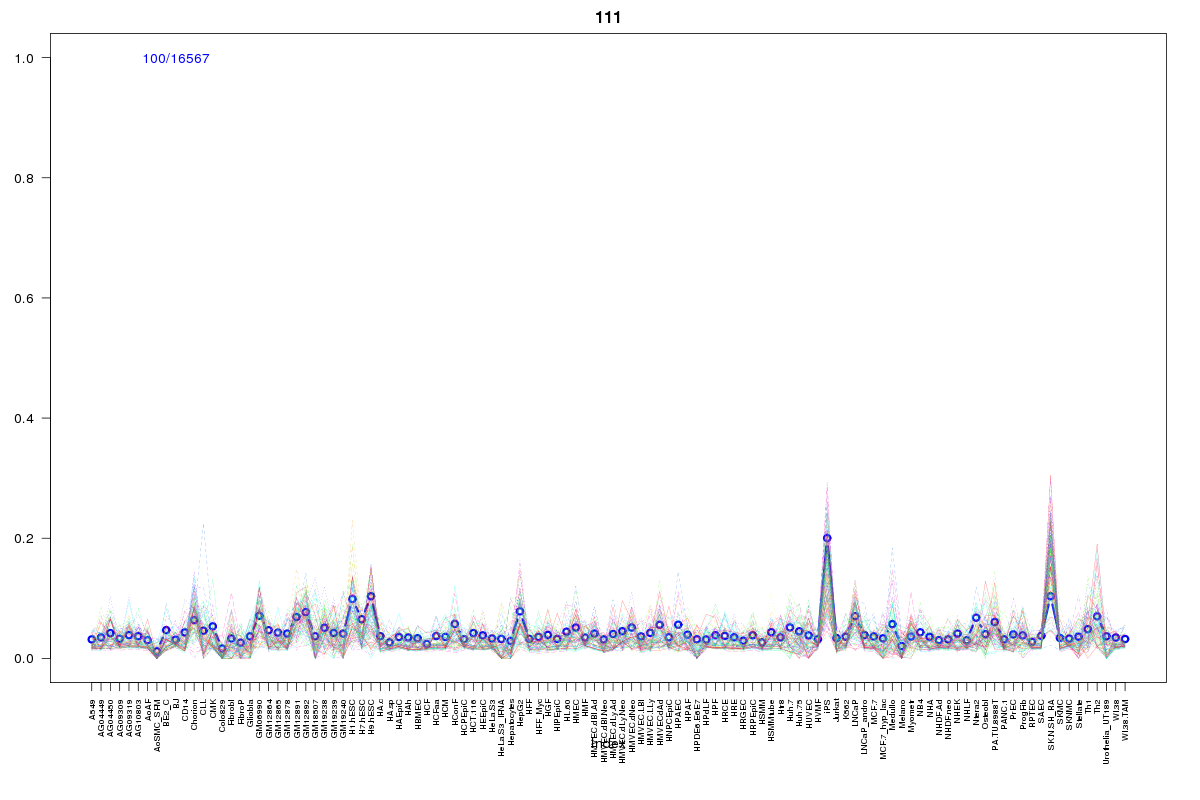 | 111 | 2 |
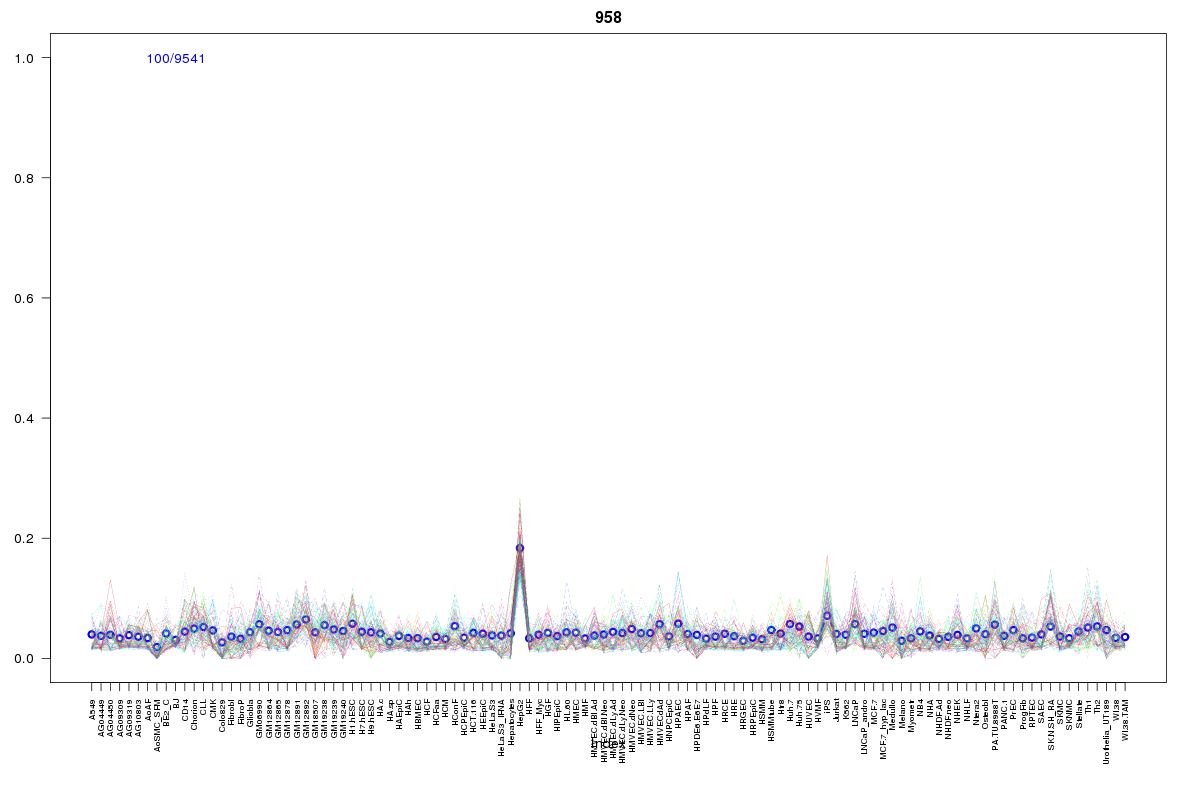 | 958 | 2 |
 | 1079 | 2 |
 | 2052 | 2 |
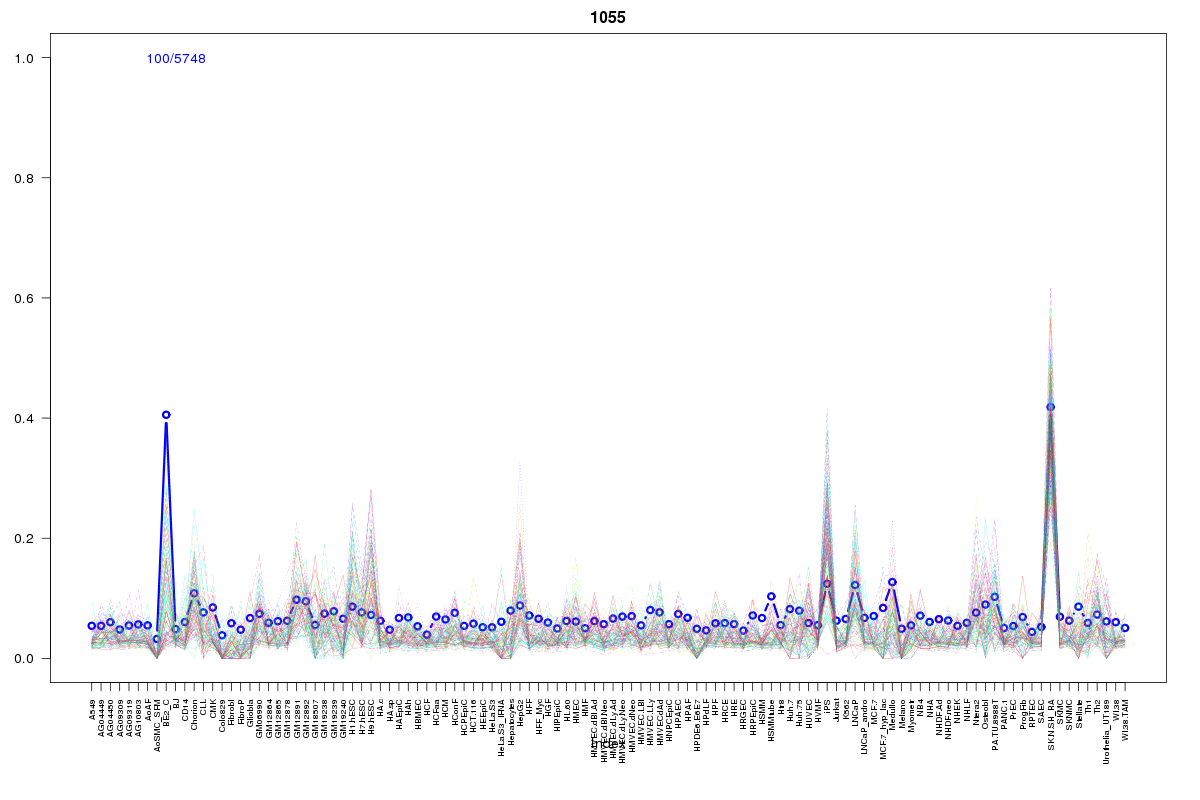 | 1055 | 1 |
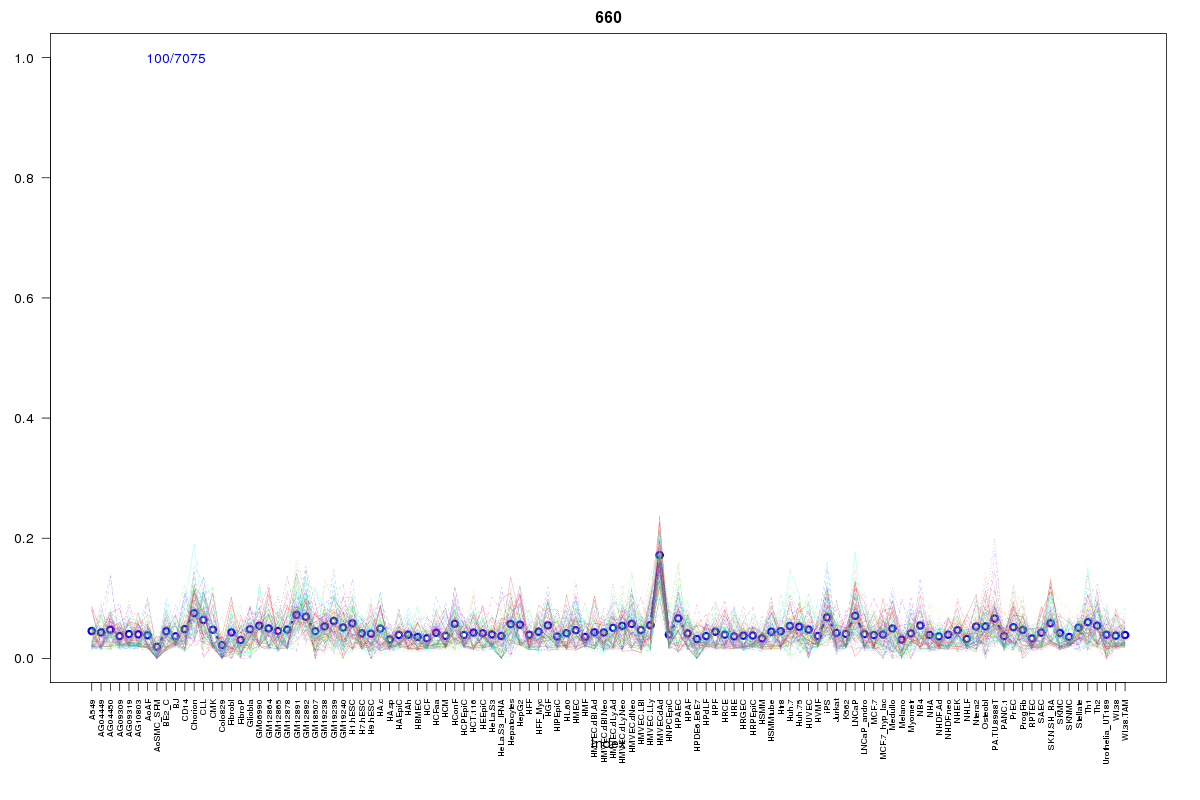 | 660 | 1 |
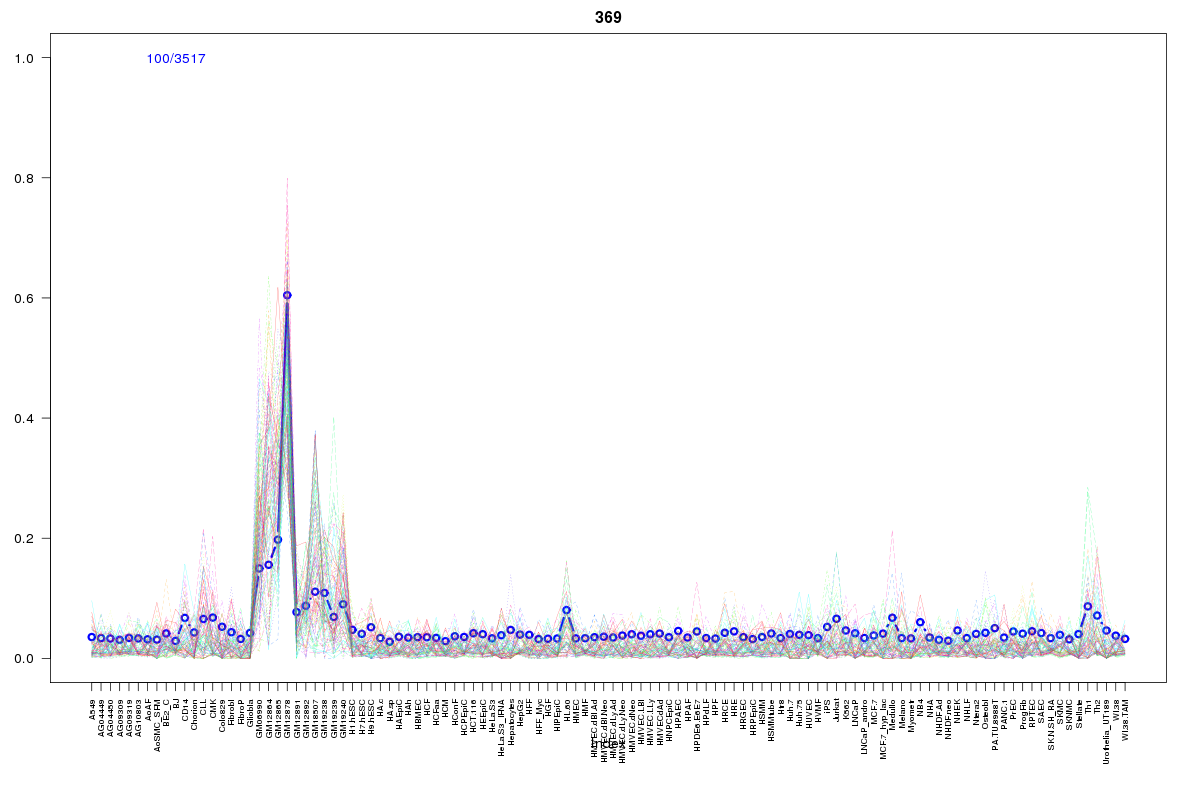 | 369 | 1 |
 | 569 | 1 |
 | 570 | 1 |
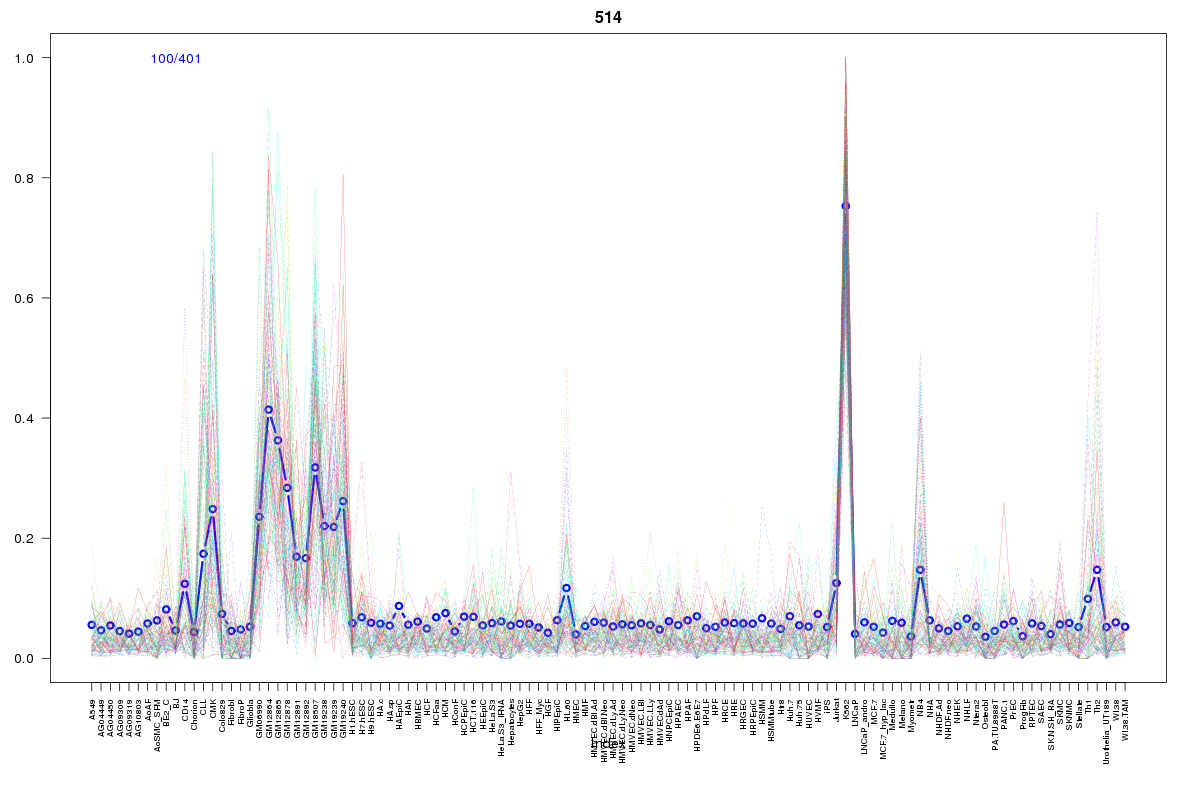 | 514 | 1 |
 | 527 | 1 |
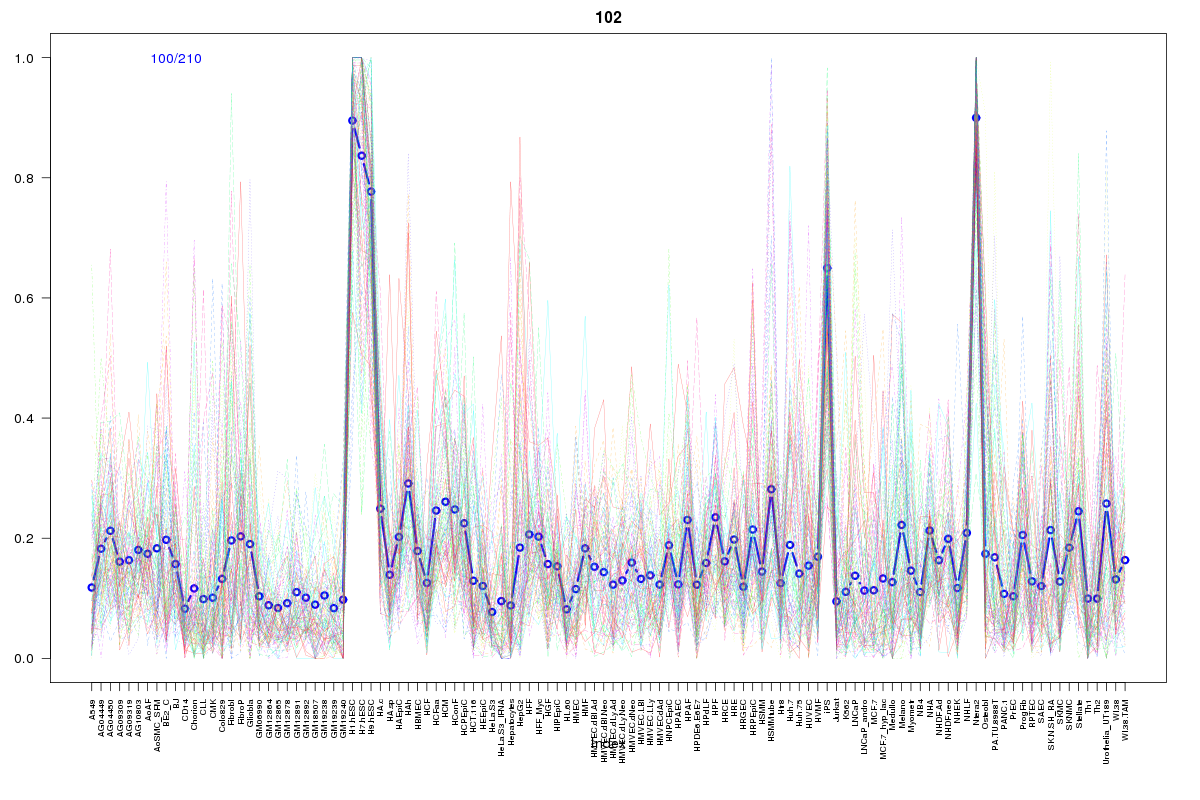 | 102 | 1 |
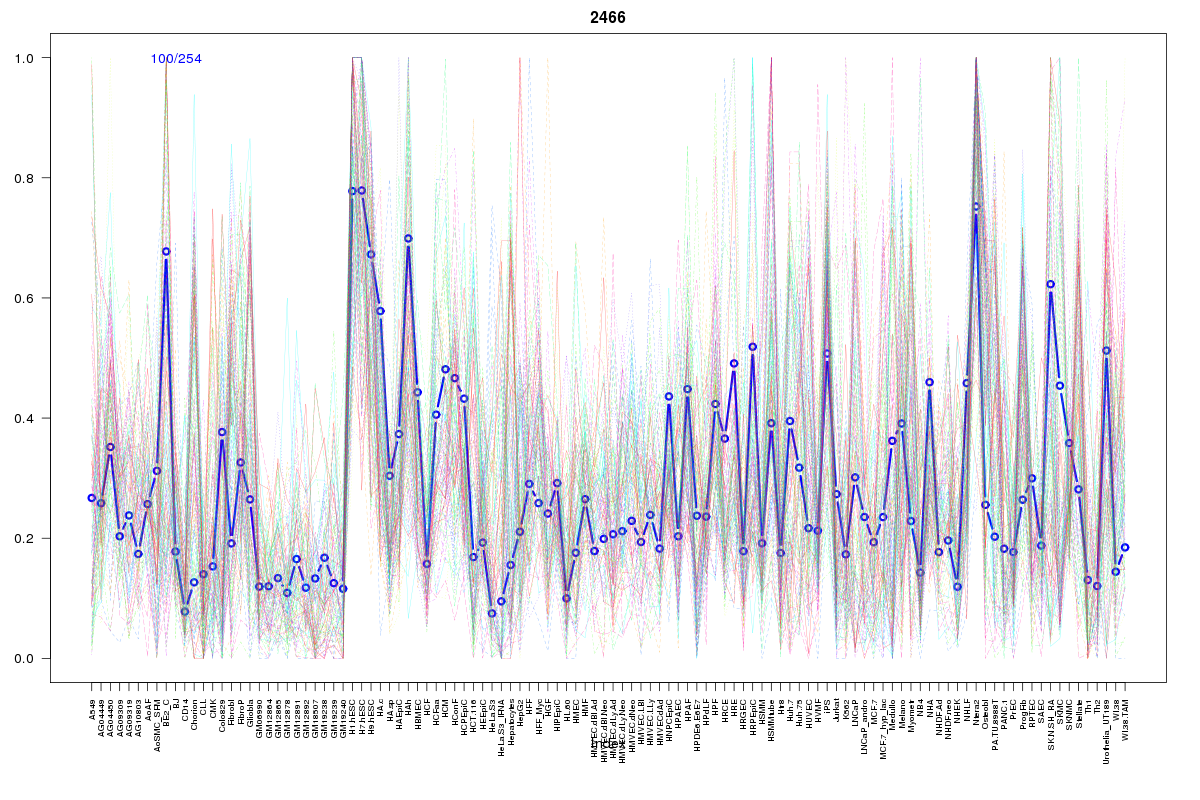 | 2466 | 1 |
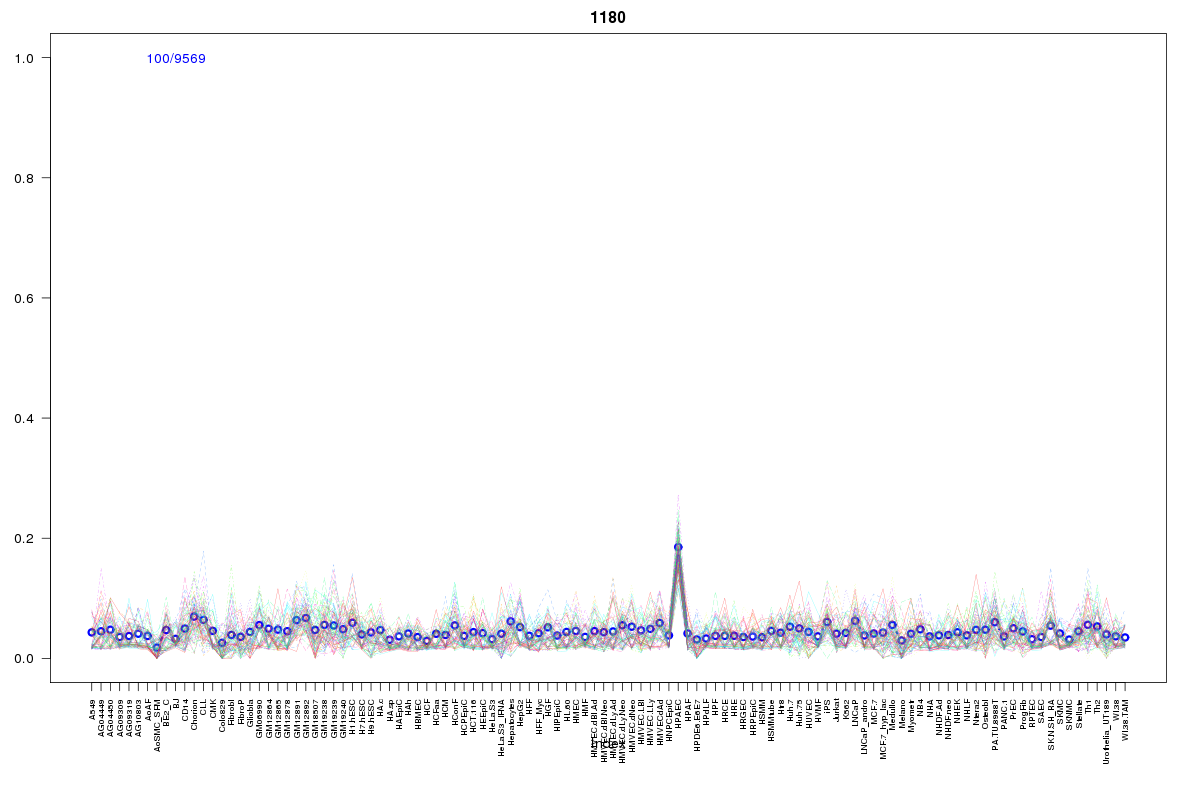 | 1180 | 1 |
Resources
BED file downloads
Connects to 31 DHS sitesTop 10 Correlated DHS Sites
p-values indiciate significant higher or lower correlation| Location | Cluster | P-value |
|---|---|---|
| chr1:31106500-31106650 | 2055 | 0.001 |
| chr1:31204740-31204890 | 1963 | 0.001 |
| chr1:31132720-31132870 | 615 | 0.008 |
| chr1:31193040-31193190 | 660 | 0.01 |
| chr1:31241040-31241190 | 615 | 0.013 |
| chr1:31234400-31234550 | 514 | 0.013 |
| chr1:31204140-31204290 | 615 | 0.013 |
| chr1:31202240-31202390 | 369 | 0.013 |
| chr1:31250440-31250590 | 1963 | 0.013 |
| chr1:31157285-31157435 | 958 | 0.013 |
| chr1:31162165-31162315 | 1079 | 0.013 |
External Databases
UCSCEnsembl (ENSG00000162510)