Gene: BPIFA1
chr20: 31823800-31831115Expression Profile
(log scale)
Graphical Connections
Distribution of linked clusters:
You may find it interesting if many of the connected DHS sites belong to the same cluster.| Cluster Profile | Cluster ID | Number of DHS sites in this cluster |
|---|---|---|
 | 2055 | 2 |
 | 860 | 2 |
 | 2326 | 1 |
 | 1755 | 1 |
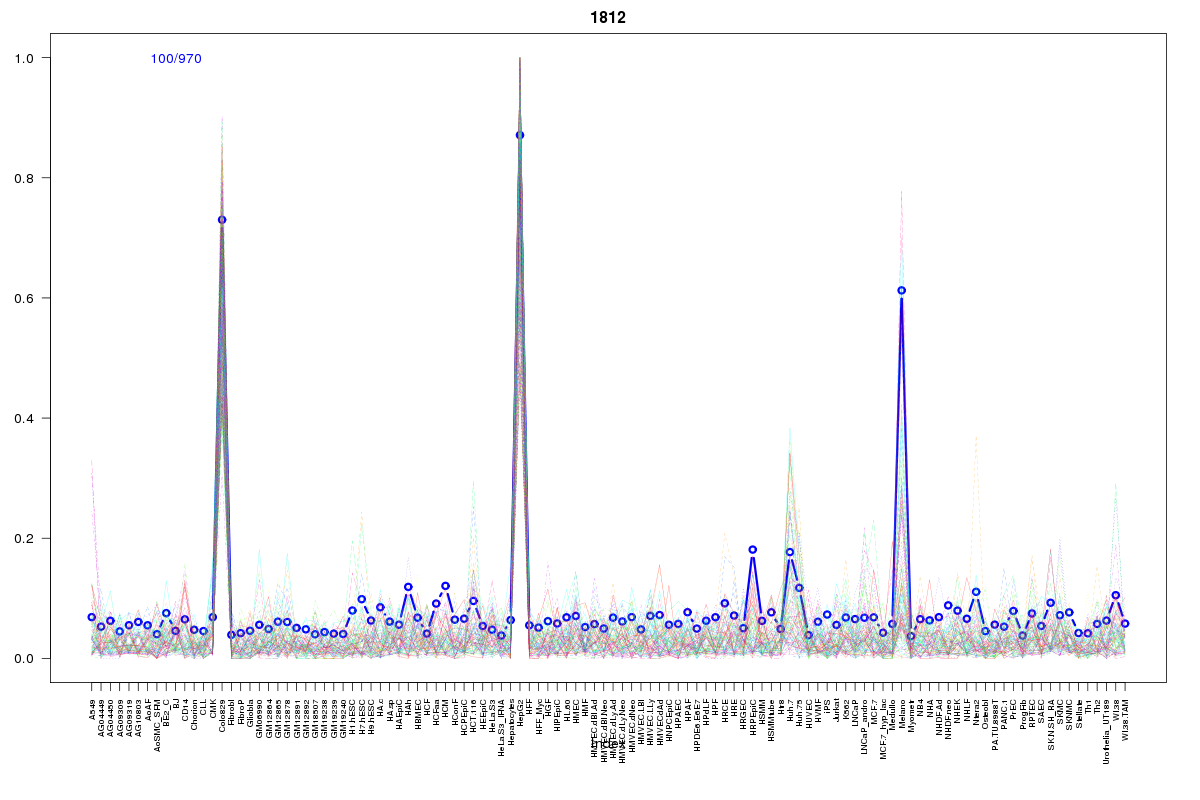 | 1812 | 1 |
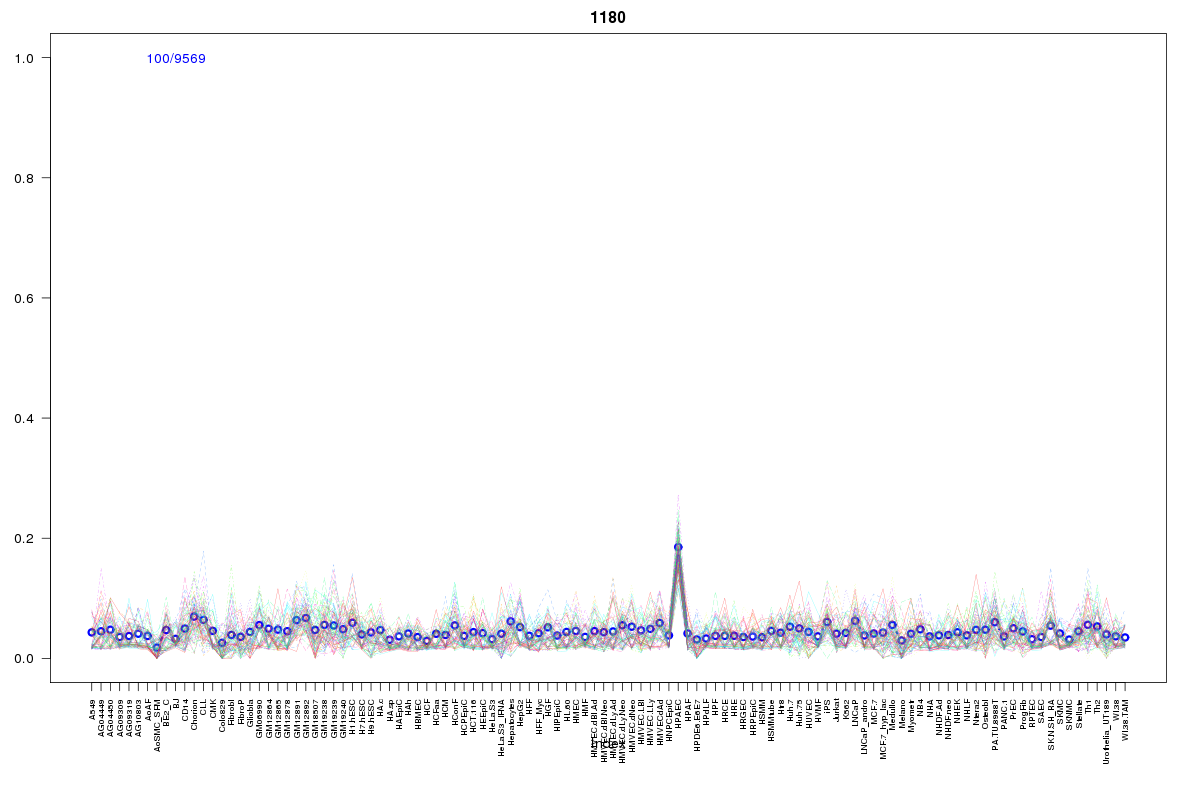 | 1180 | 1 |
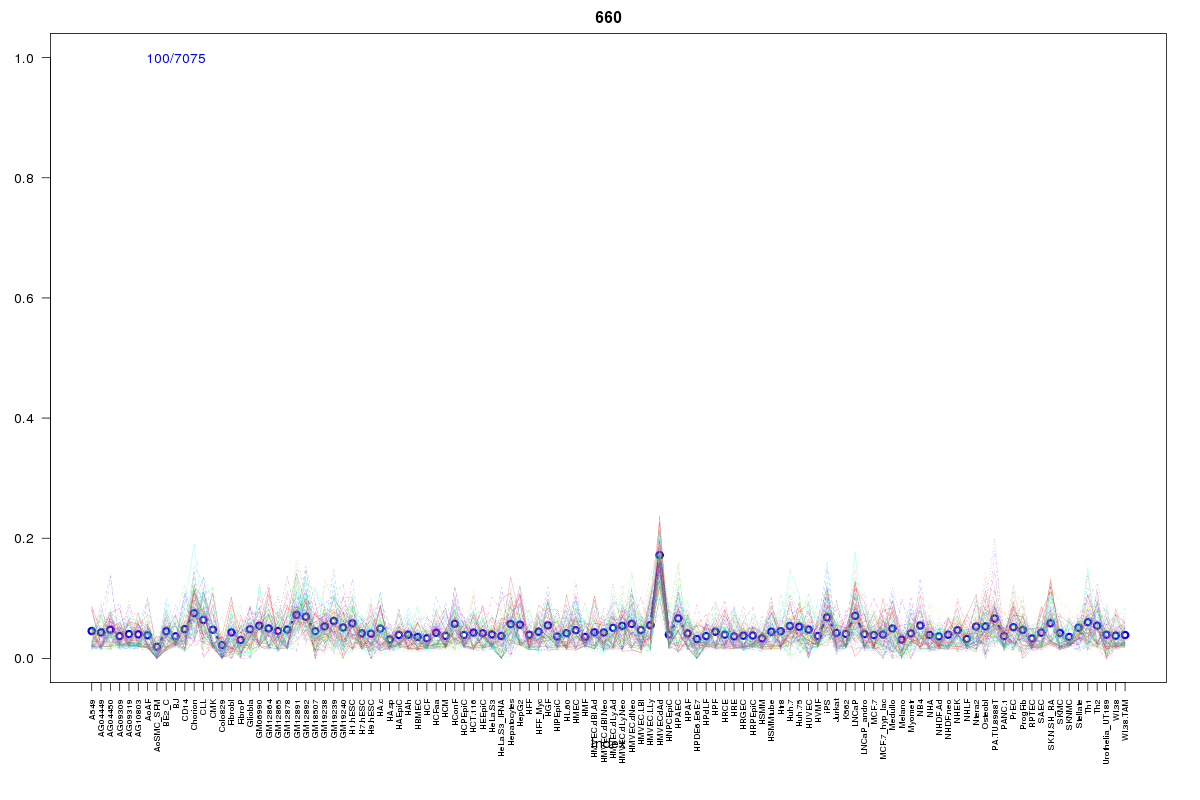 | 660 | 1 |
 | 1572 | 1 |
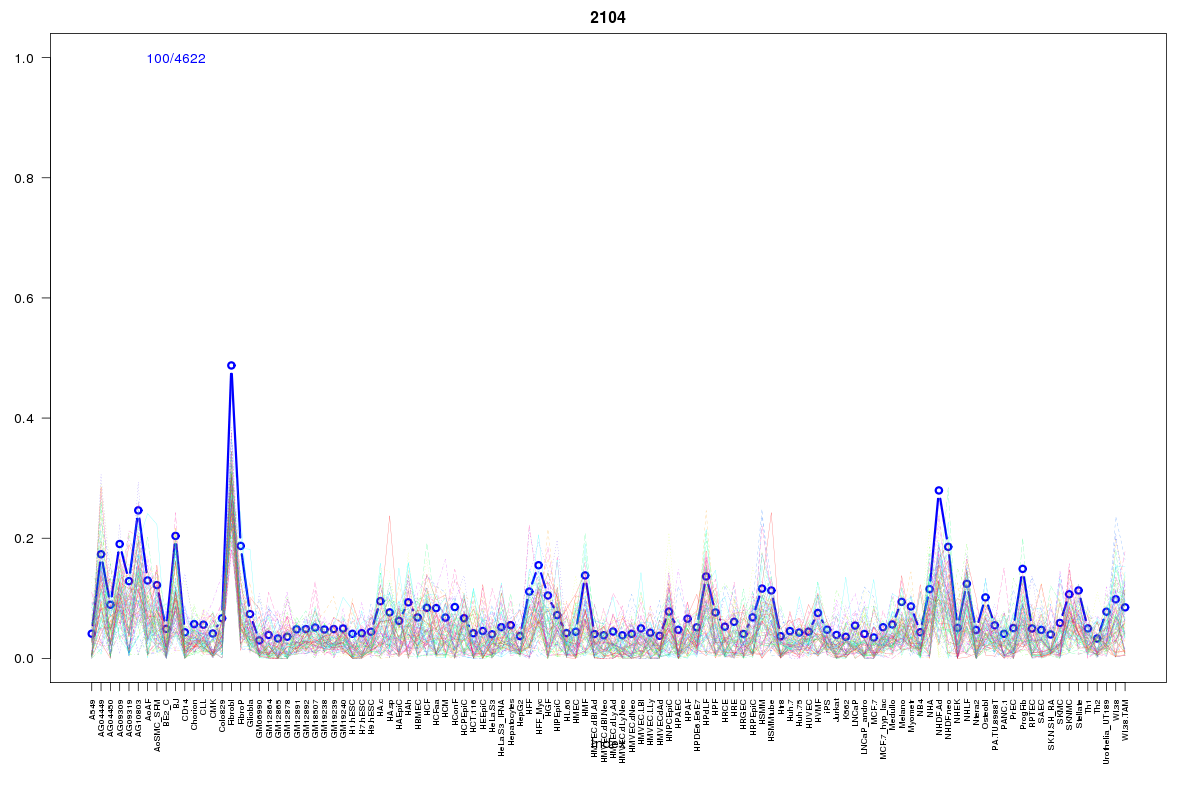 | 2104 | 1 |
 | 2175 | 1 |
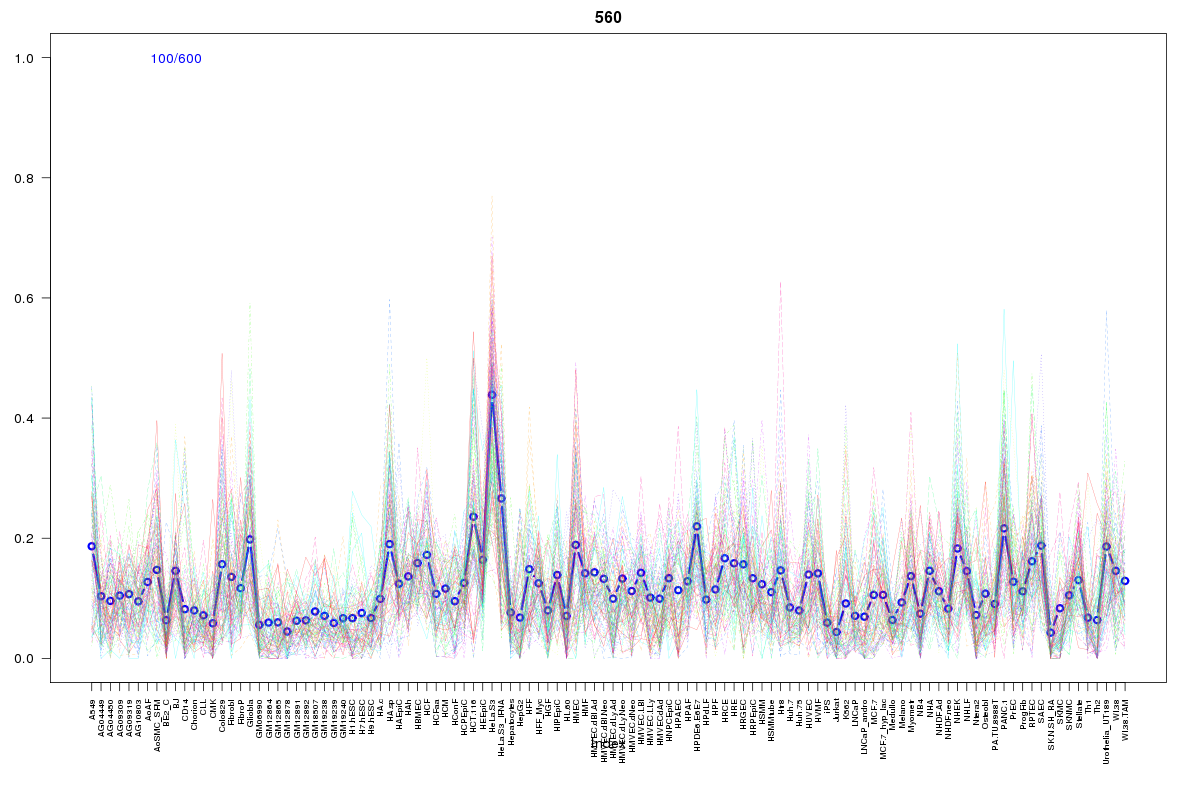 | 560 | 1 |
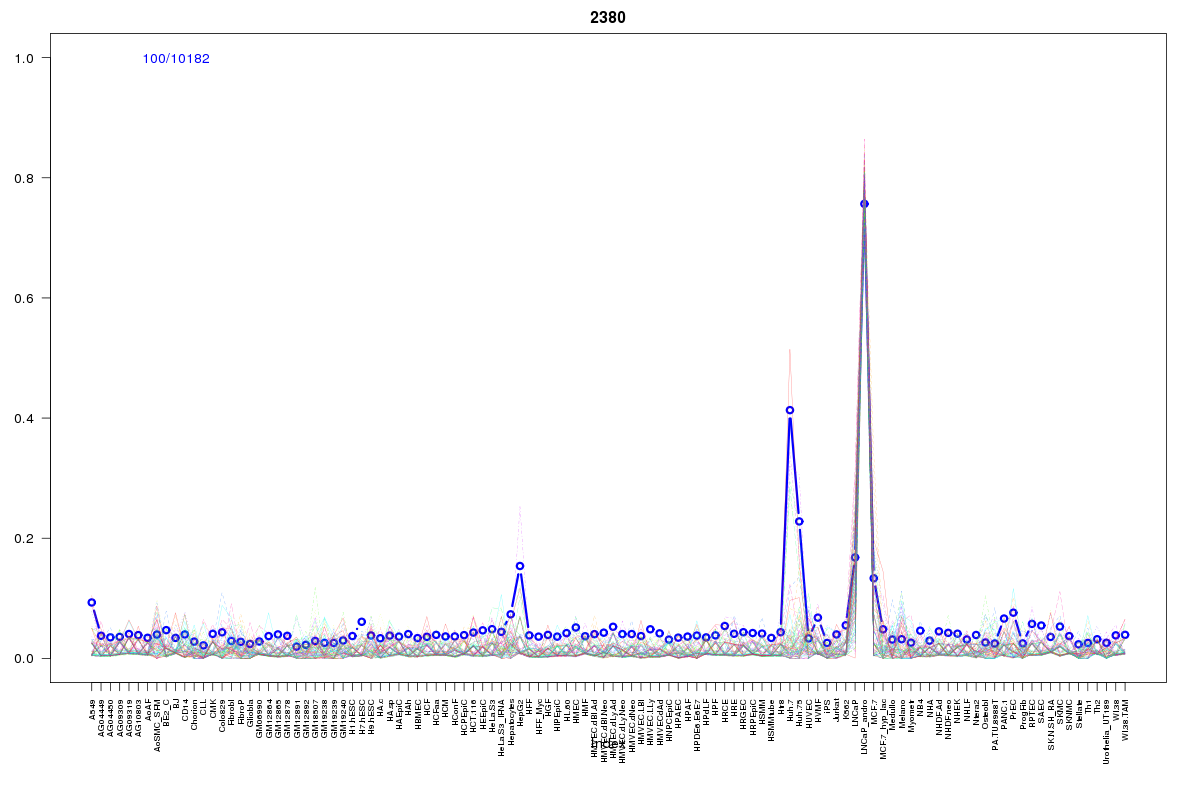 | 2380 | 1 |
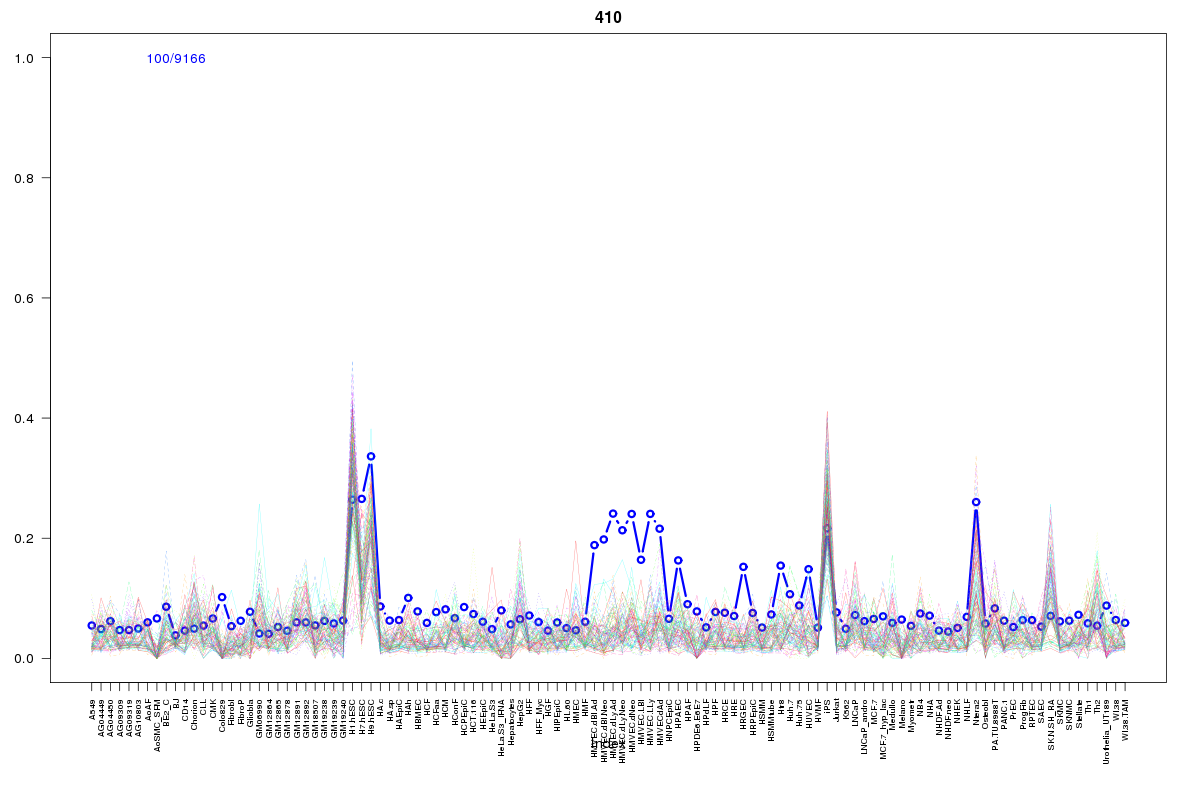 | 410 | 1 |
 | 2186 | 1 |
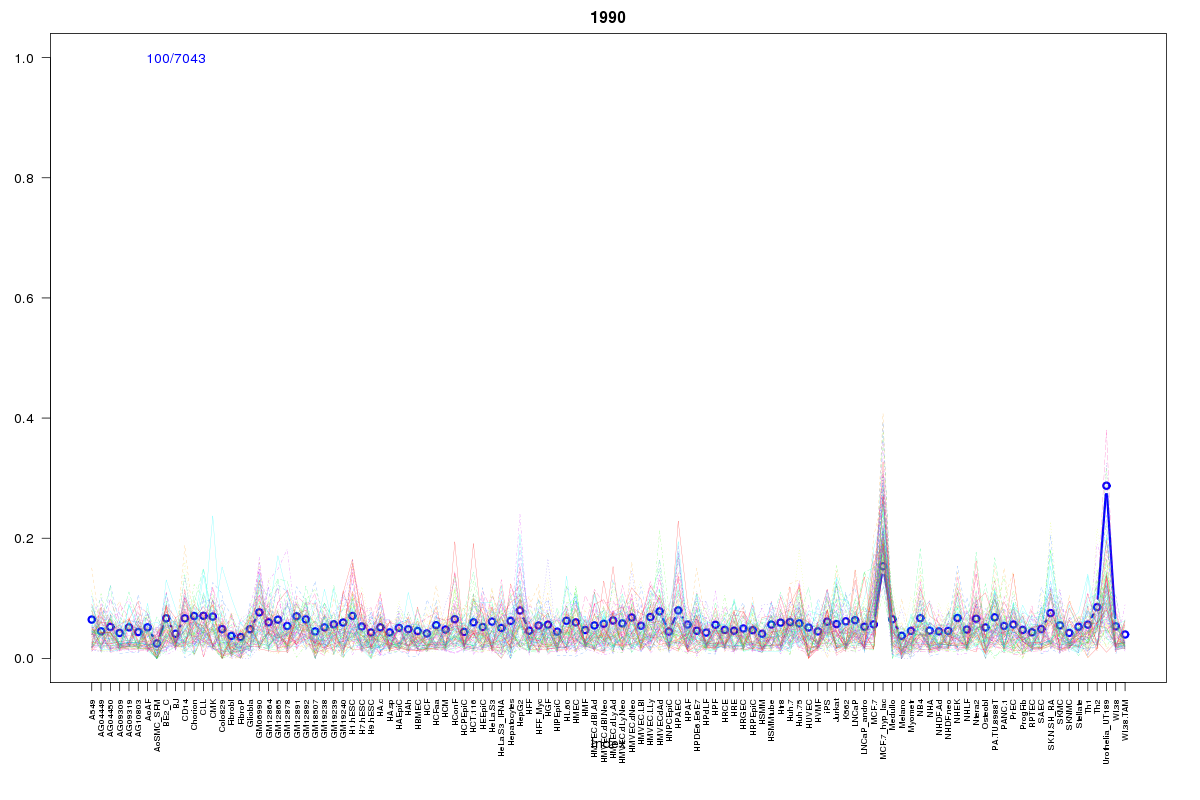 | 1990 | 1 |
 | 1230 | 1 |
 | 934 | 1 |
 | 510 | 1 |
Resources
BED file downloads
Connects to 20 DHS sitesTop 10 Correlated DHS Sites
p-values indiciate significant higher or lower correlation| Location | Cluster | P-value |
|---|---|---|
| chr20:31768945-31769095 | 1230 | 0 |
| chr20:31738760-31738910 | 2380 | 0.002 |
| chr20:31739005-31739155 | 2186 | 0.002 |
| chr20:31905425-31905575 | 860 | 0.009 |
| chr20:31876560-31876710 | 1180 | 0.009 |
| chr20:31877825-31877975 | 660 | 0.013 |
| chr20:31839420-31839570 | 2326 | 0.013 |
| chr20:31874165-31874315 | 2055 | 0.015 |
| chr20:31833945-31834095 | 510 | 0.017 |
| chr20:31823485-31823635 | 860 | 0.017 |
| chr20:31863425-31863575 | 2055 | 0.019 |
External Databases
UCSCEnsembl (ENSG00000198183)