Gene: PTCD2P1
chr14: 20992445-20993581Expression Profile
(log scale)
Graphical Connections
Distribution of linked clusters:
You may find it interesting if many of the connected DHS sites belong to the same cluster.| Cluster Profile | Cluster ID | Number of DHS sites in this cluster |
|---|---|---|
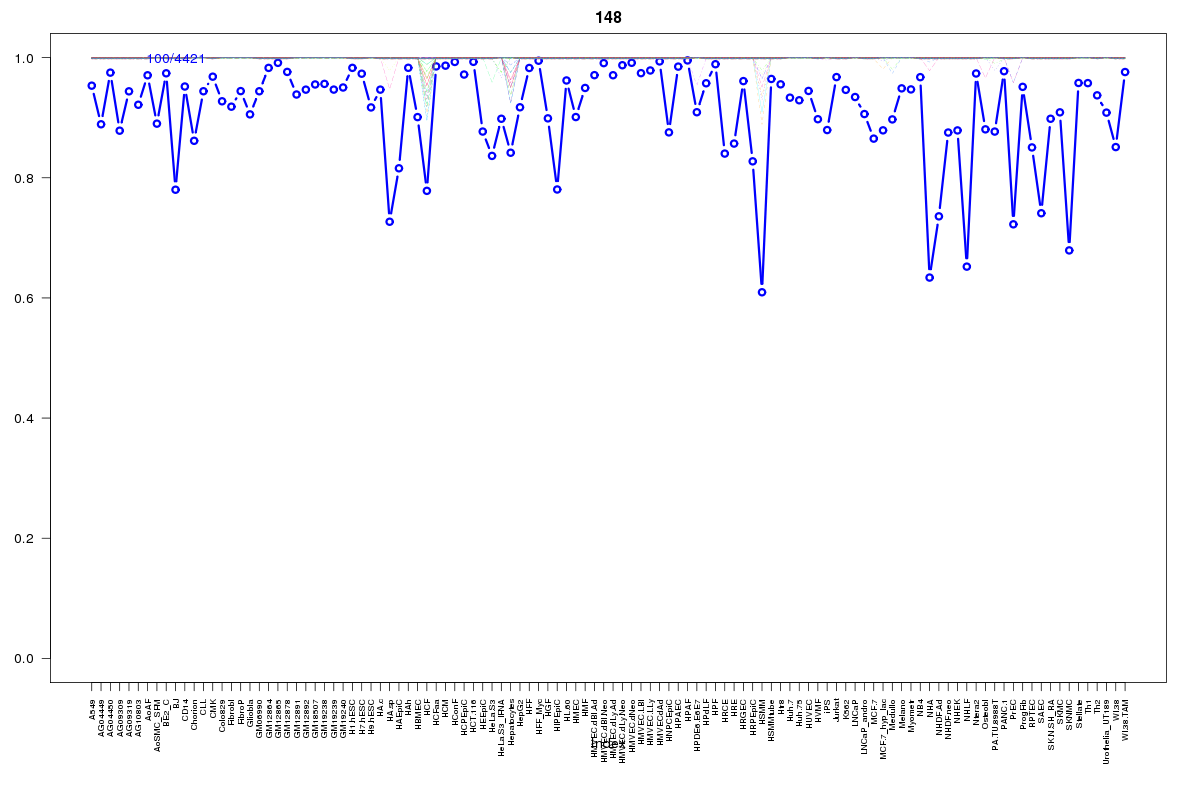 | 148 | 2 |
 | 569 | 2 |
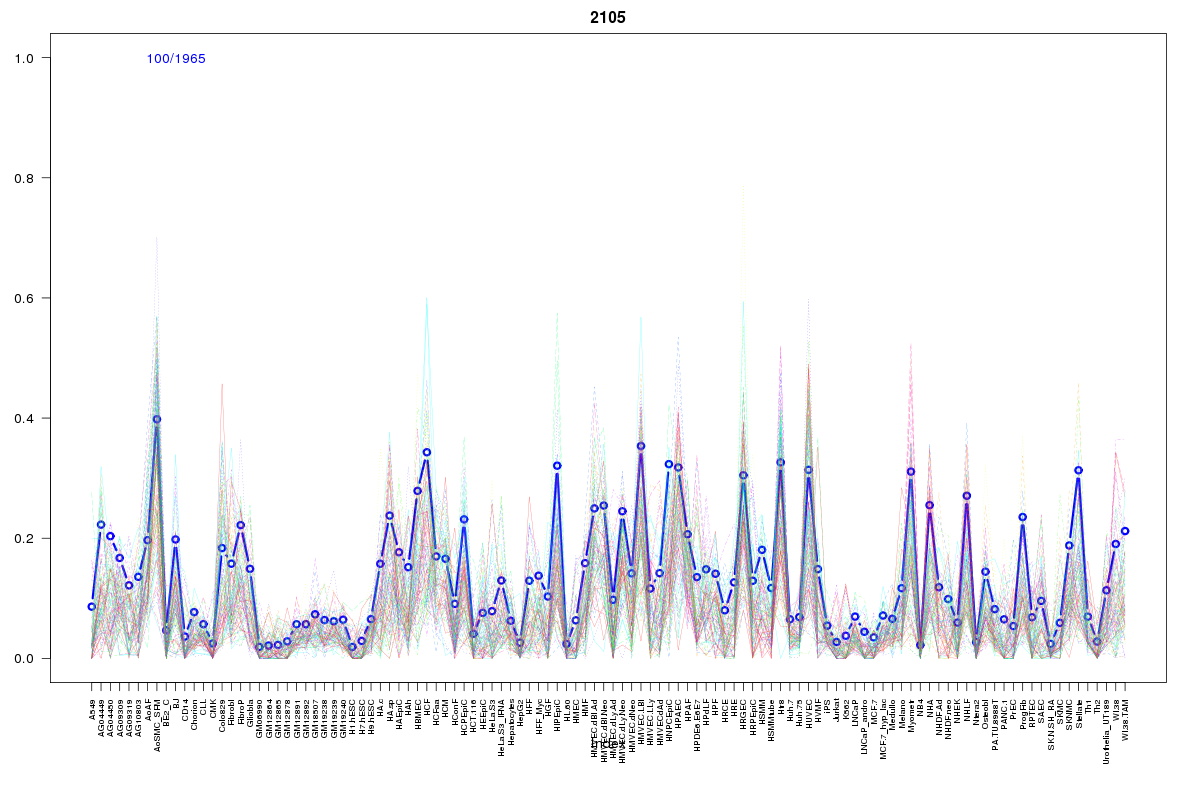 | 2105 | 2 |
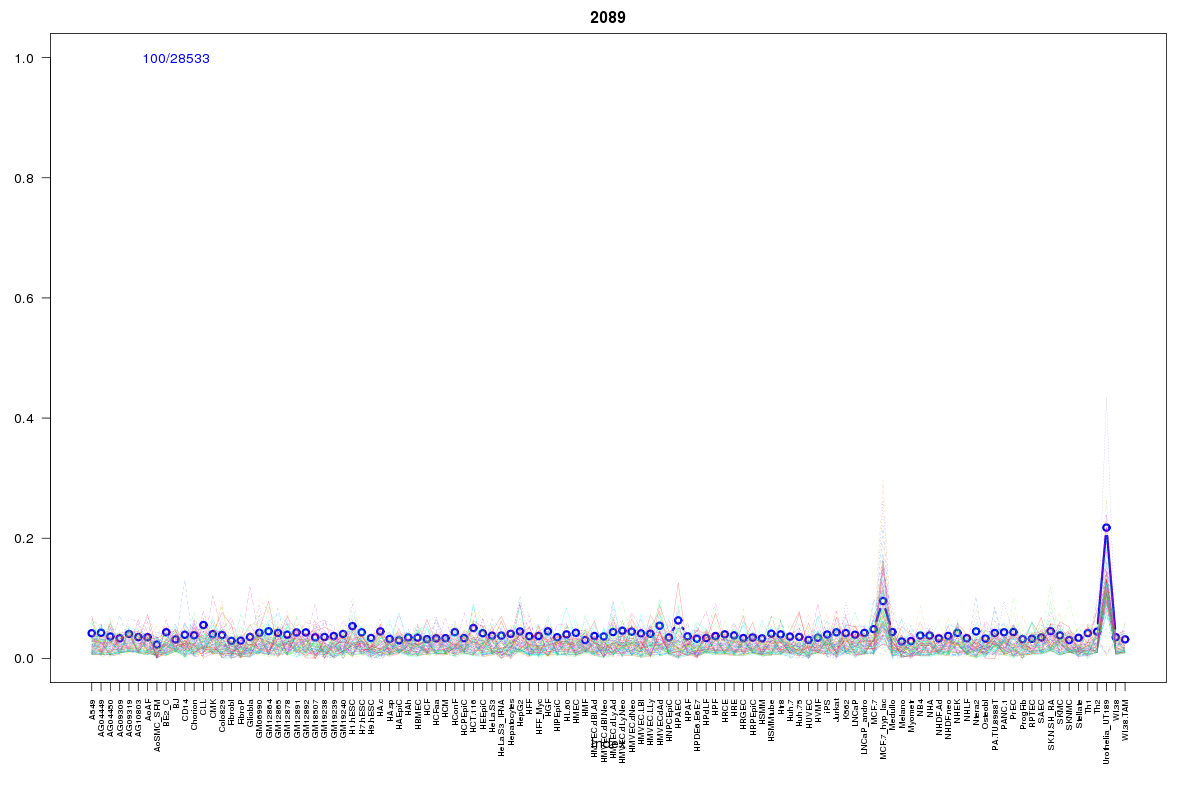 | 2089 | 1 |
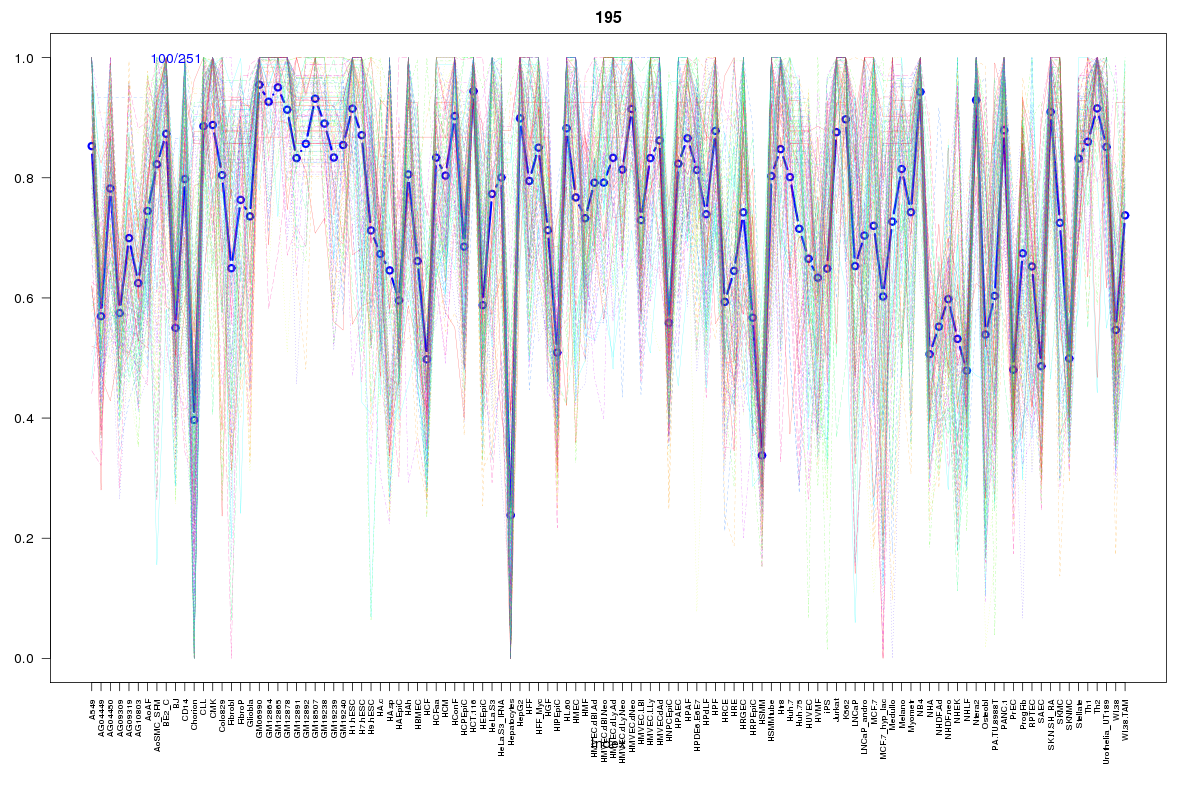 | 195 | 1 |
 | 248 | 1 |
 | 629 | 1 |
 | 2211 | 1 |
 | 979 | 1 |
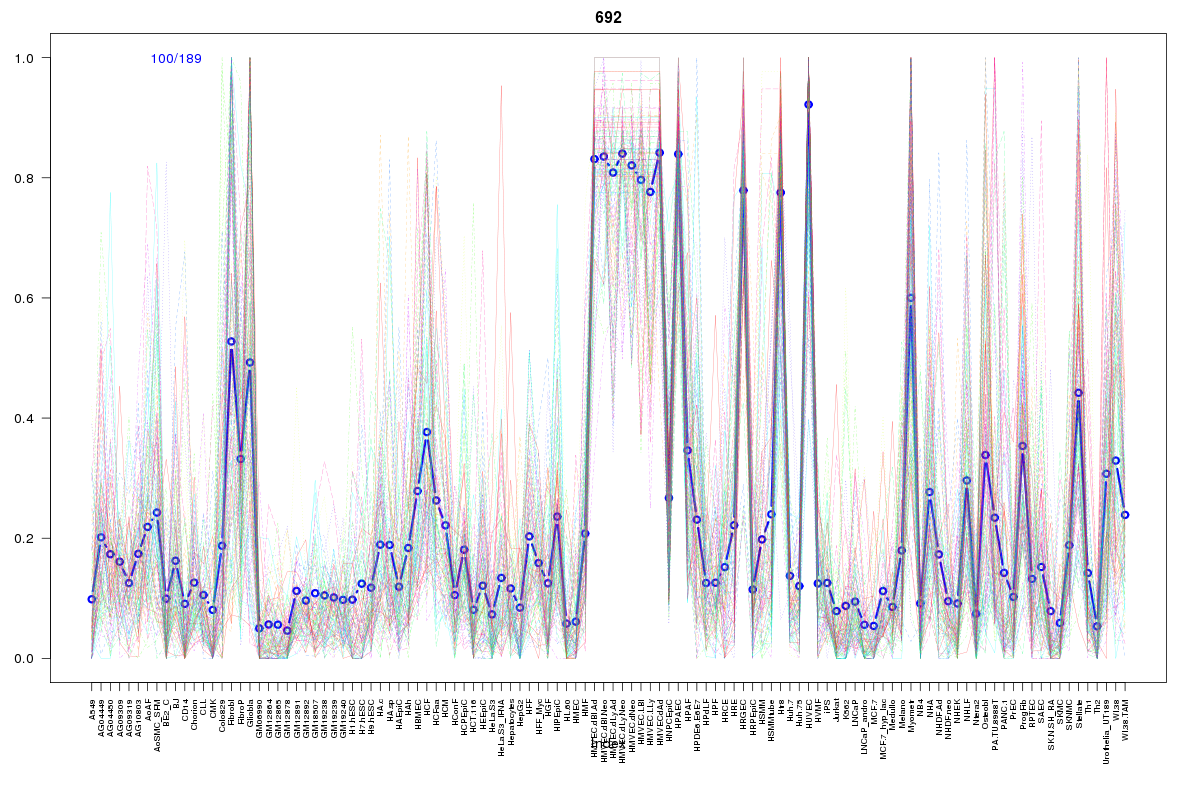 | 692 | 1 |
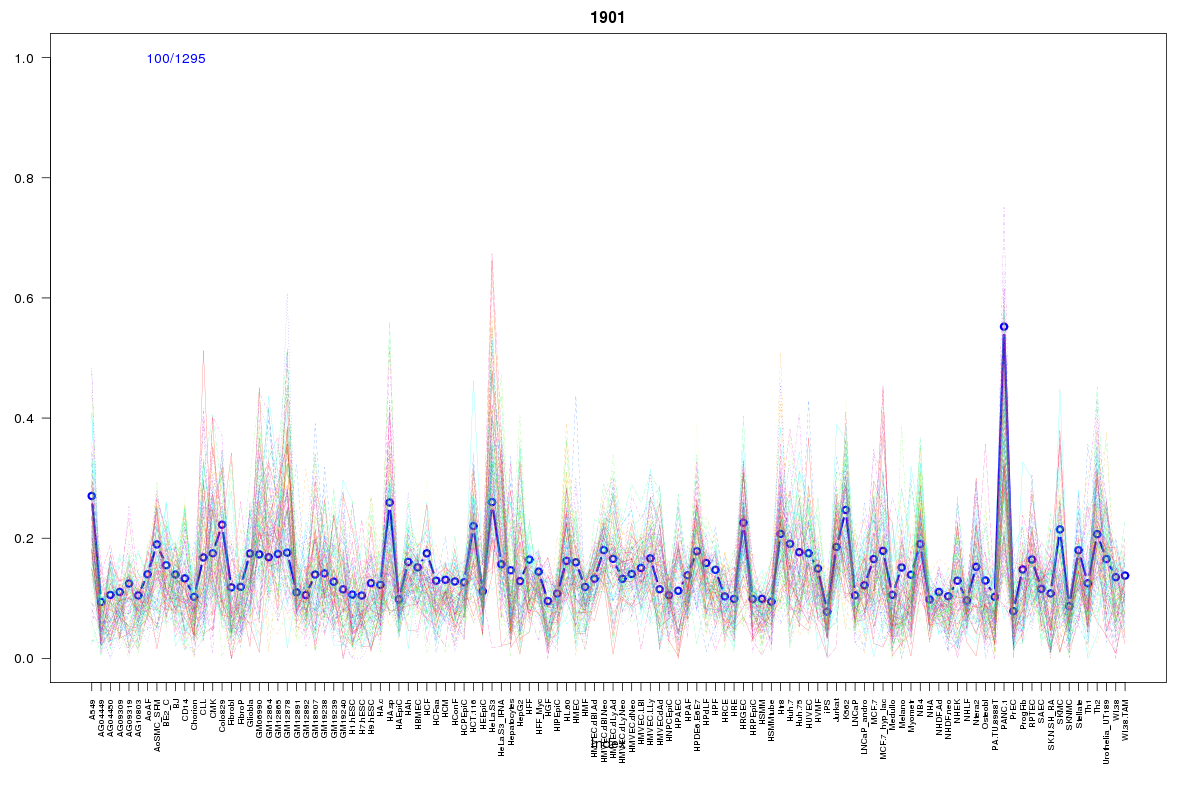 | 1901 | 1 |
 | 2062 | 1 |
 | 1078 | 1 |
Resources
BED file downloads
Connects to 16 DHS sitesTop 10 Correlated DHS Sites
p-values indiciate significant higher or lower correlation| Location | Cluster | P-value |
|---|---|---|
| chr14:20905225-20905375 | 2089 | 0.004 |
| chr14:20923920-20924070 | 629 | 0.004 |
| chr14:20942540-20942690 | 569 | 0.01 |
| chr14:20955640-20955790 | 2211 | 0.01 |
| chr14:20942940-20943090 | 569 | 0.013 |
| chr14:21093145-21093295 | 1901 | 0.013 |
| chr14:20980540-20980690 | 2105 | 0.024 |
| chr14:20923220-20923370 | 148 | 0.015 |
| chr14:20985160-20985310 | 692 | 0.014 |
| chr14:20898145-20898295 | 1078 | 0.011 |
| chr14:20937480-20937630 | 148 | 0.01 |
External Databases
UCSCEnsembl (ENSG00000258456)