Gene: MTMR9
chr8: 11141924-11185646Expression Profile
(log scale)
Graphical Connections
Distribution of linked clusters:
You may find it interesting if many of the connected DHS sites belong to the same cluster.| Cluster Profile | Cluster ID | Number of DHS sites in this cluster |
|---|---|---|
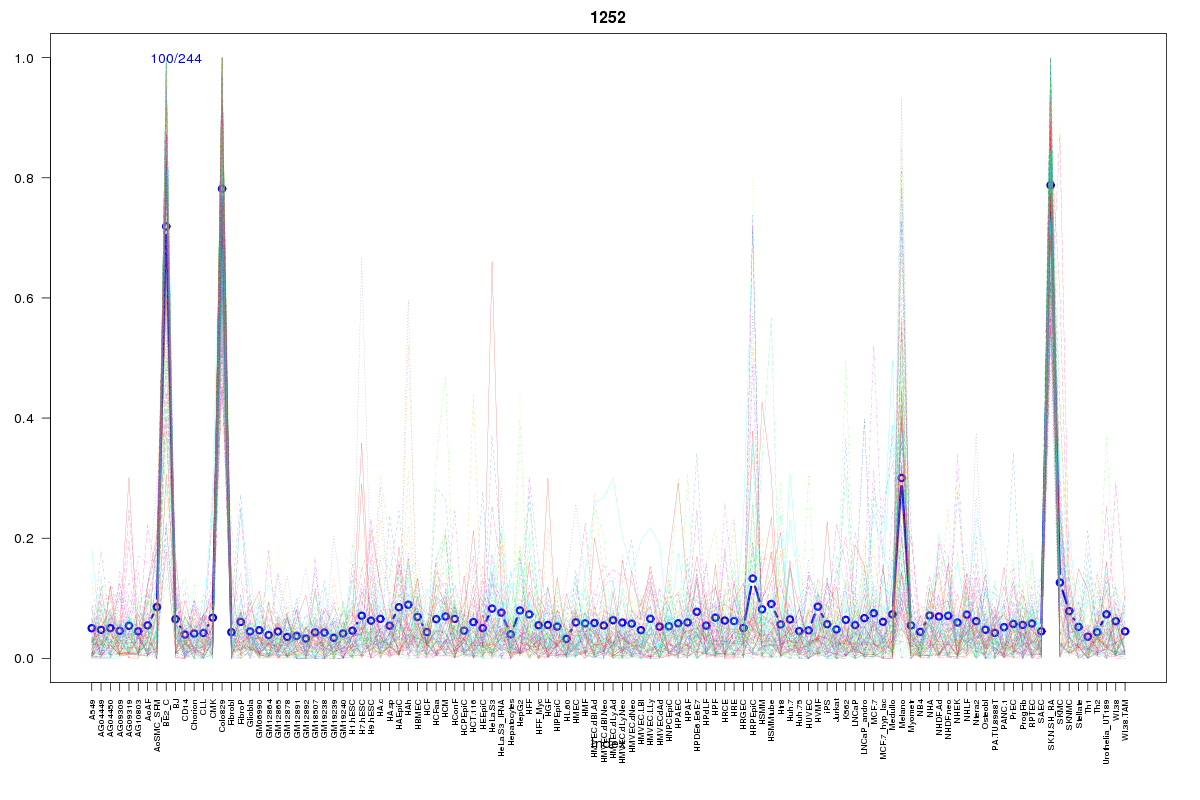 | 1252 | 2 |
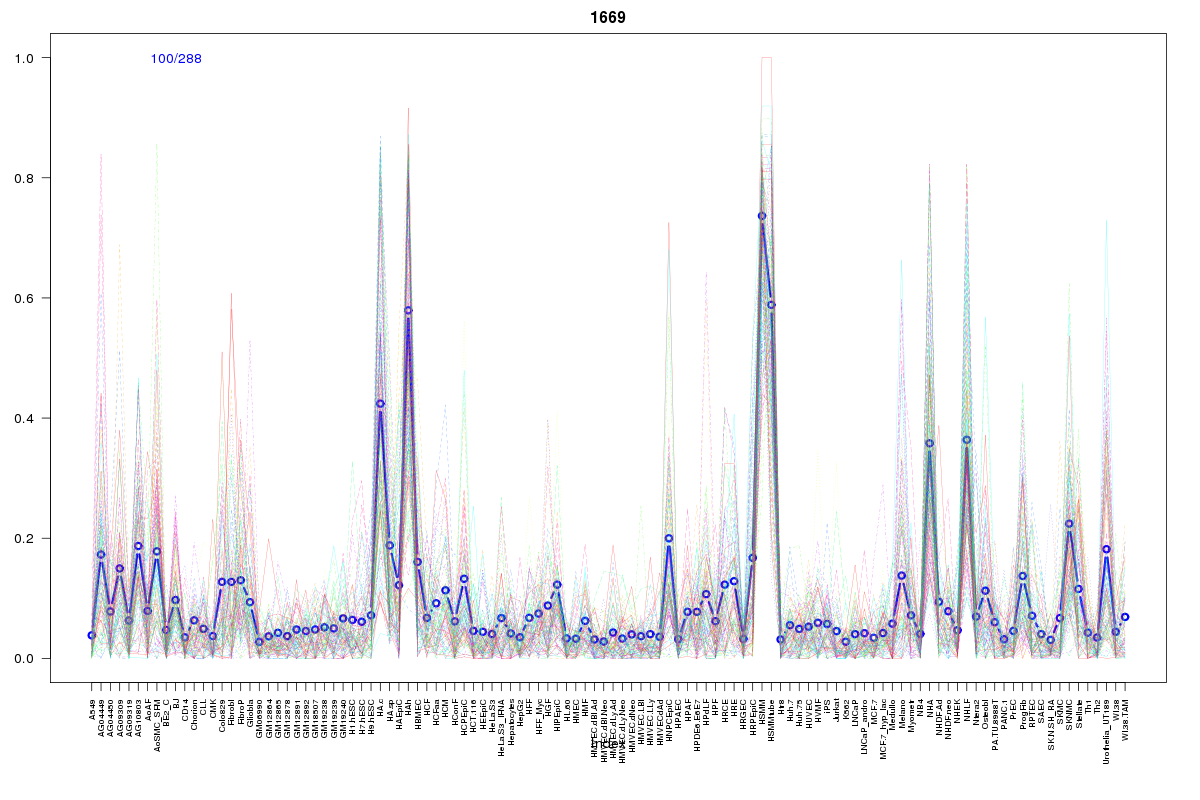 | 1669 | 1 |
 | 568 | 1 |
 | 2186 | 1 |
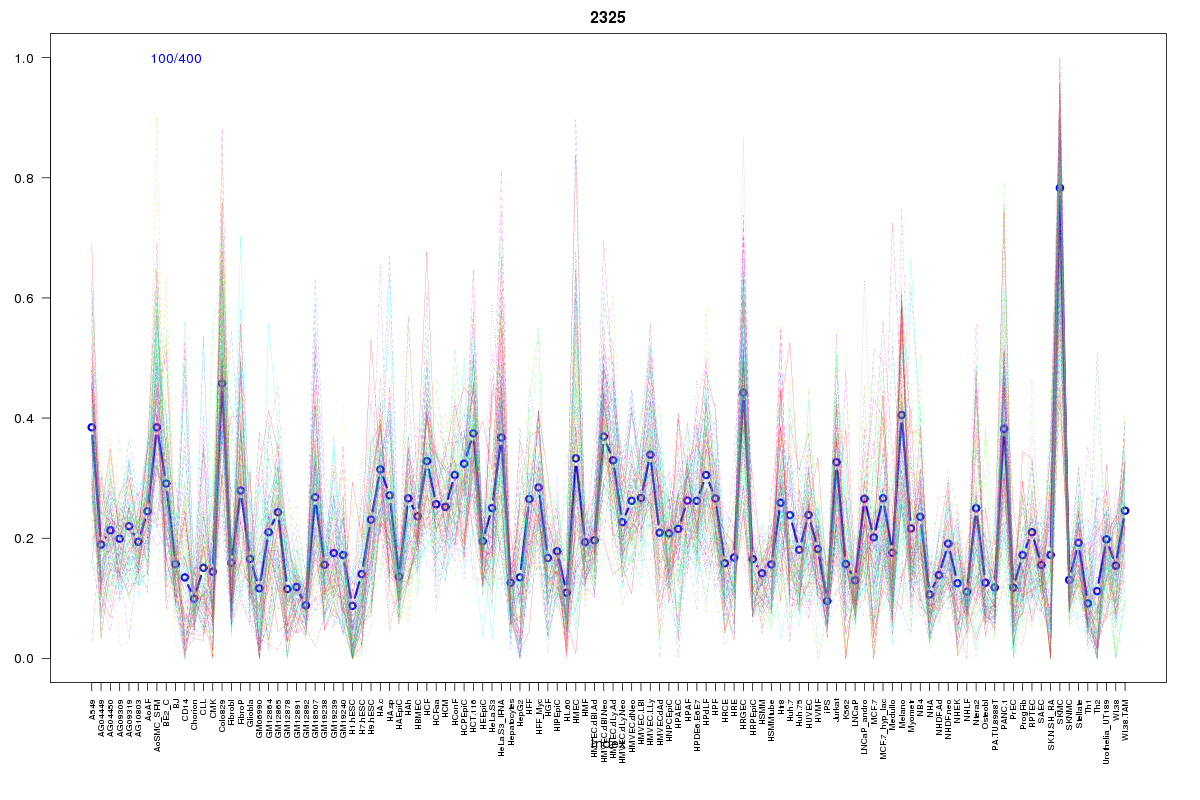 | 2325 | 1 |
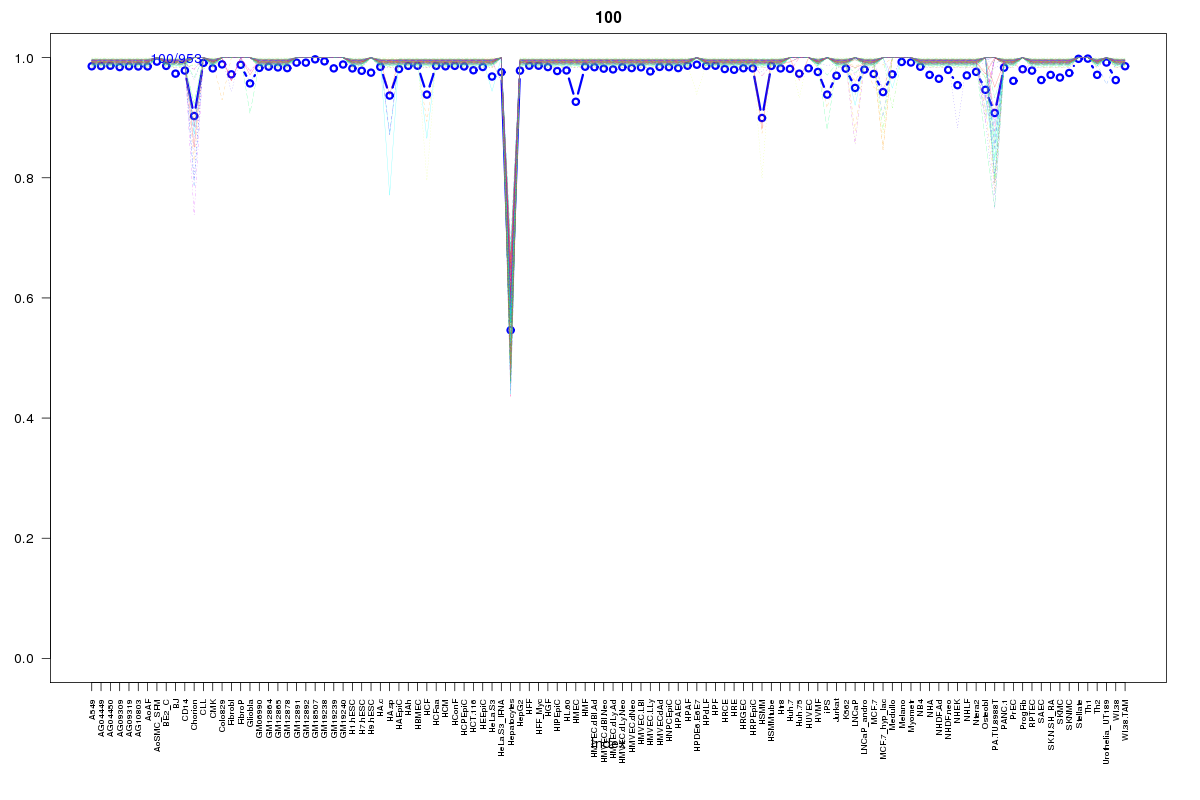 | 100 | 1 |
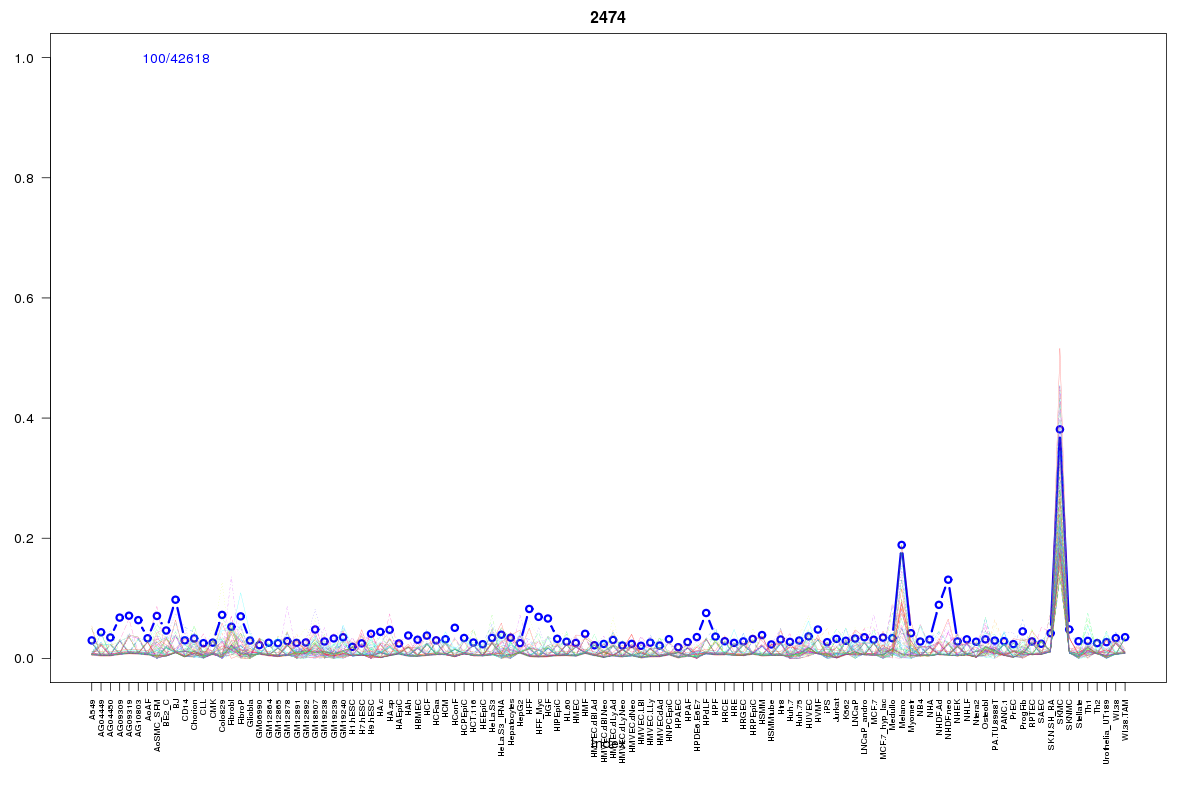 | 2474 | 1 |
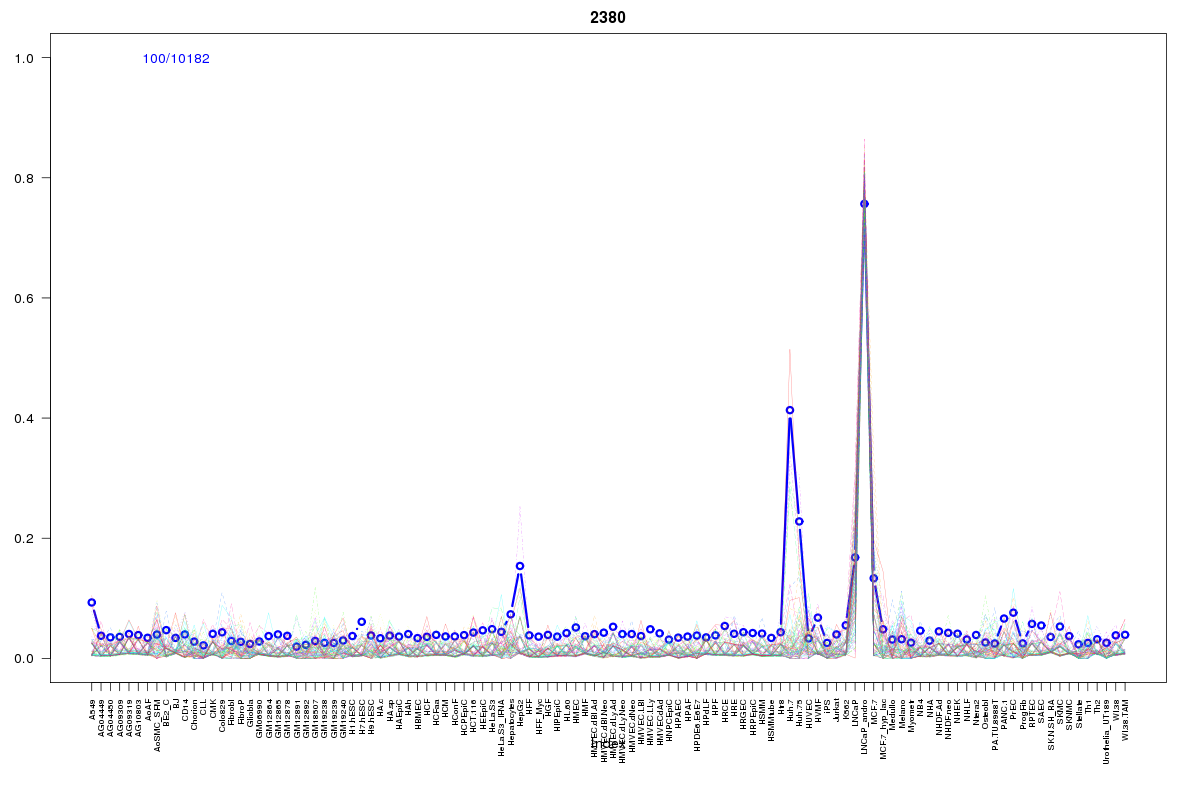 | 2380 | 1 |
 | 1877 | 1 |
 | 979 | 1 |
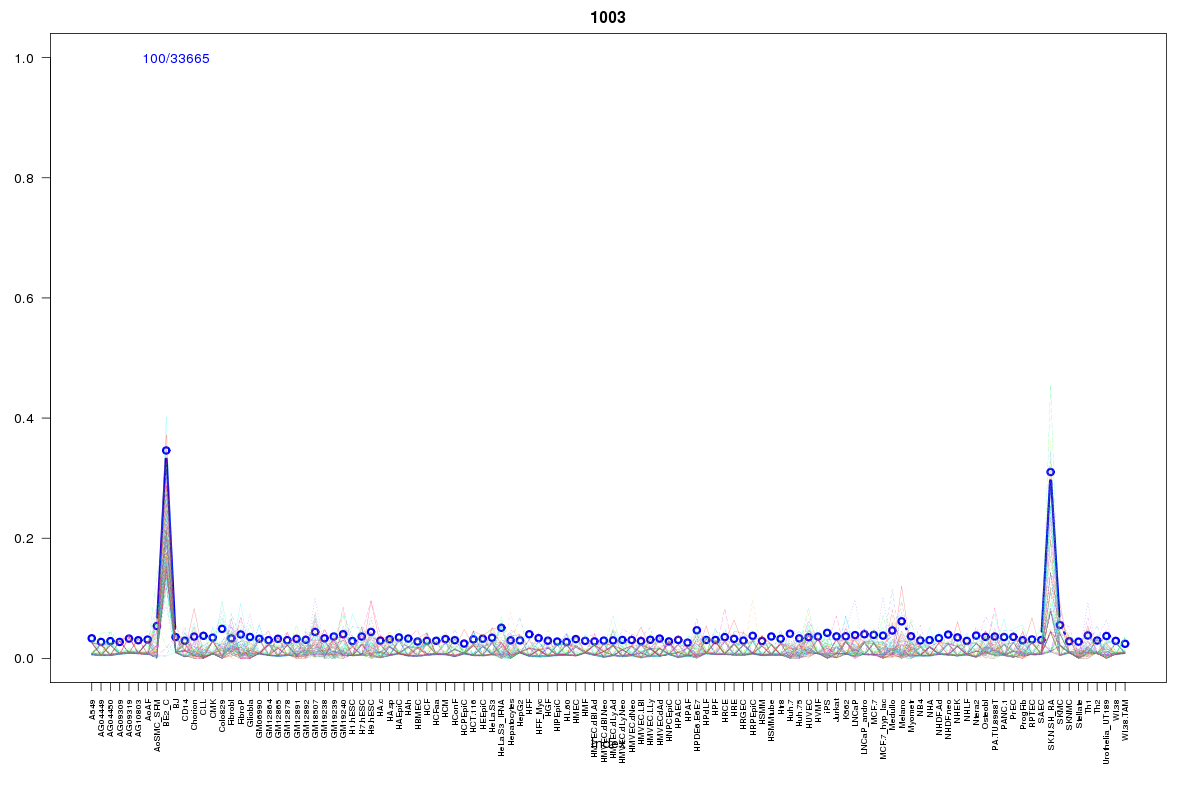 | 1003 | 1 |
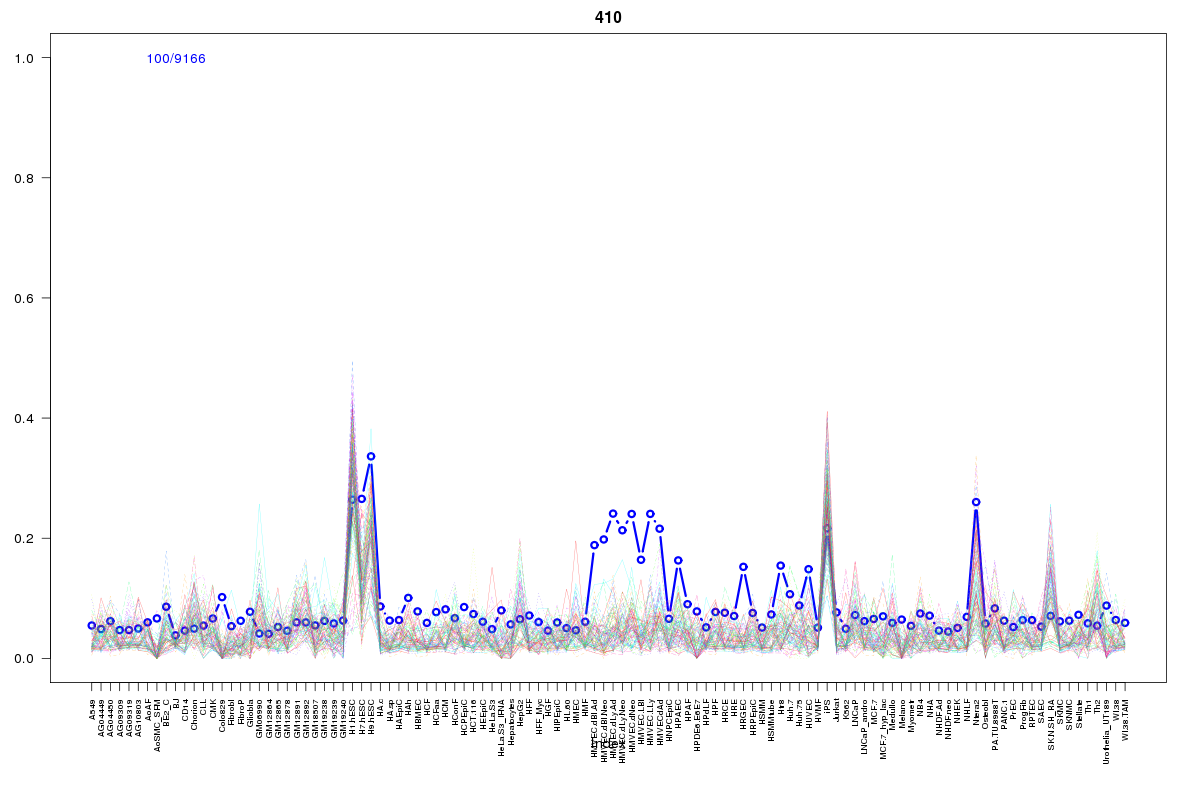 | 410 | 1 |
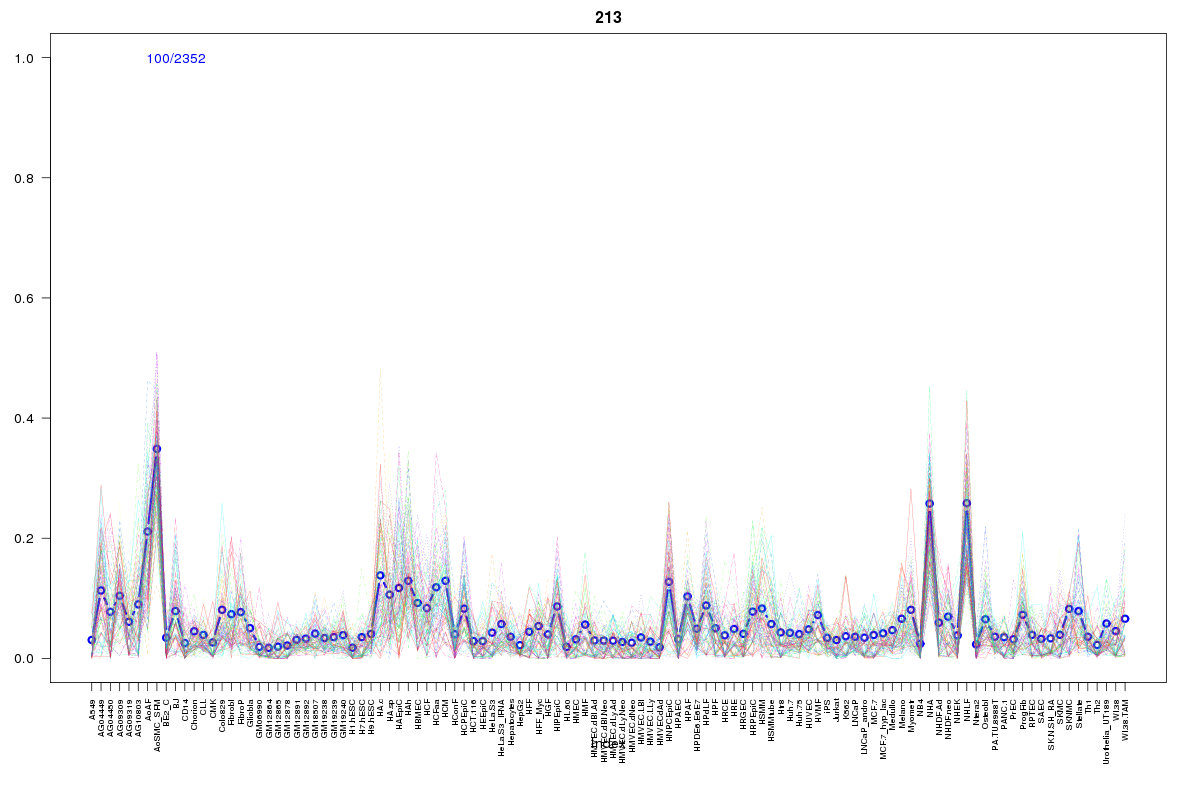 | 213 | 1 |
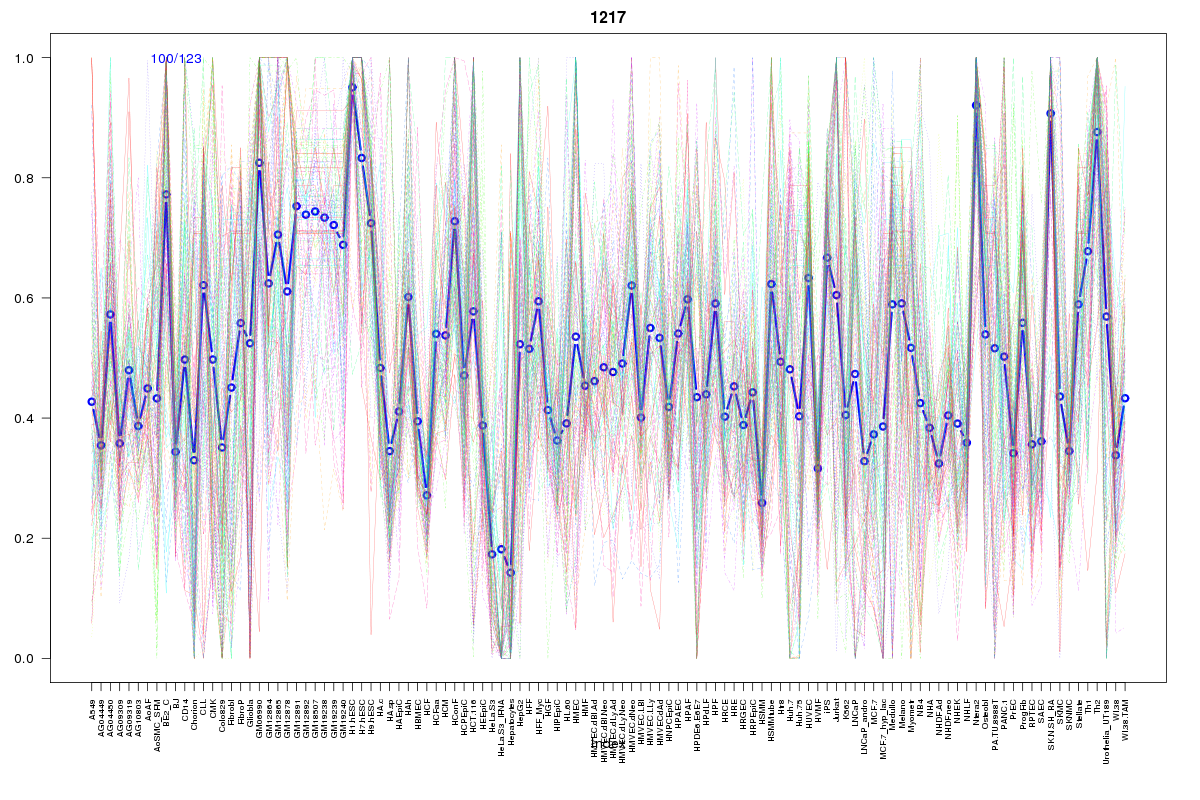 | 1217 | 1 |
Resources
BED file downloads
Connects to 15 DHS sitesTop 10 Correlated DHS Sites
p-values indiciate significant higher or lower correlation| Location | Cluster | P-value |
|---|---|---|
| chr8:11200805-11200955 | 1003 | 0.002 |
| chr8:11067460-11067610 | 1669 | 0.008 |
| chr8:11162000-11162150 | 1877 | 0.008 |
| chr8:11059260-11059410 | 1217 | 0.01 |
| chr8:11056200-11056350 | 213 | 0.011 |
| chr8:11250585-11250735 | 410 | 0.013 |
| chr8:11268060-11268210 | 1252 | 0.016 |
| chr8:11141880-11142030 | 100 | 0.016 |
| chr8:11267880-11268030 | 1252 | 0.018 |
| chr8:11150300-11150450 | 2380 | 0.024 |
| chr8:11137100-11137250 | 2325 | 0.024 |
External Databases
UCSCEnsembl (ENSG00000104643)