Gene: TNPO2
chr19: 12810007-12834810Expression Profile
(log scale)
Graphical Connections
Distribution of linked clusters:
You may find it interesting if many of the connected DHS sites belong to the same cluster.| Cluster Profile | Cluster ID | Number of DHS sites in this cluster |
|---|---|---|
 | 927 | 2 |
 | 629 | 1 |
 | 570 | 1 |
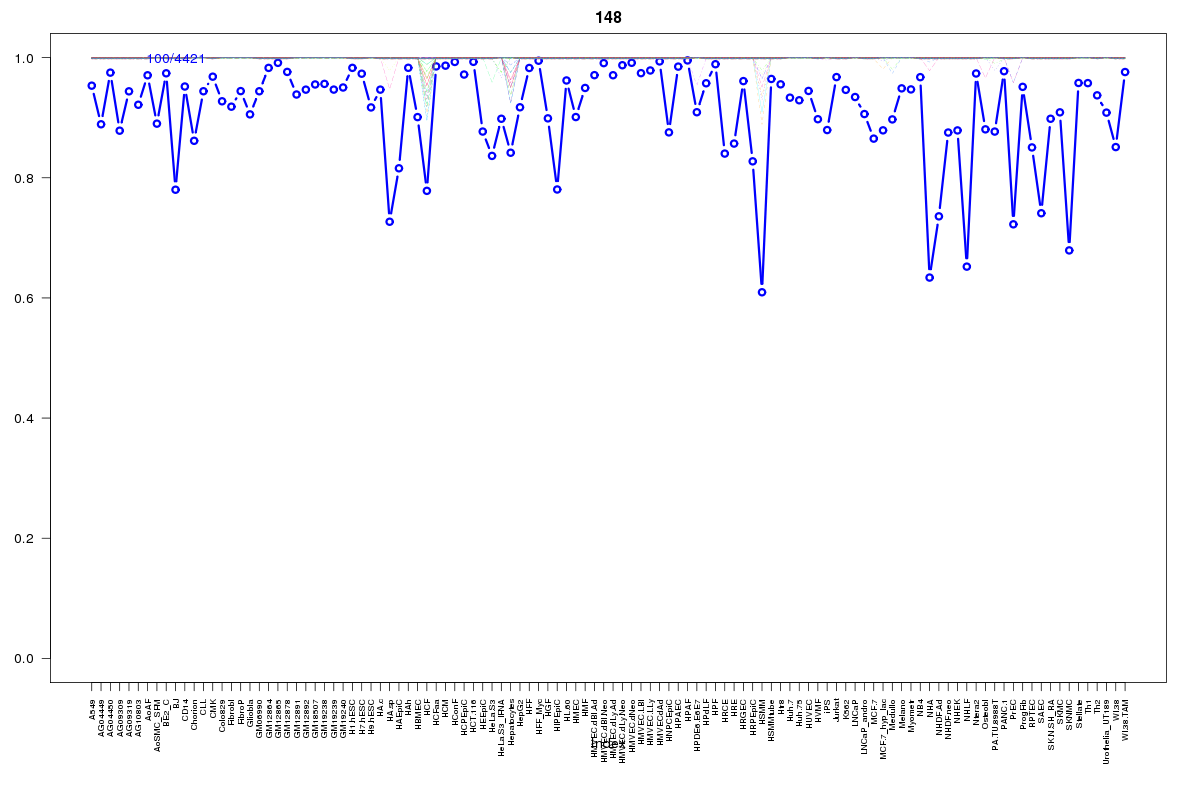 | 148 | 1 |
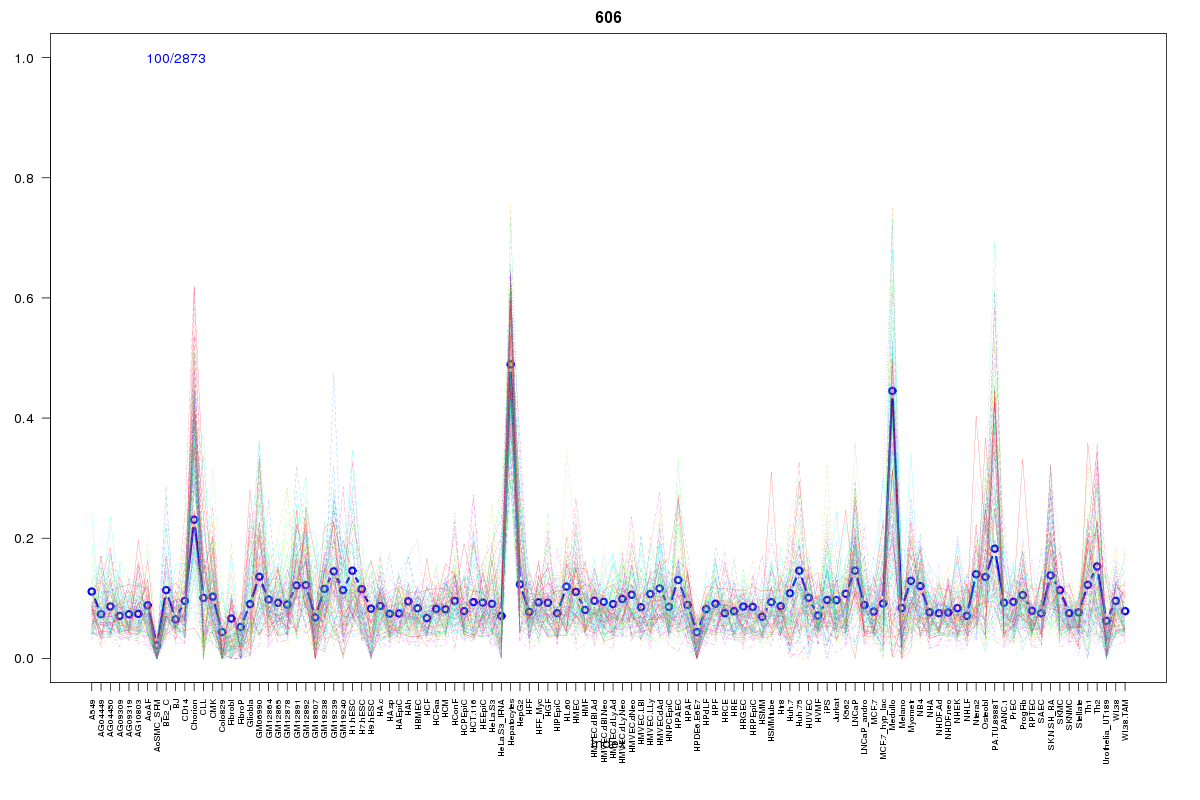 | 606 | 1 |
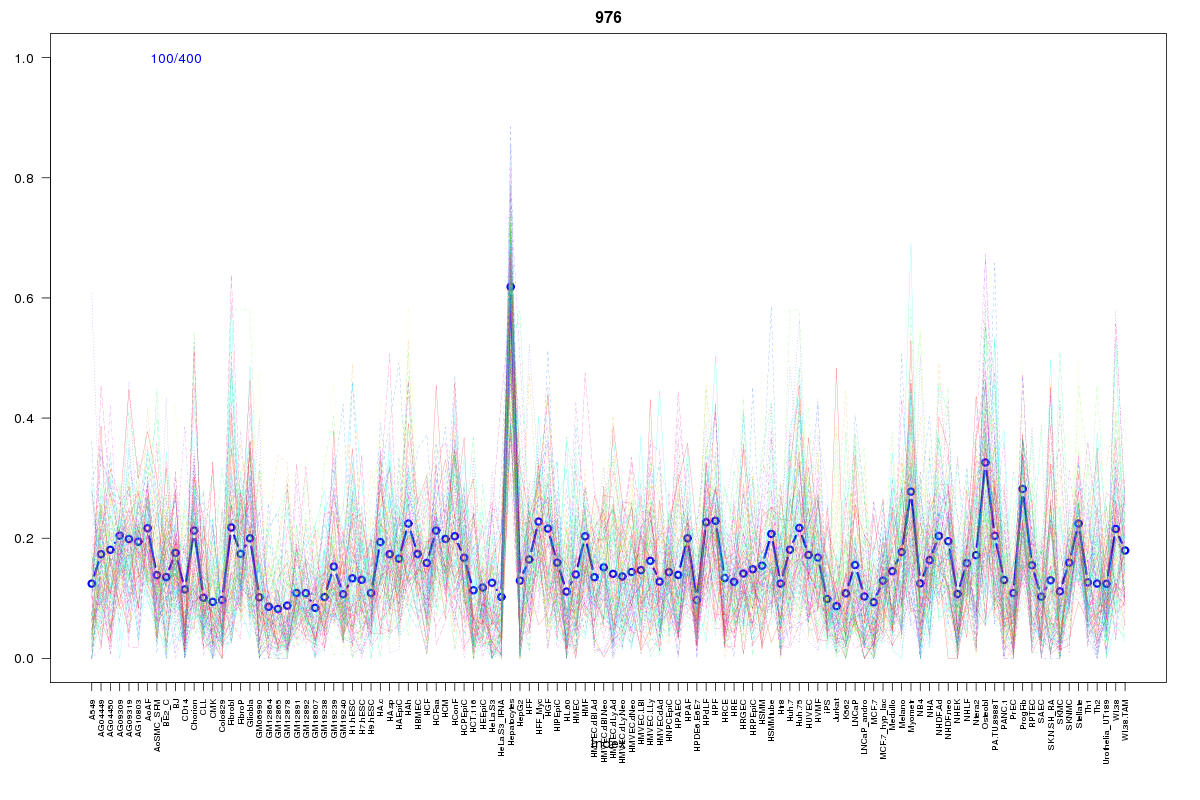 | 976 | 1 |
 | 527 | 1 |
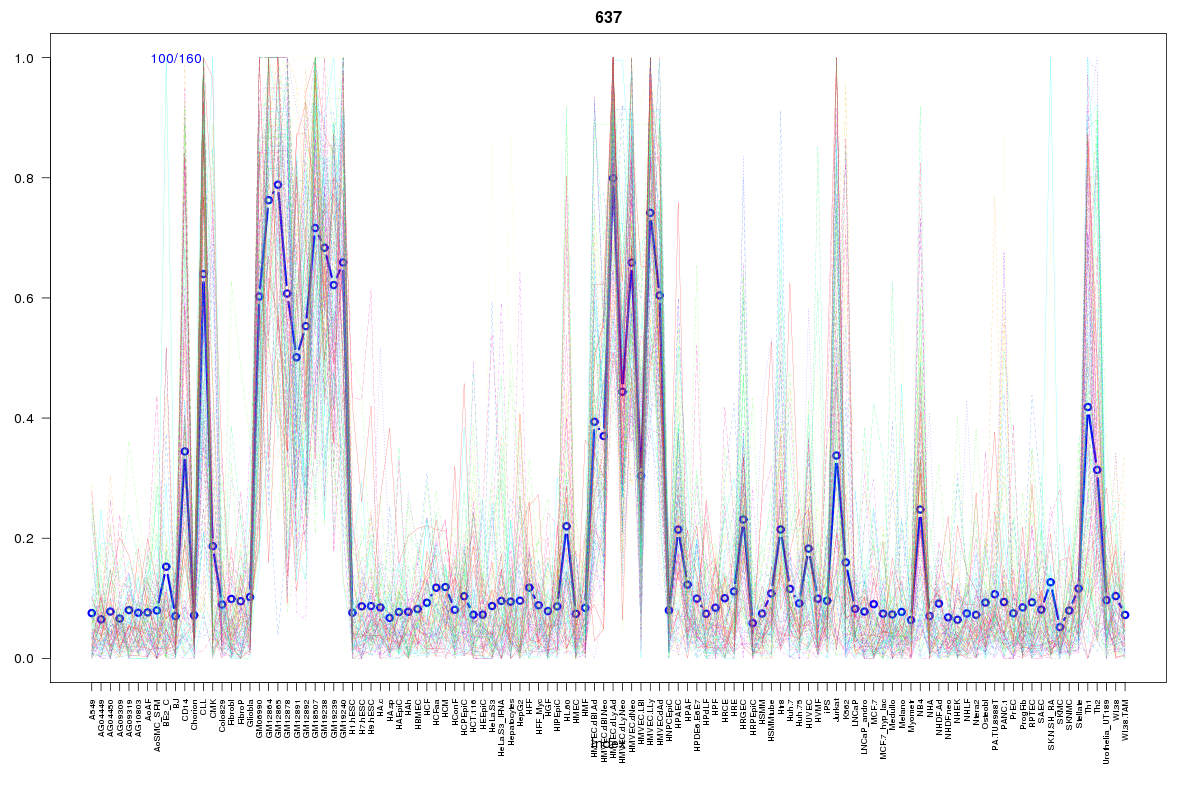 | 637 | 1 |
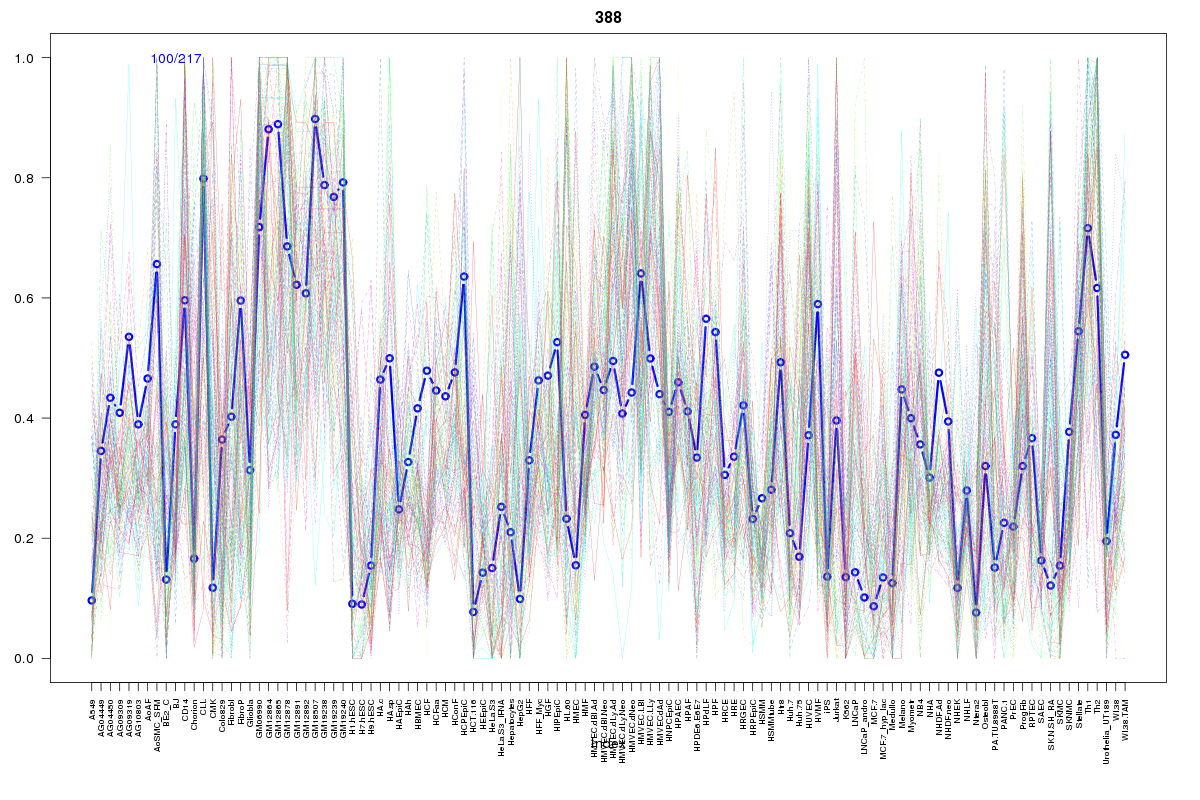 | 388 | 1 |
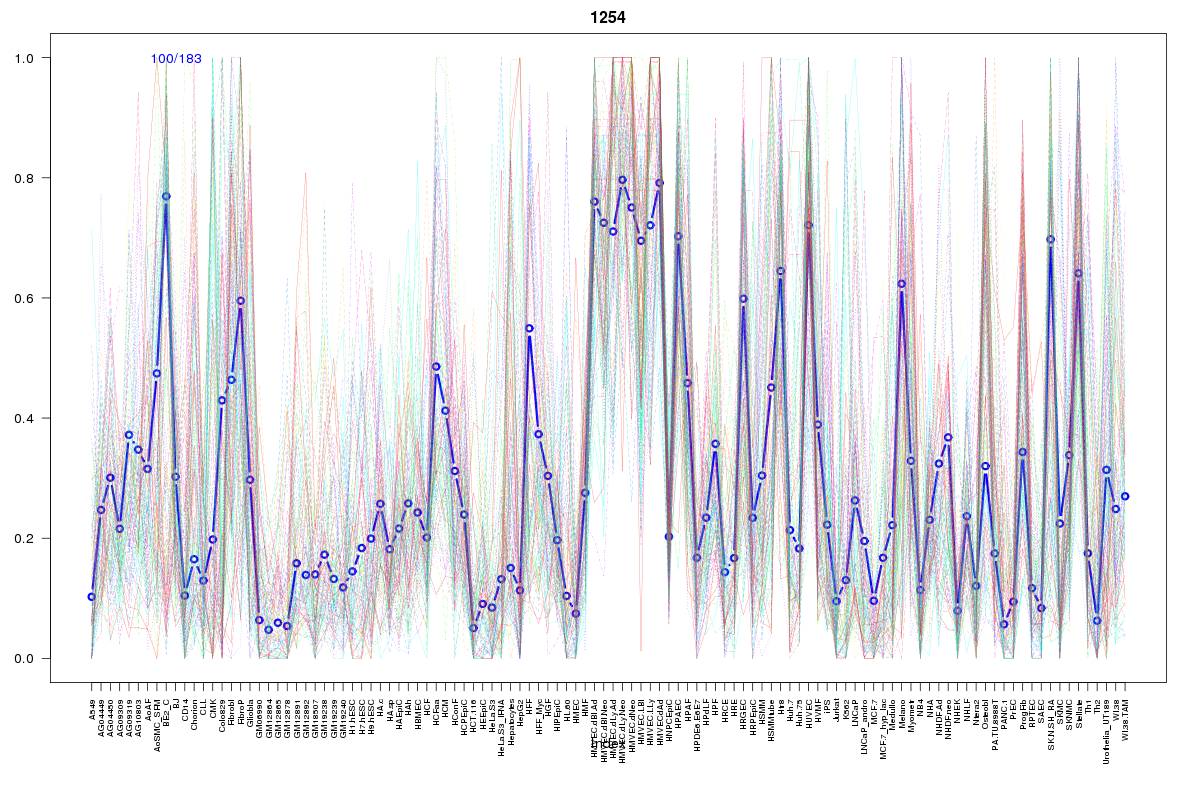 | 1254 | 1 |
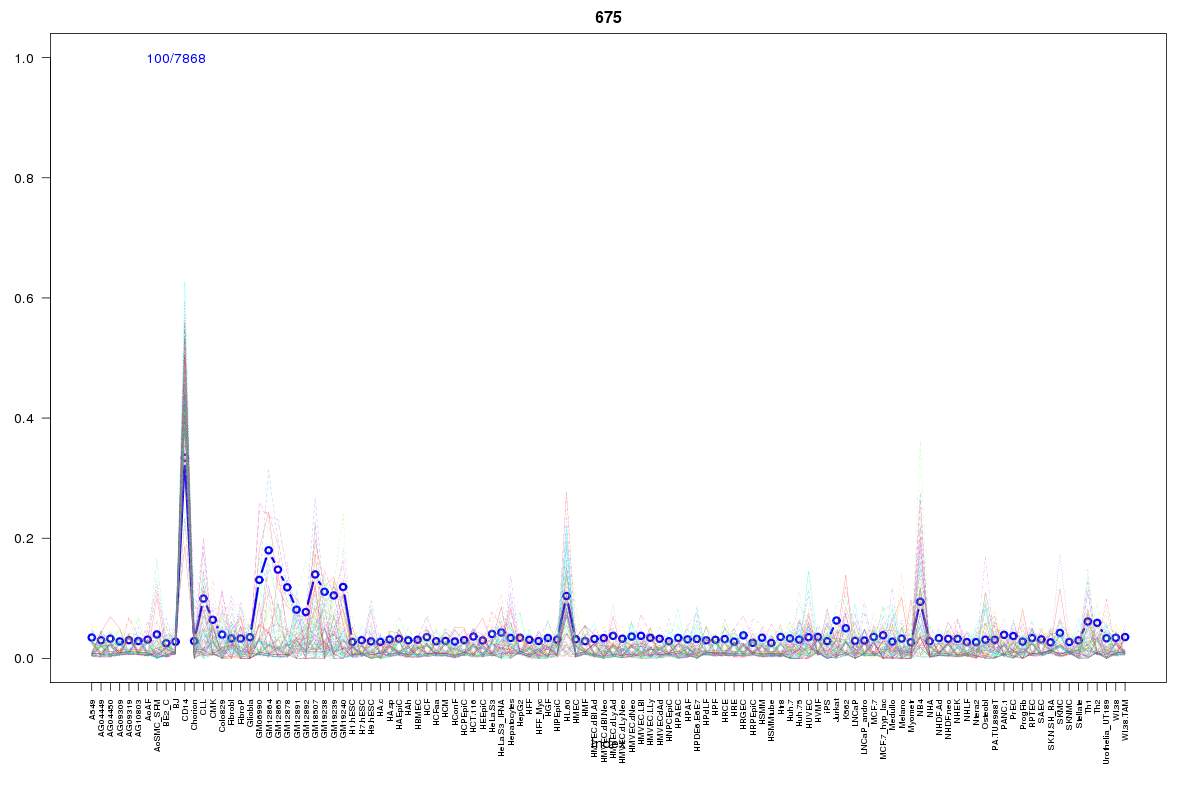 | 675 | 1 |
 | 251 | 1 |
 | 2114 | 1 |
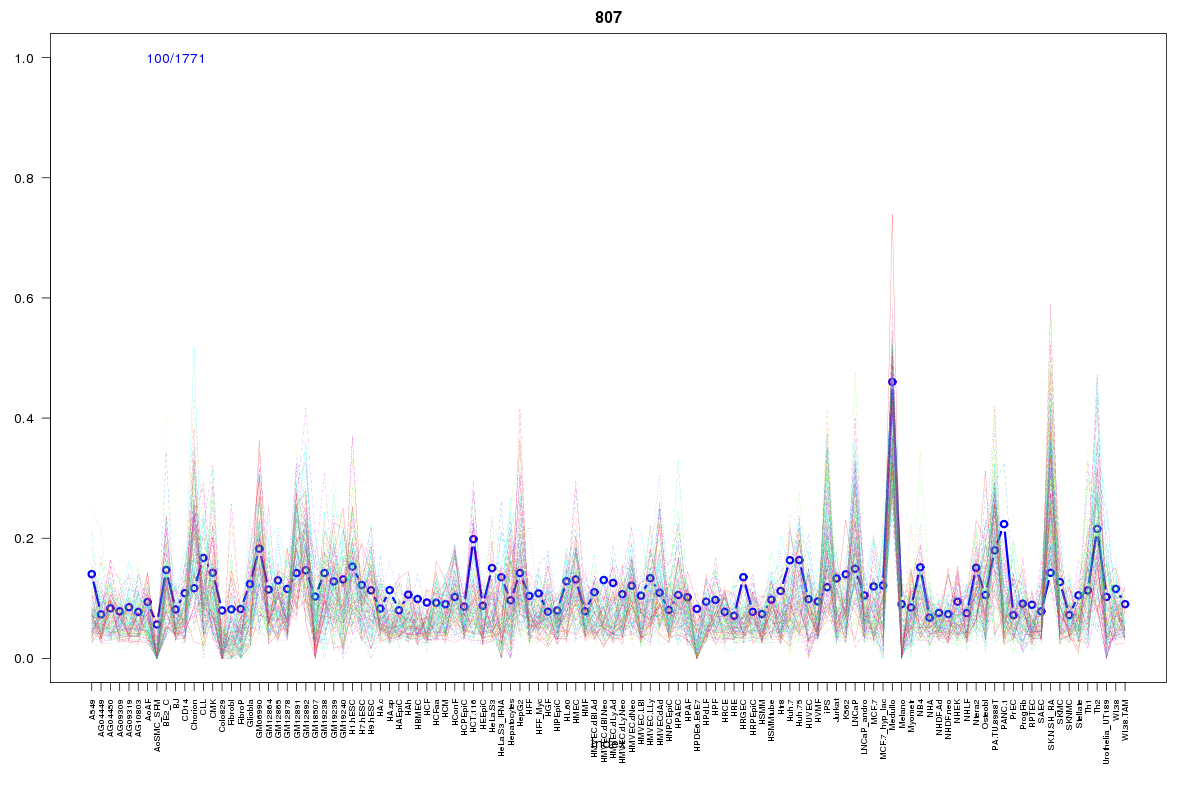 | 807 | 1 |
 | 626 | 1 |
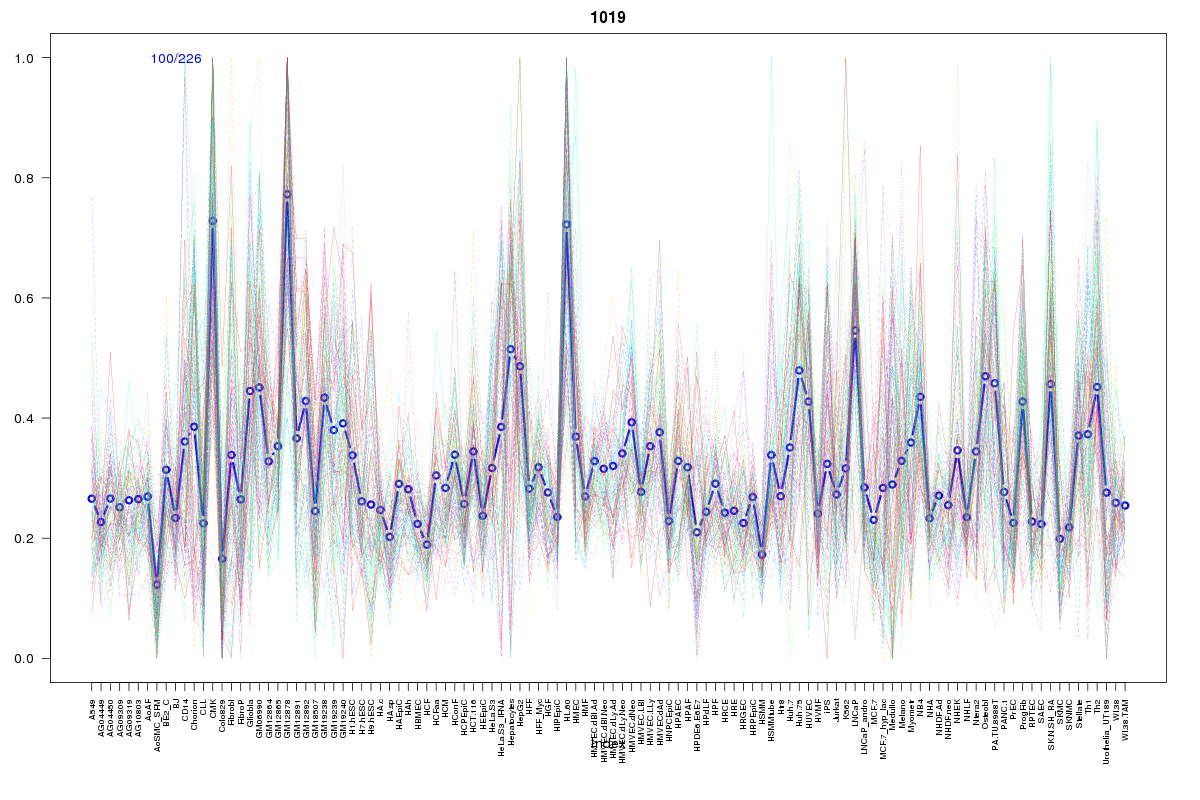 | 1019 | 1 |
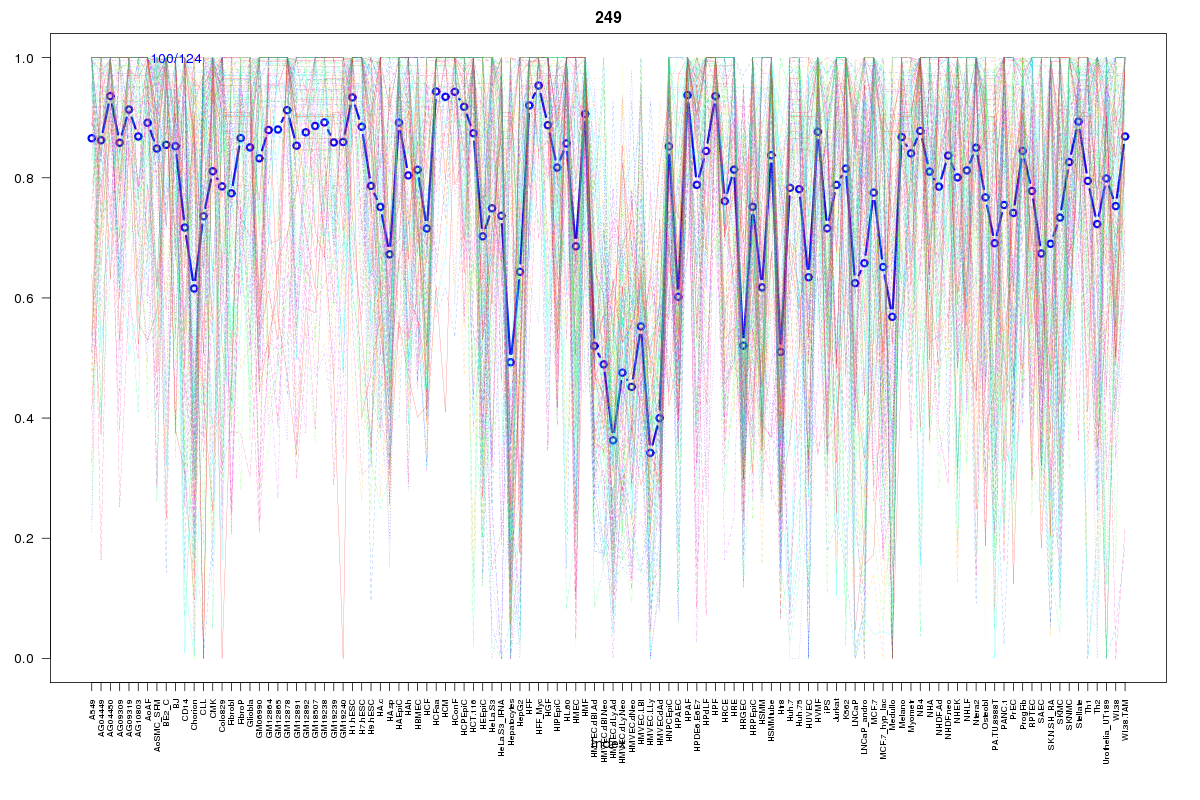 | 249 | 1 |
 | 149 | 1 |
Resources
BED file downloads
Connects to 19 DHS sitesTop 10 Correlated DHS Sites
p-values indiciate significant higher or lower correlation| Location | Cluster | P-value |
|---|---|---|
| chr19:12847685-12847835 | 148 | 0 |
| chr19:12791945-12792095 | 249 | 0 |
| chr19:12746440-12746590 | 2114 | 0.007 |
| chr19:12792100-12792250 | 149 | 0.007 |
| chr19:12916820-12916970 | 807 | 0.017 |
| chr19:12834300-12834450 | 629 | 0.021 |
| chr19:12904920-12905070 | 251 | 0.024 |
| chr19:12893860-12894010 | 1254 | 0.022 |
| chr19:12864425-12864575 | 606 | 0.022 |
| chr19:12779760-12779910 | 1019 | 0.021 |
| chr19:12893000-12893150 | 637 | 0.02 |
External Databases
UCSCEnsembl (ENSG00000105576)