Gene: TMTC4
chr13: 101256180-101327133Expression Profile
(log scale)
Graphical Connections
Distribution of linked clusters:
You may find it interesting if many of the connected DHS sites belong to the same cluster.| Cluster Profile | Cluster ID | Number of DHS sites in this cluster |
|---|---|---|
 | 2110 | 2 |
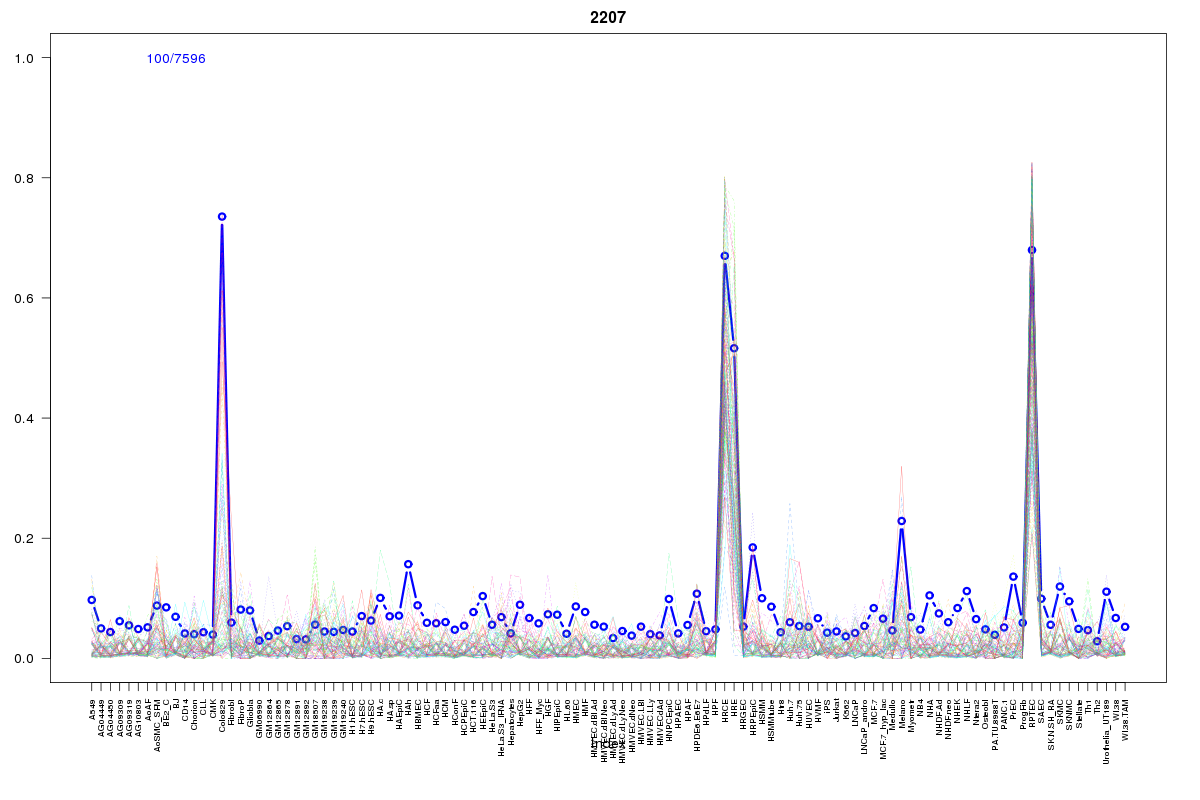 | 2207 | 2 |
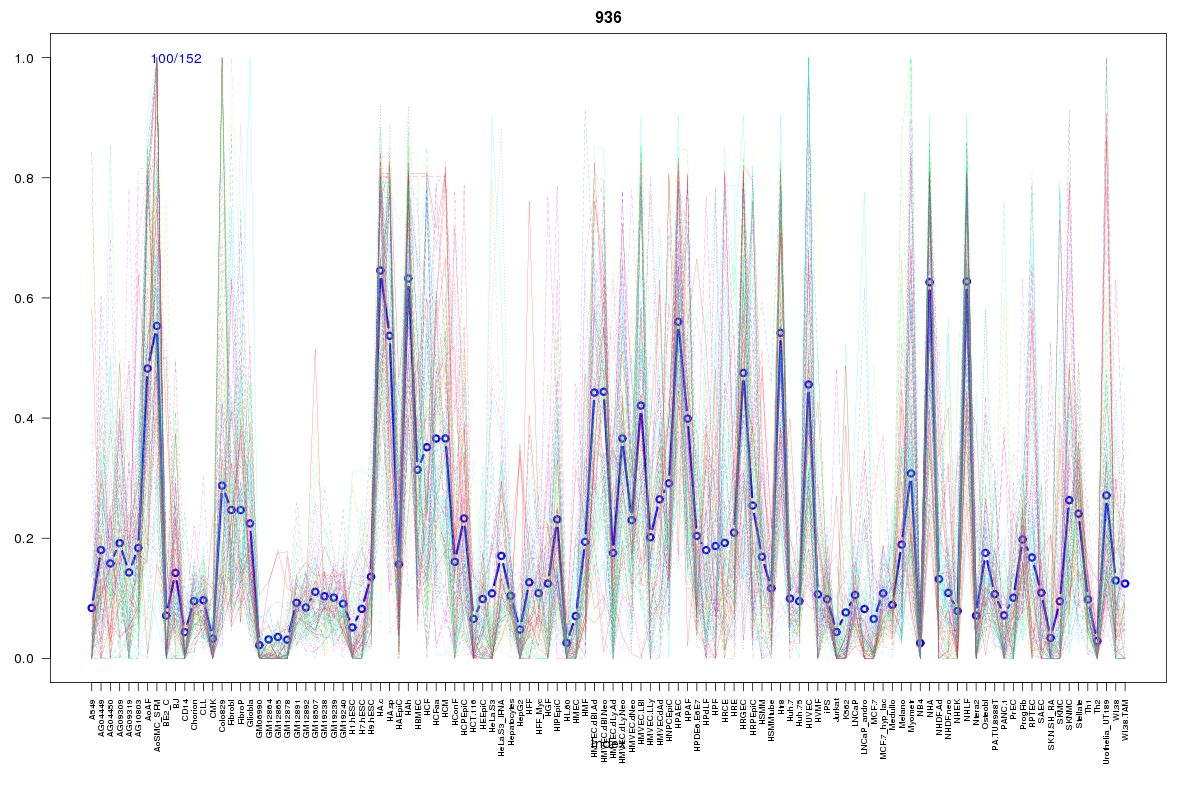 | 936 | 2 |
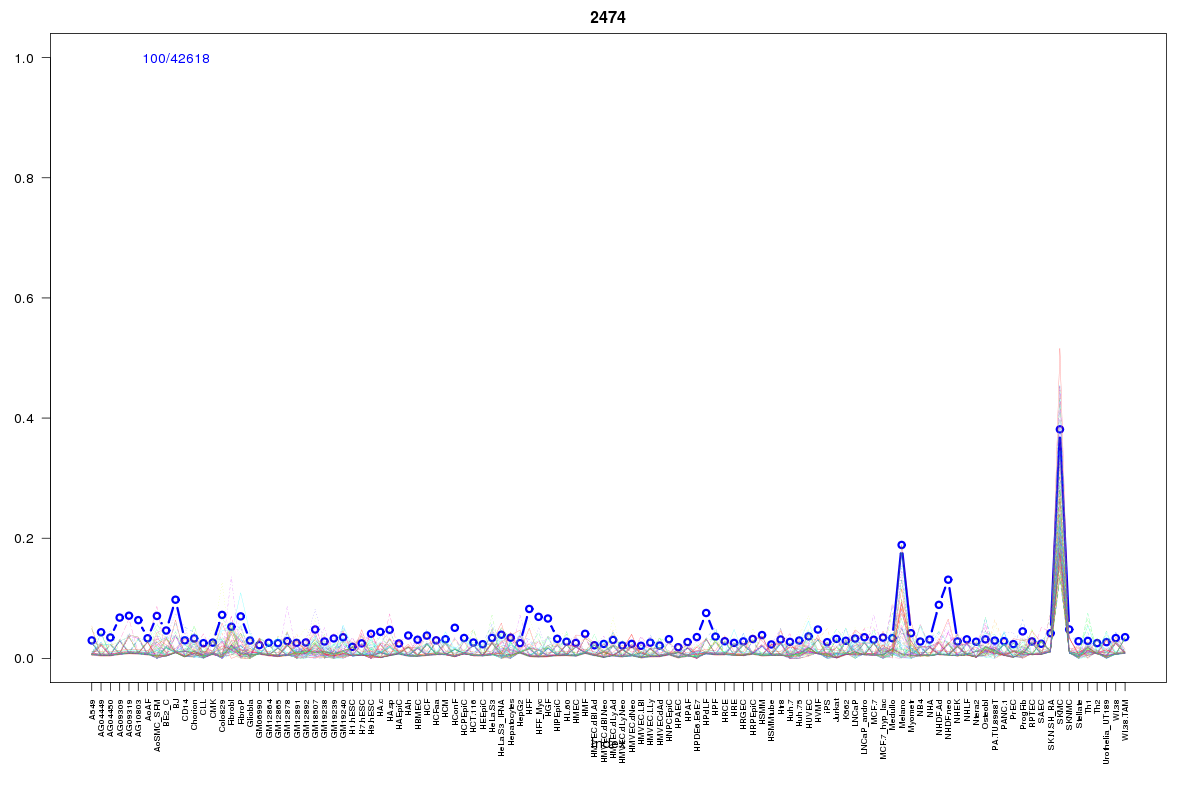 | 2474 | 2 |
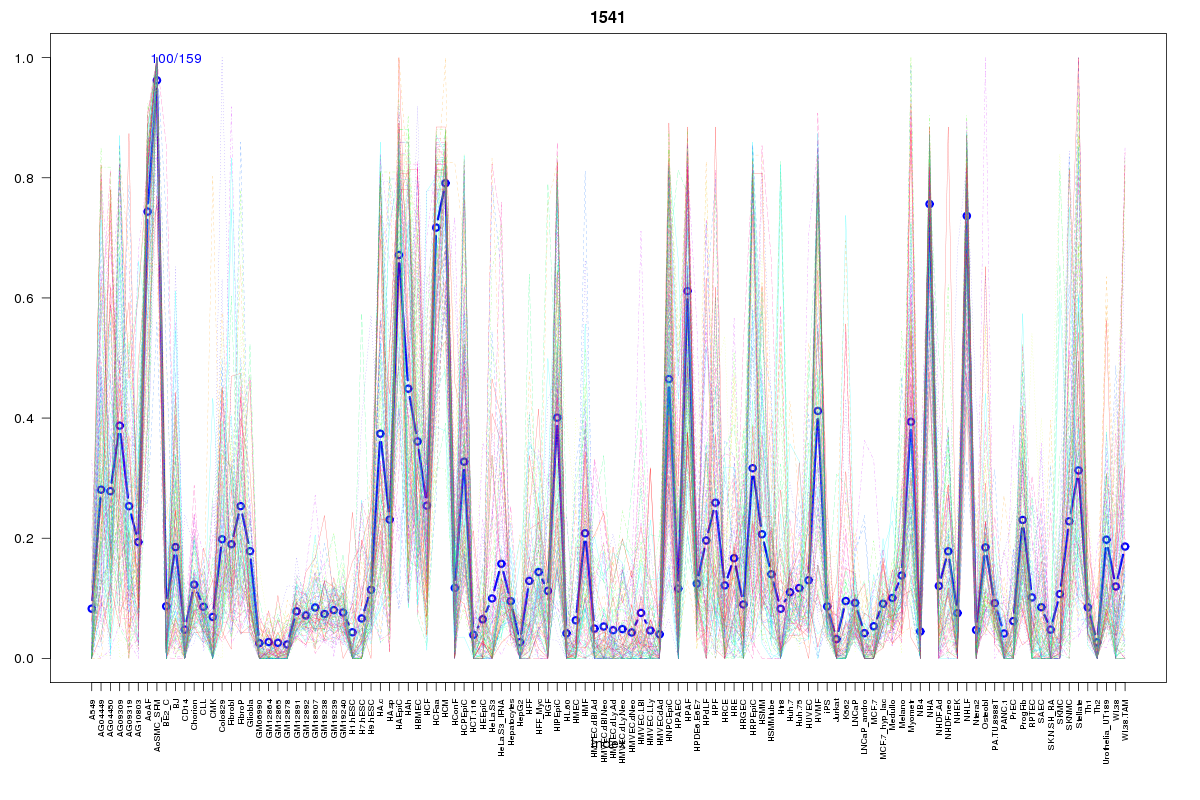 | 1541 | 2 |
 | 2181 | 1 |
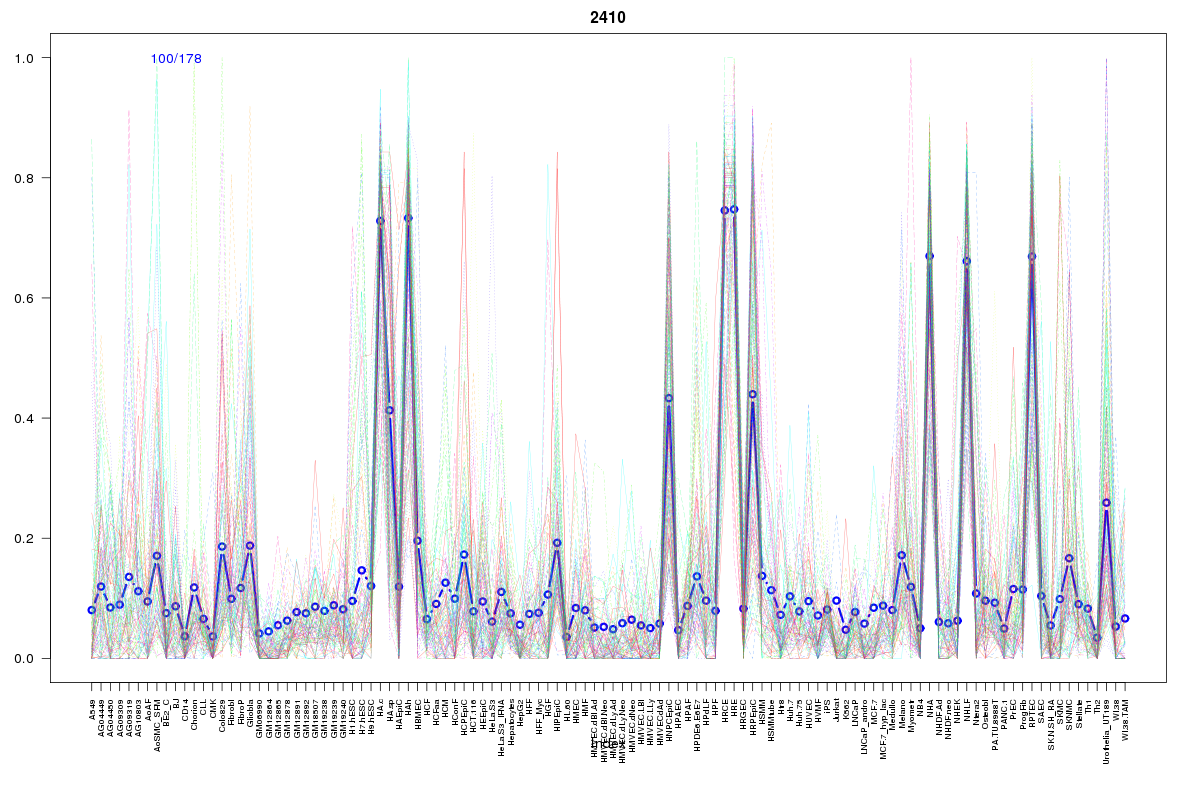 | 2410 | 1 |
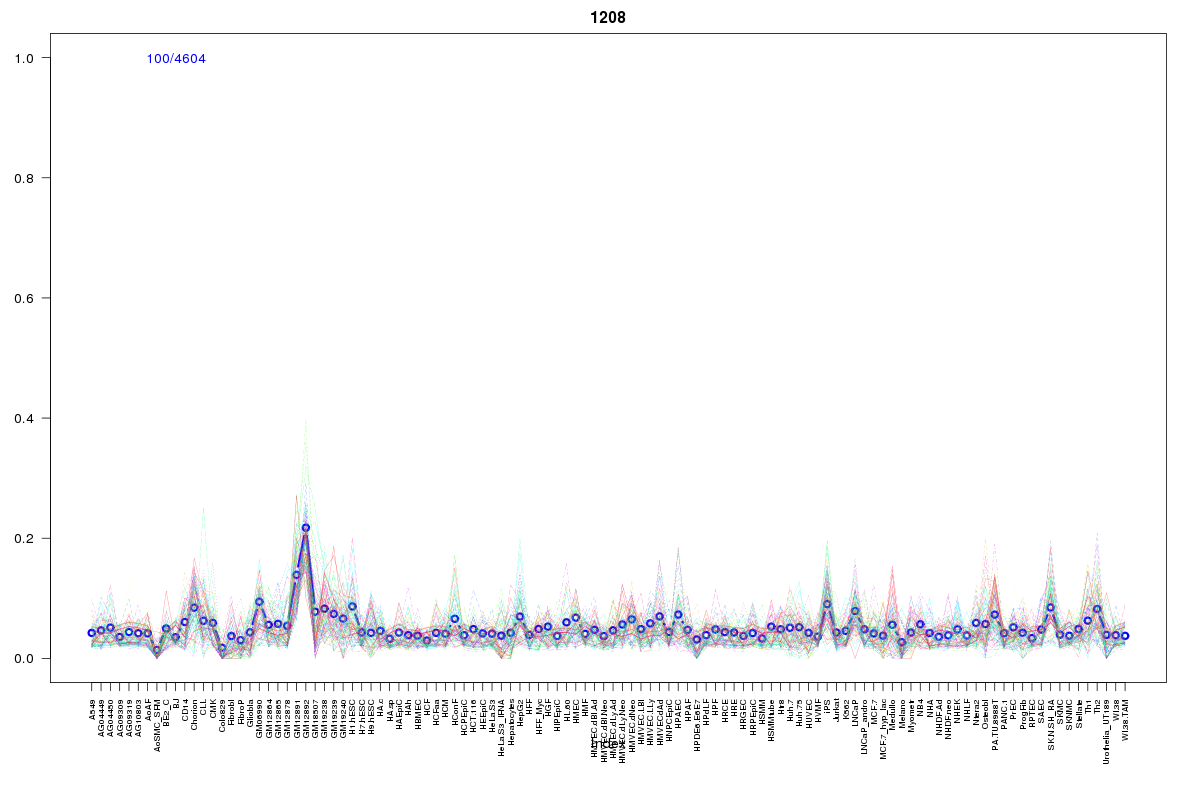 | 1208 | 1 |
 | 2052 | 1 |
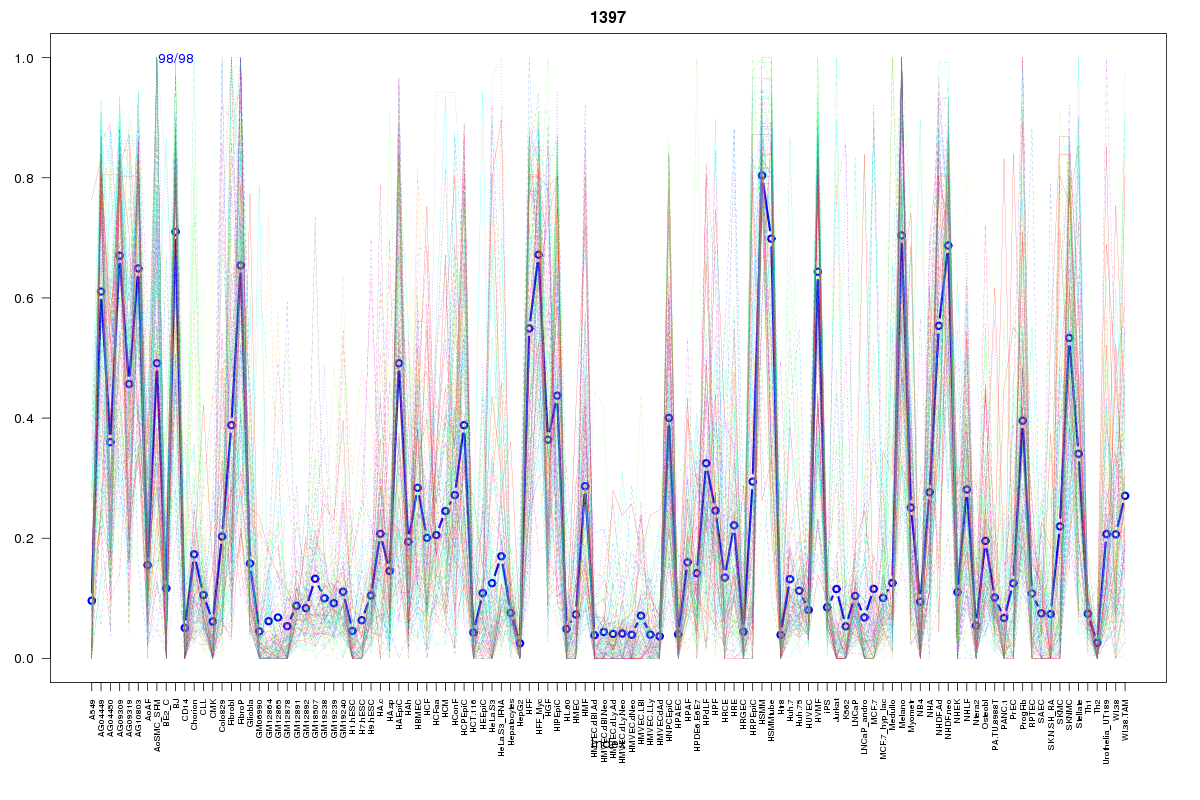 | 1397 | 1 |
 | 862 | 1 |
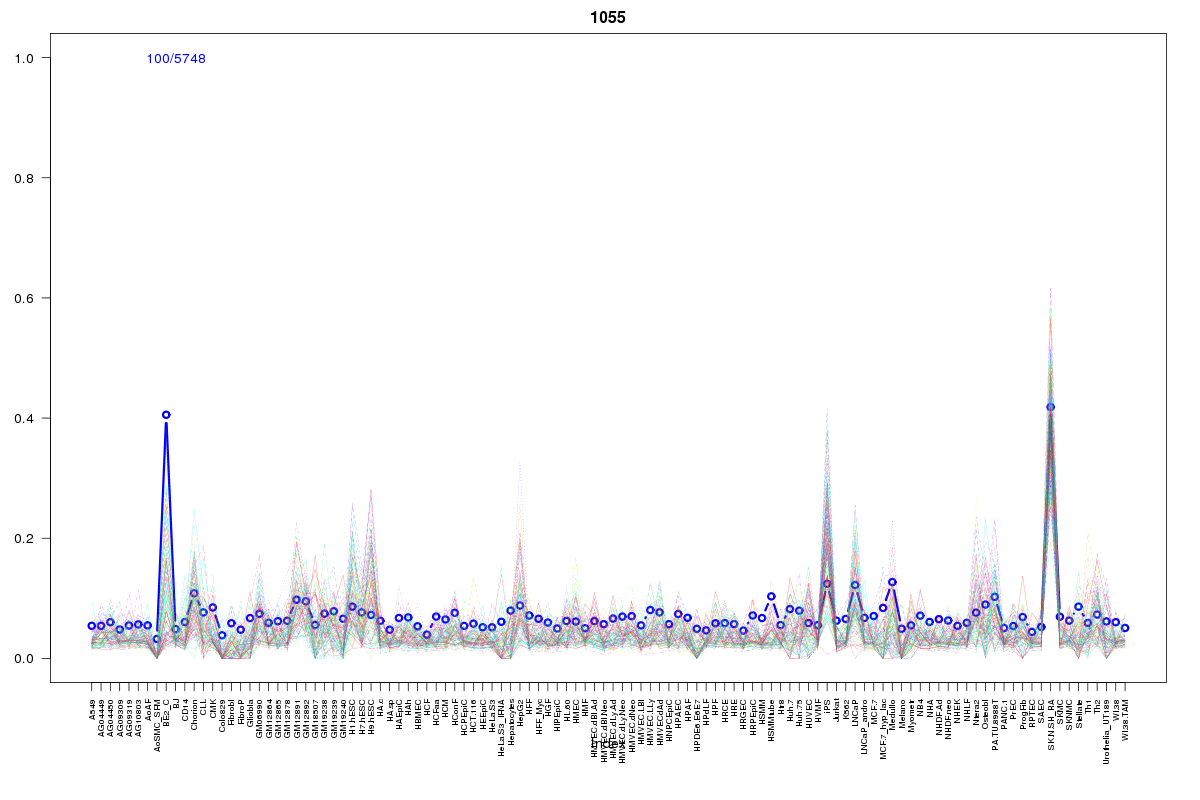 | 1055 | 1 |
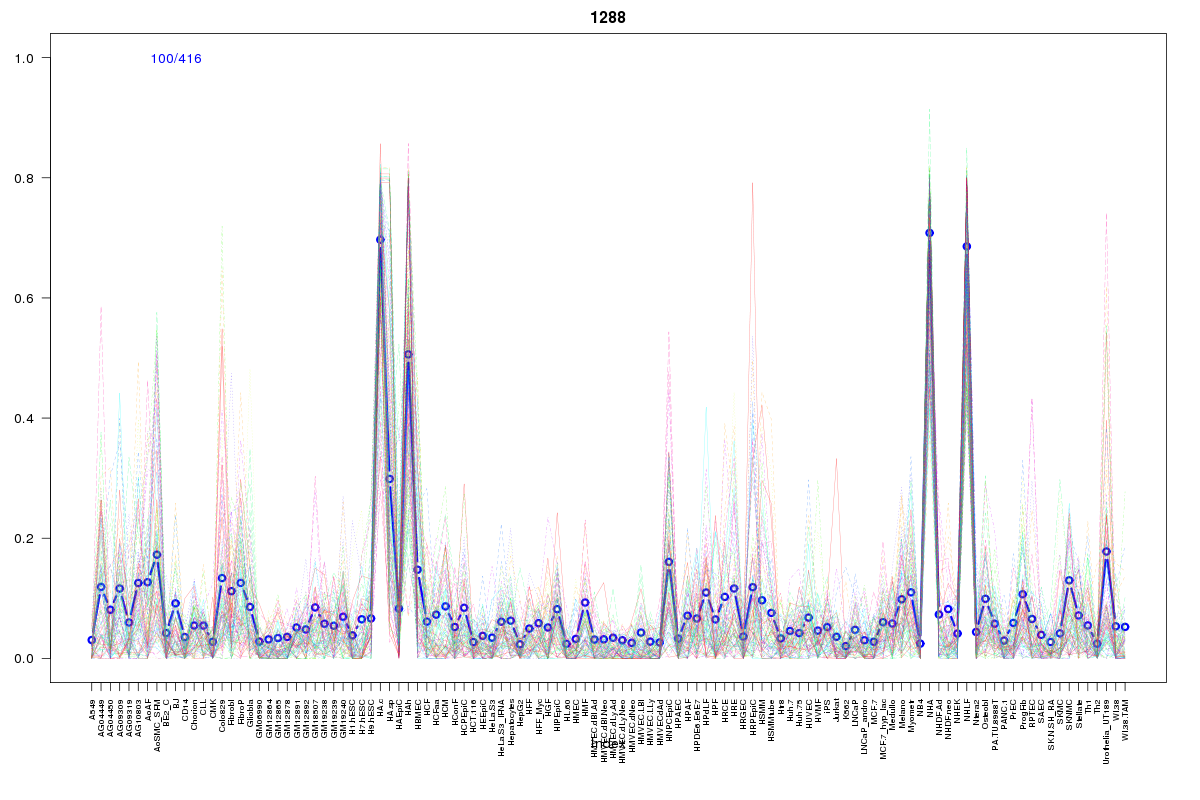 | 1288 | 1 |
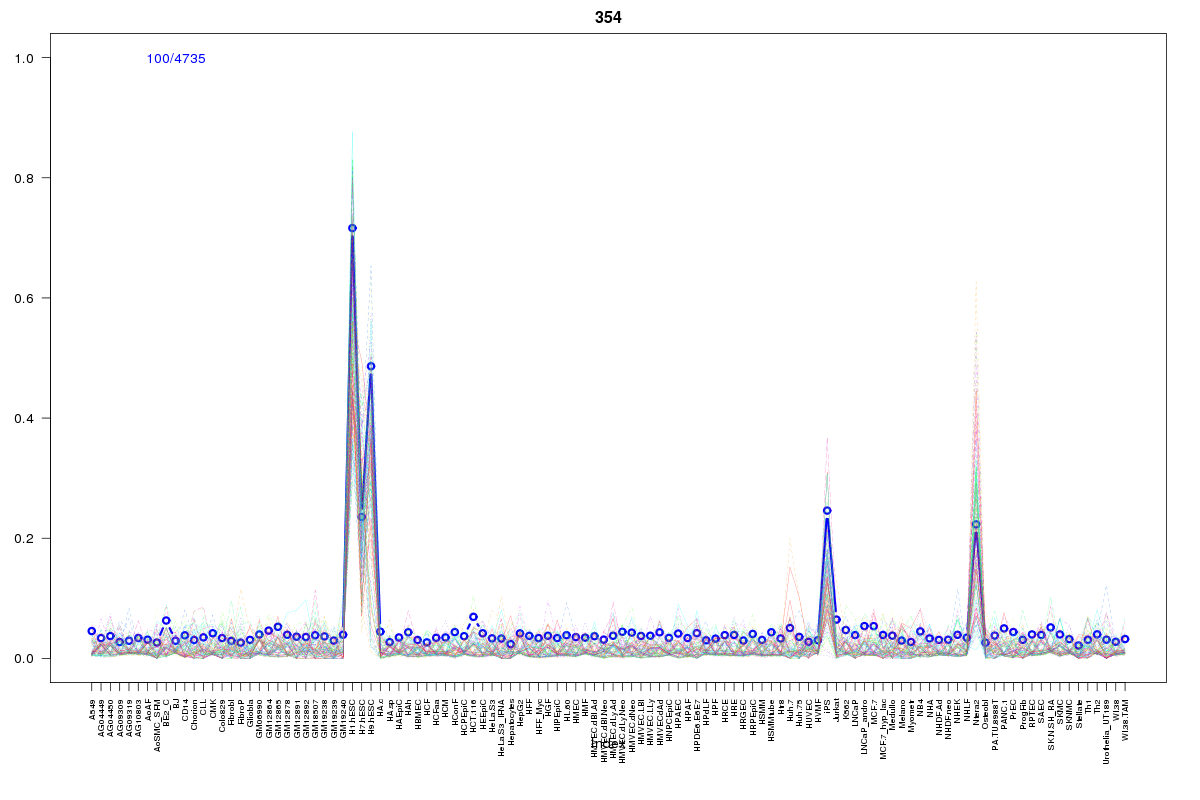 | 354 | 1 |
 | 10 | 1 |
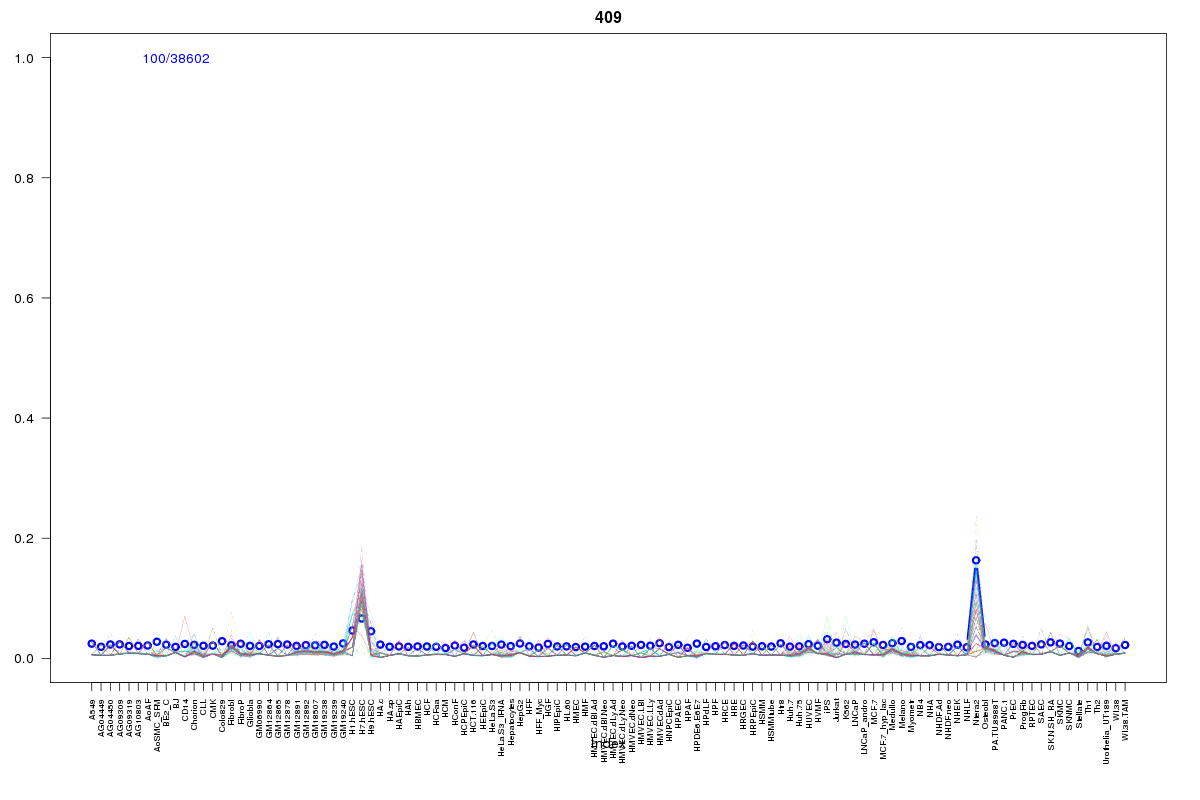 | 409 | 1 |
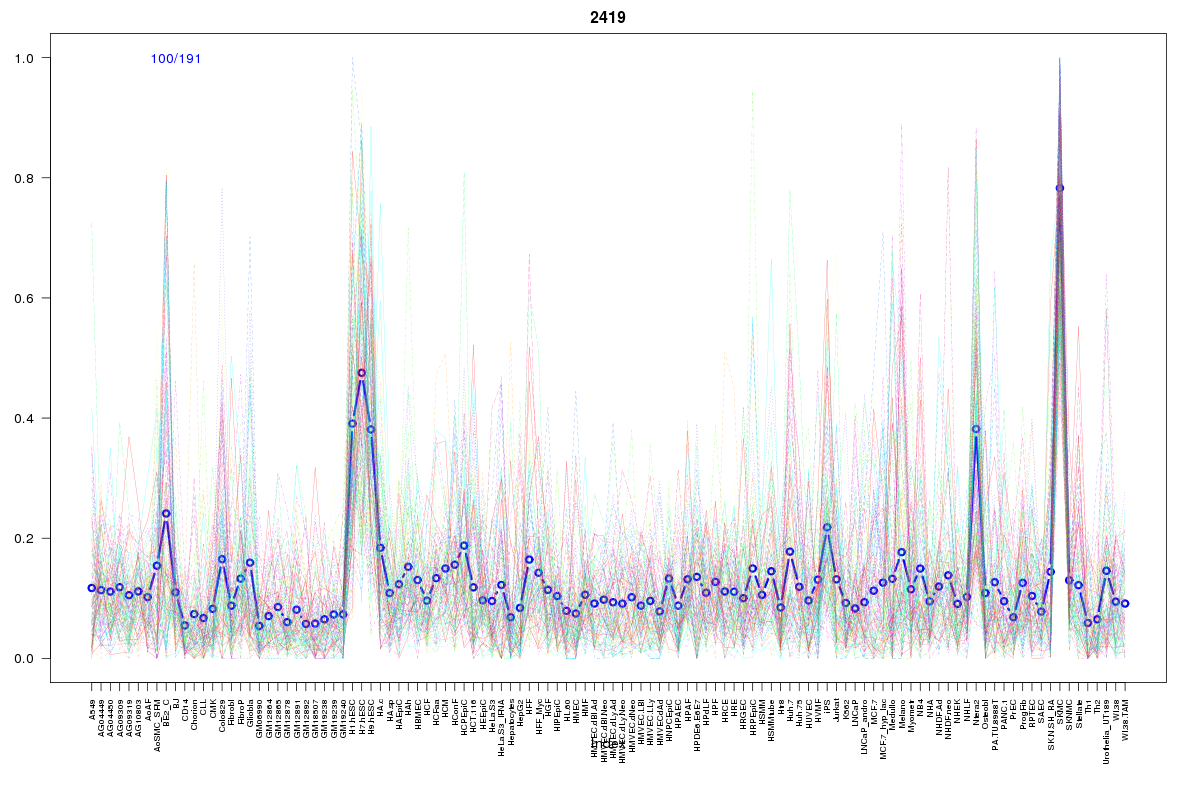 | 2419 | 1 |
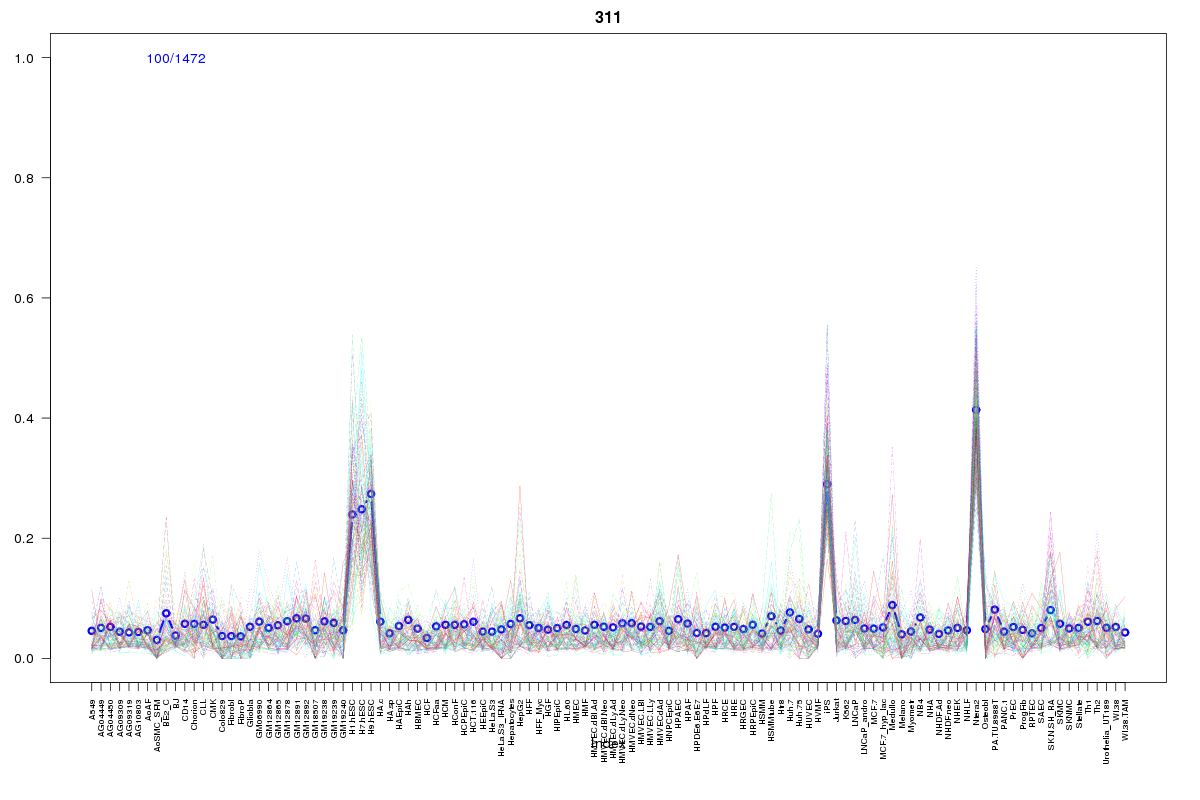 | 311 | 1 |
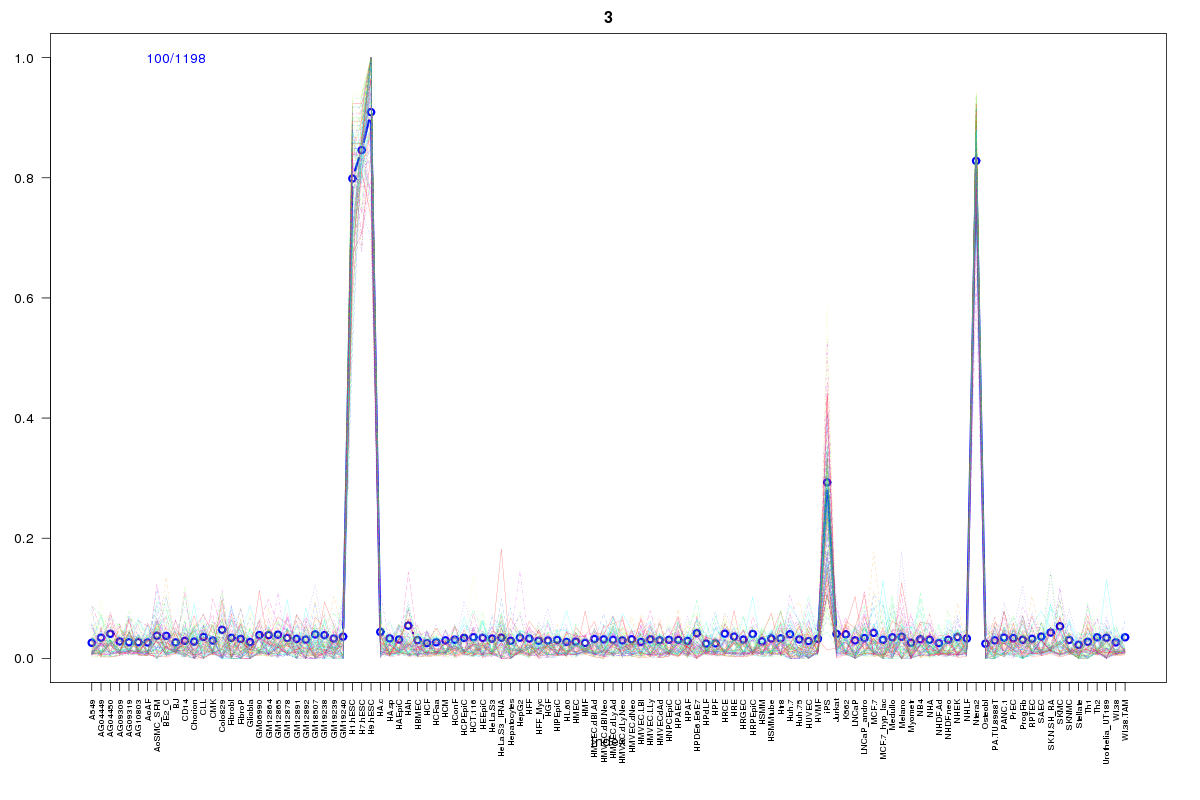 | 3 | 1 |
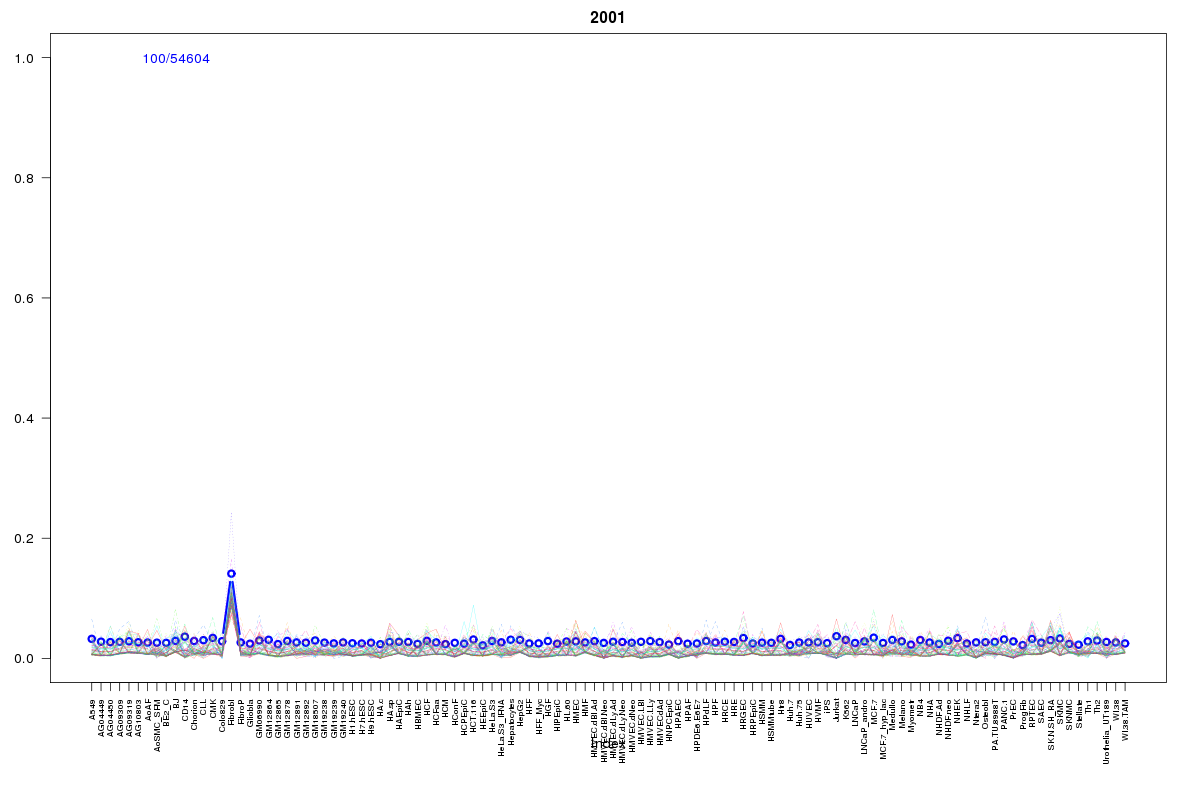 | 2001 | 1 |
 | 2468 | 1 |
 | 253 | 1 |
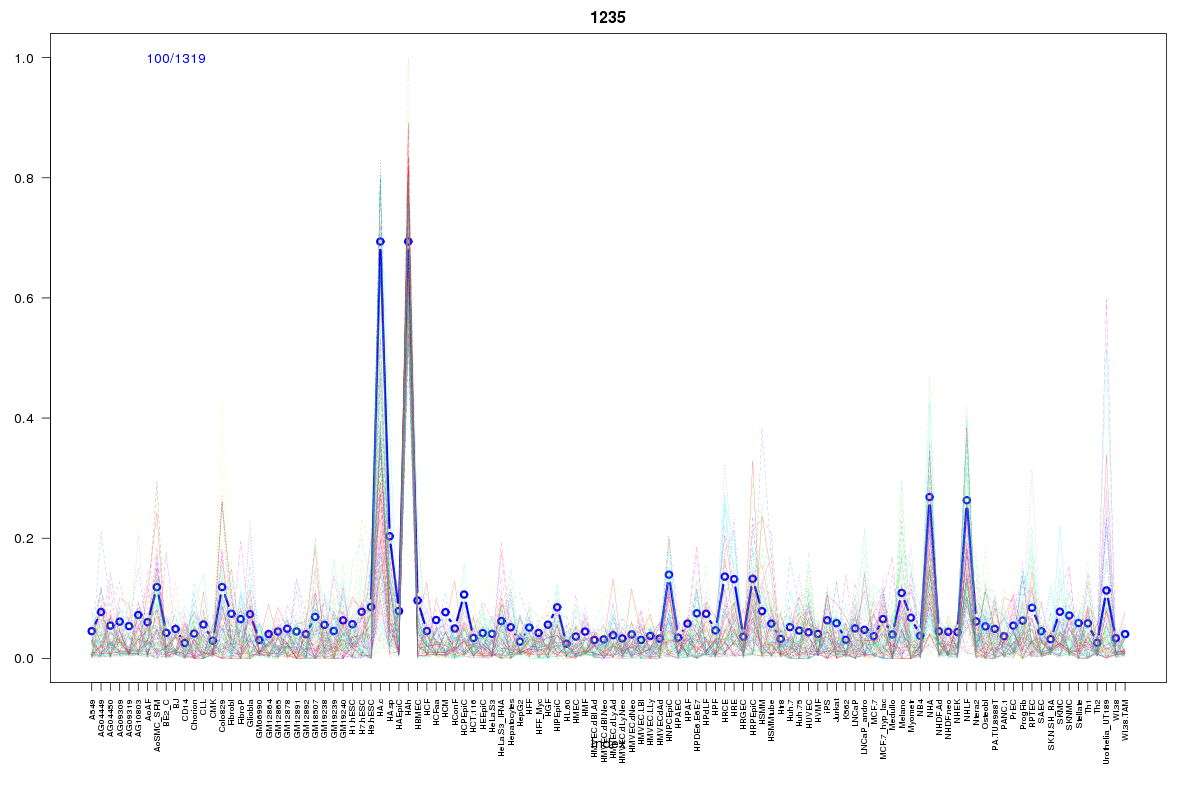 | 1235 | 1 |
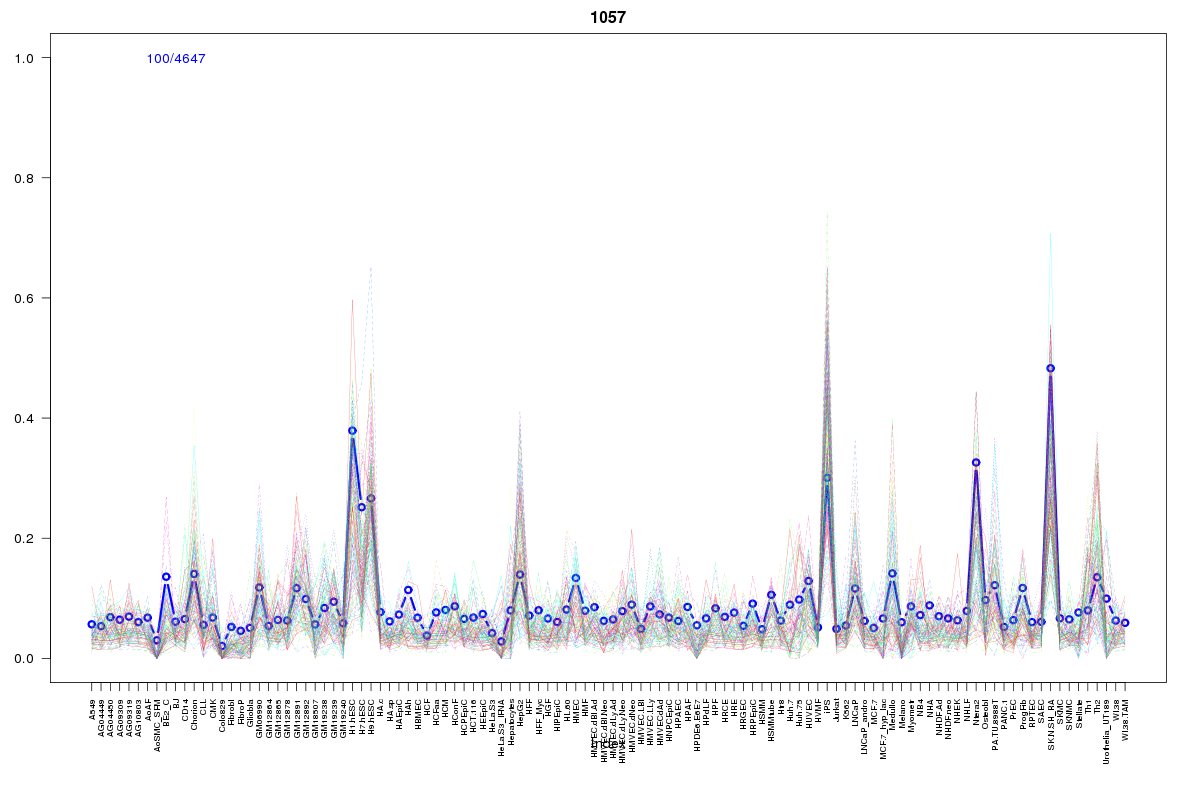 | 1057 | 1 |
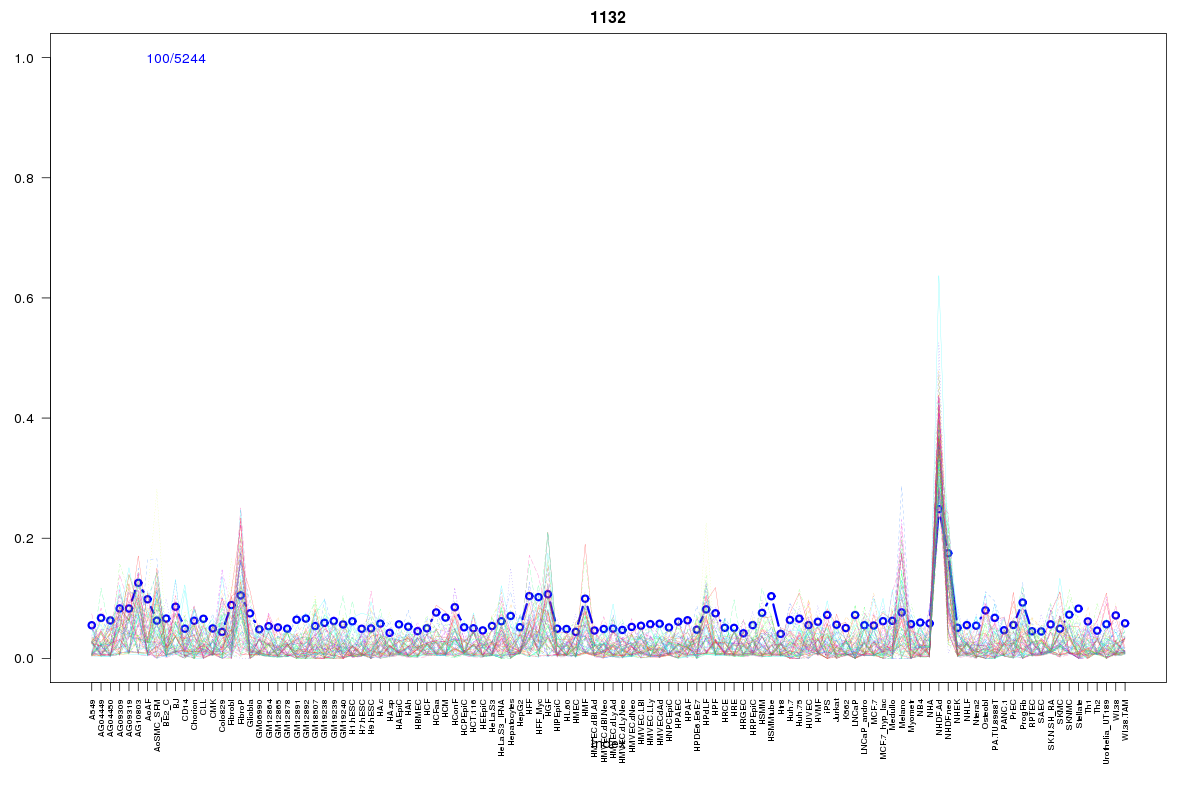 | 1132 | 1 |
Resources
BED file downloads
Connects to 30 DHS sitesTop 10 Correlated DHS Sites
p-values indiciate significant higher or lower correlation| Location | Cluster | P-value |
|---|---|---|
| chr13:101325740-101325890 | 1057 | 0.001 |
| chr13:101321025-101321175 | 1235 | 0.001 |
| chr13:101320625-101320775 | 936 | 0.001 |
| chr13:101320780-101320930 | 936 | 0.001 |
| chr13:101283025-101283175 | 10 | 0.002 |
| chr13:101347300-101347450 | 1541 | 0.002 |
| chr13:101190760-101190910 | 2110 | 0.004 |
| chr13:101311940-101312090 | 311 | 0.004 |
| chr13:101214200-101214350 | 862 | 0.005 |
| chr13:101282860-101283010 | 354 | 0.007 |
| chr13:101360480-101360630 | 2207 | 0.007 |
External Databases
UCSCEnsembl (ENSG00000125247)