Gene: AGTR1
chr3: 148415570-148460790Expression Profile
(log scale)
Graphical Connections
Distribution of linked clusters:
You may find it interesting if many of the connected DHS sites belong to the same cluster.| Cluster Profile | Cluster ID | Number of DHS sites in this cluster |
|---|---|---|
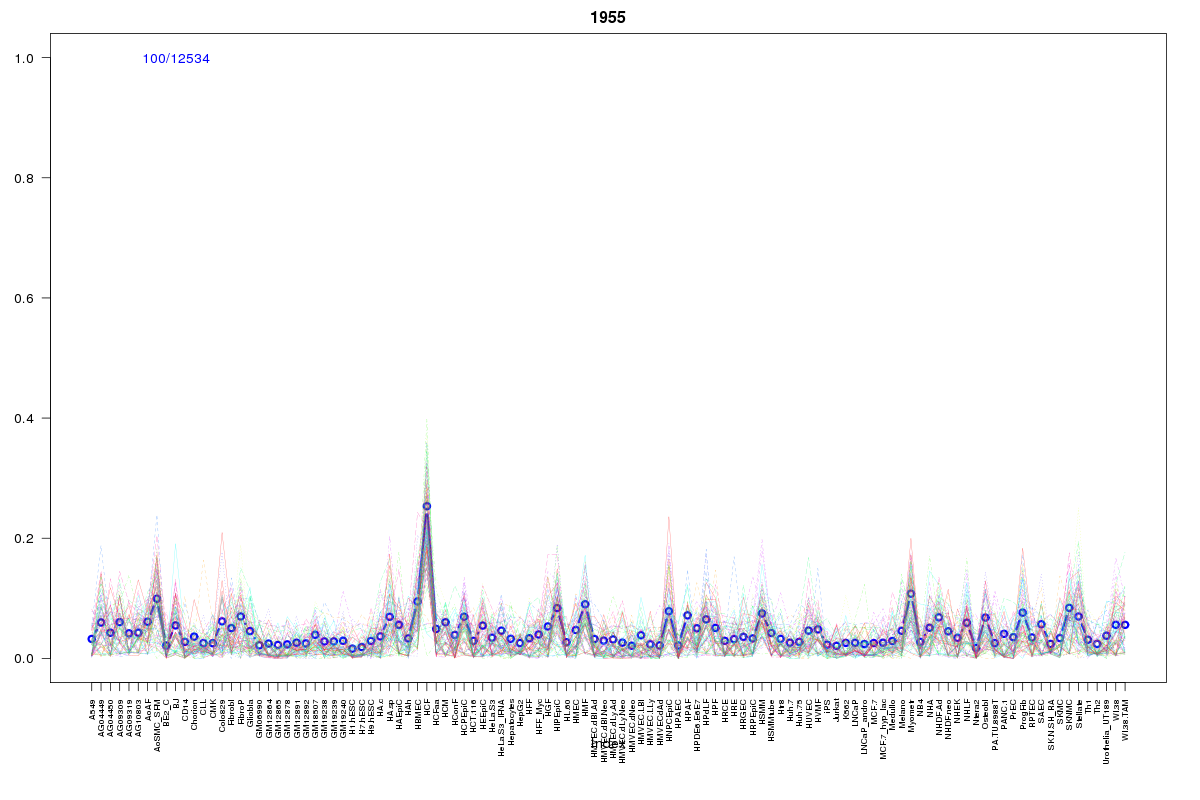 | 1955 | 3 |
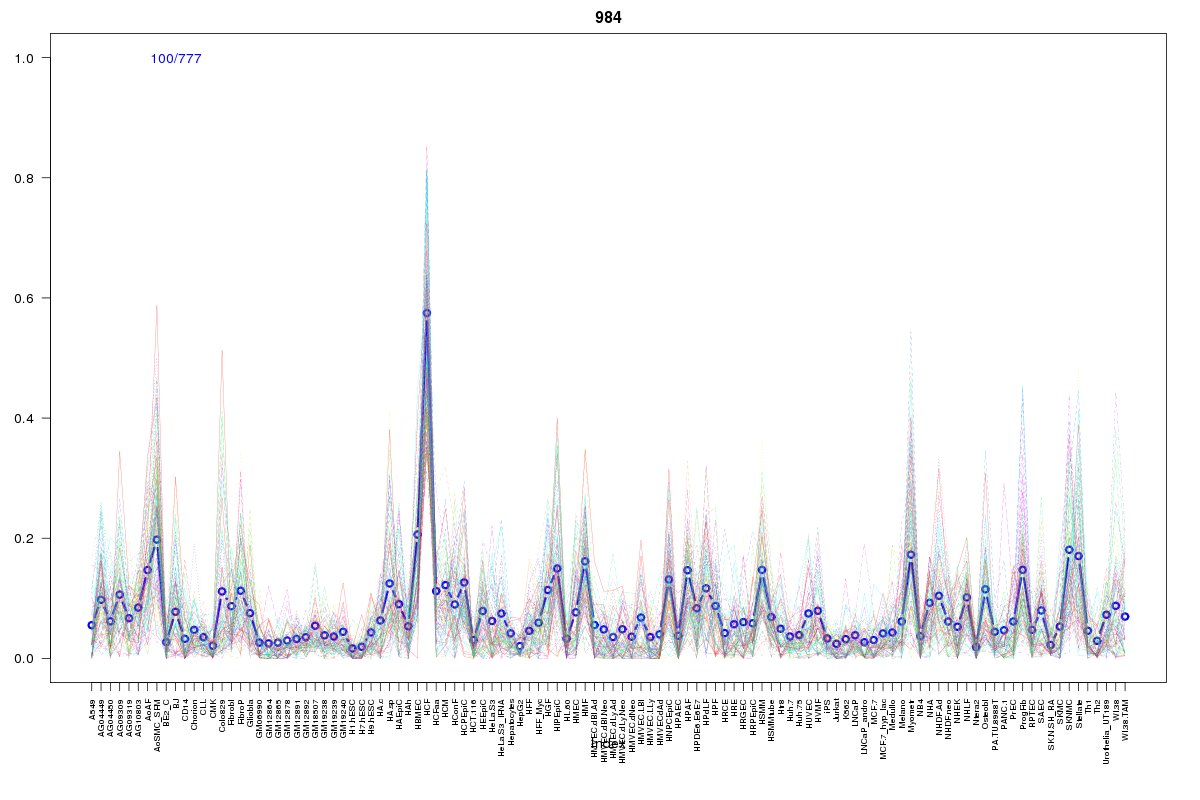 | 984 | 1 |
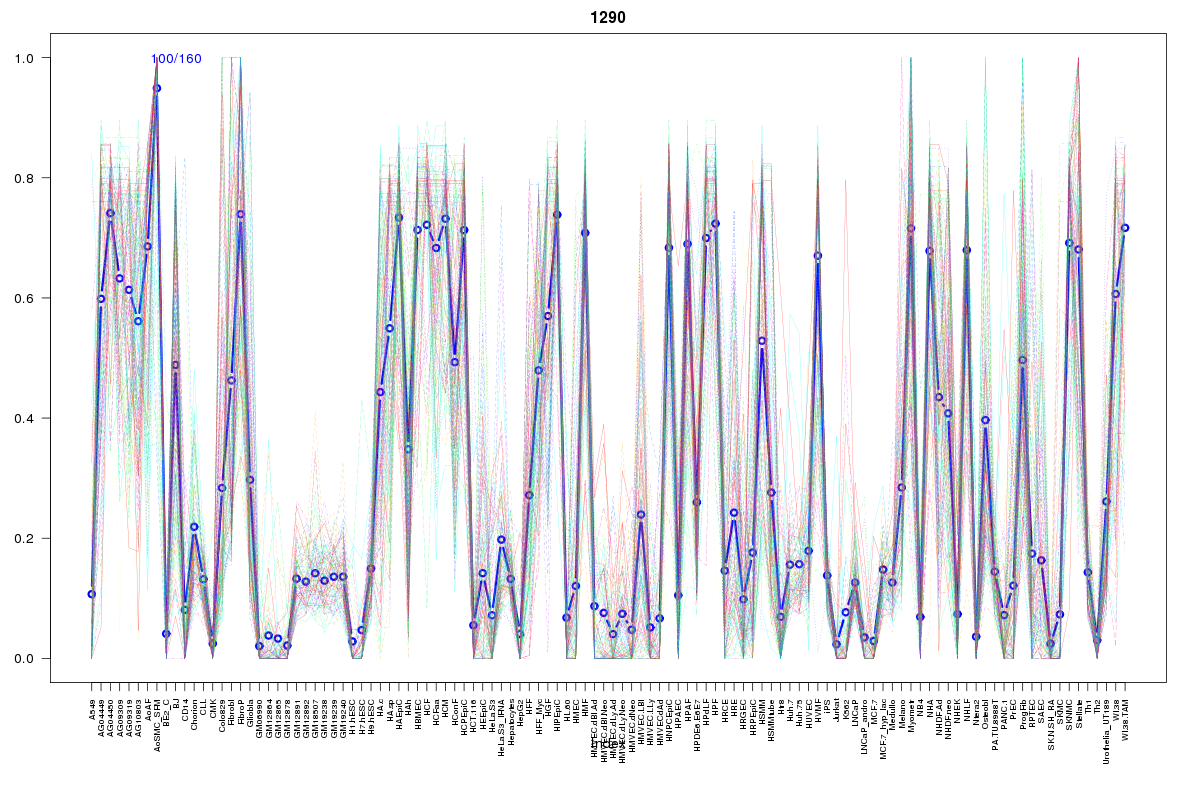 | 1290 | 1 |
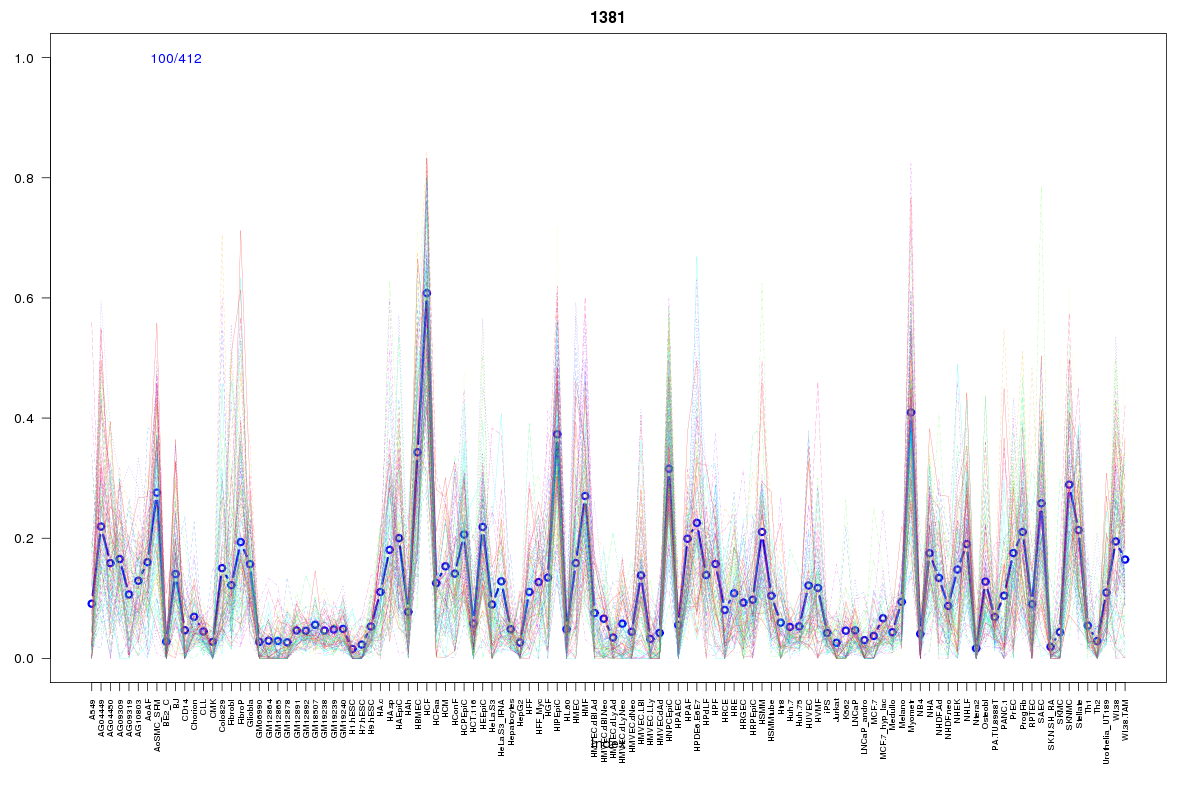 | 1381 | 1 |
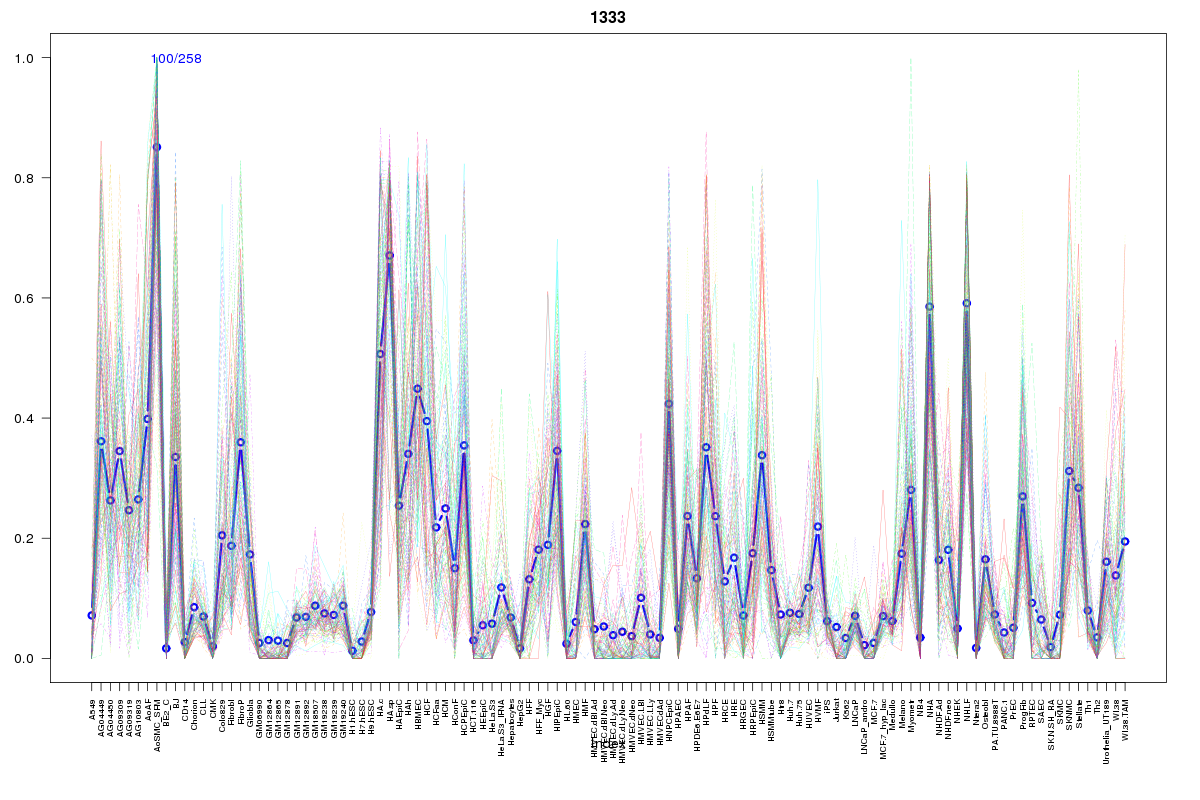 | 1333 | 1 |
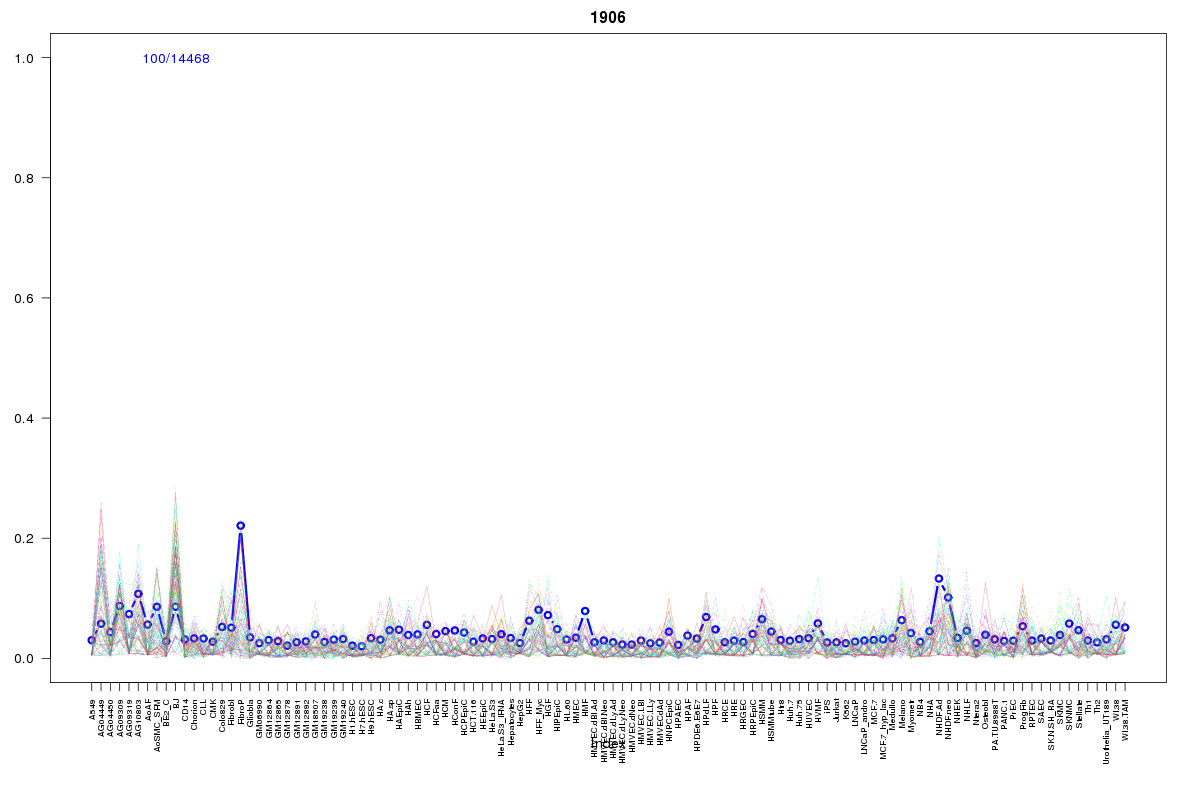 | 1906 | 1 |
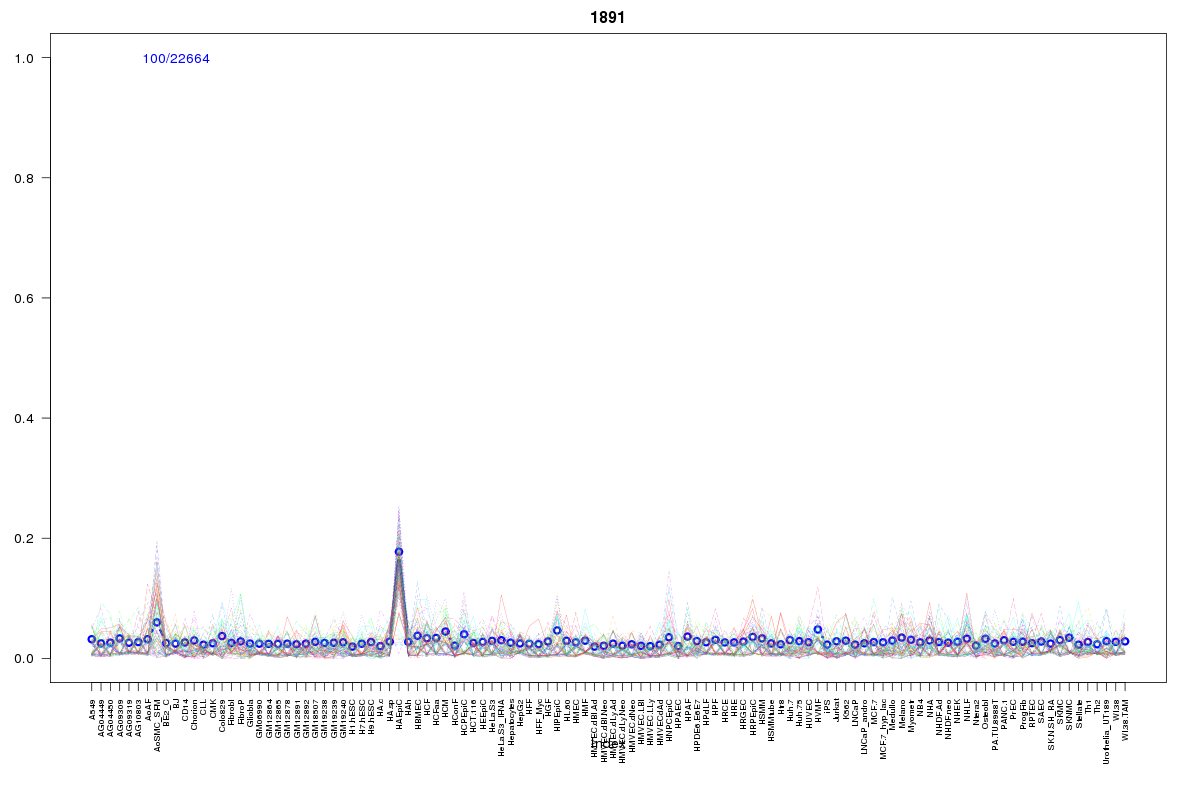 | 1891 | 1 |
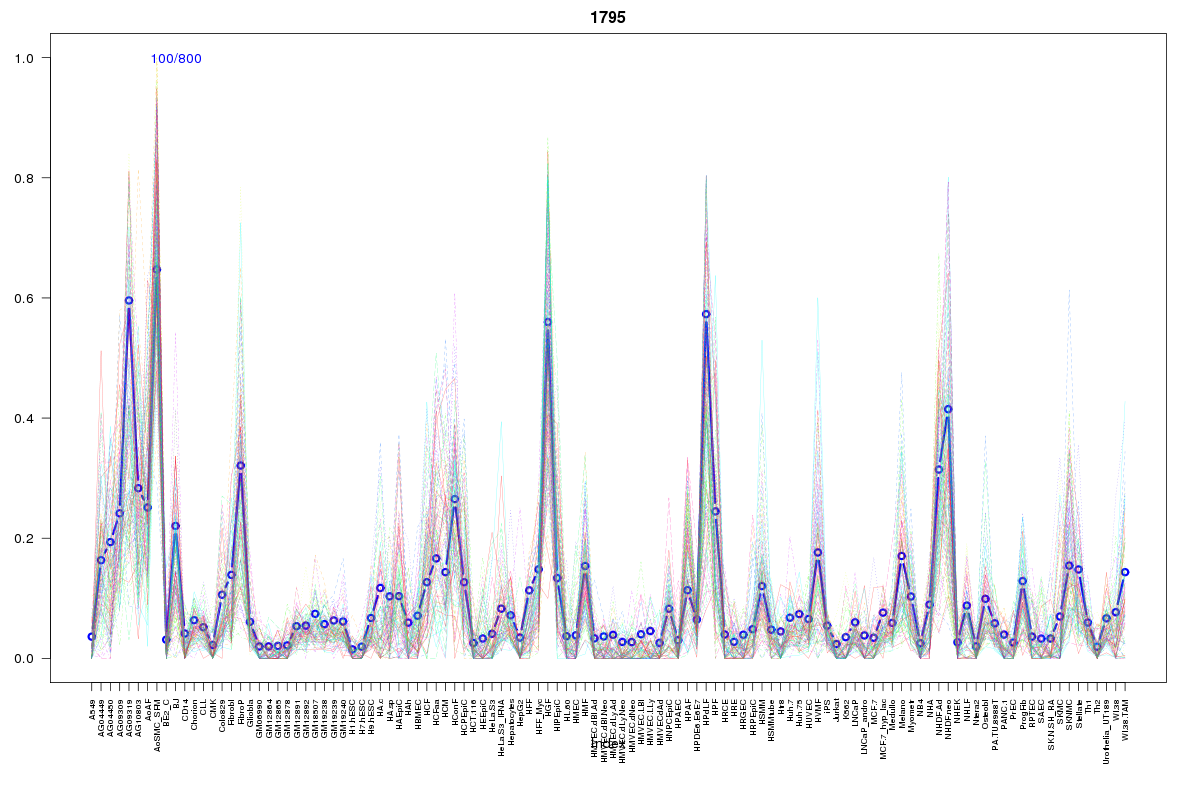 | 1795 | 1 |
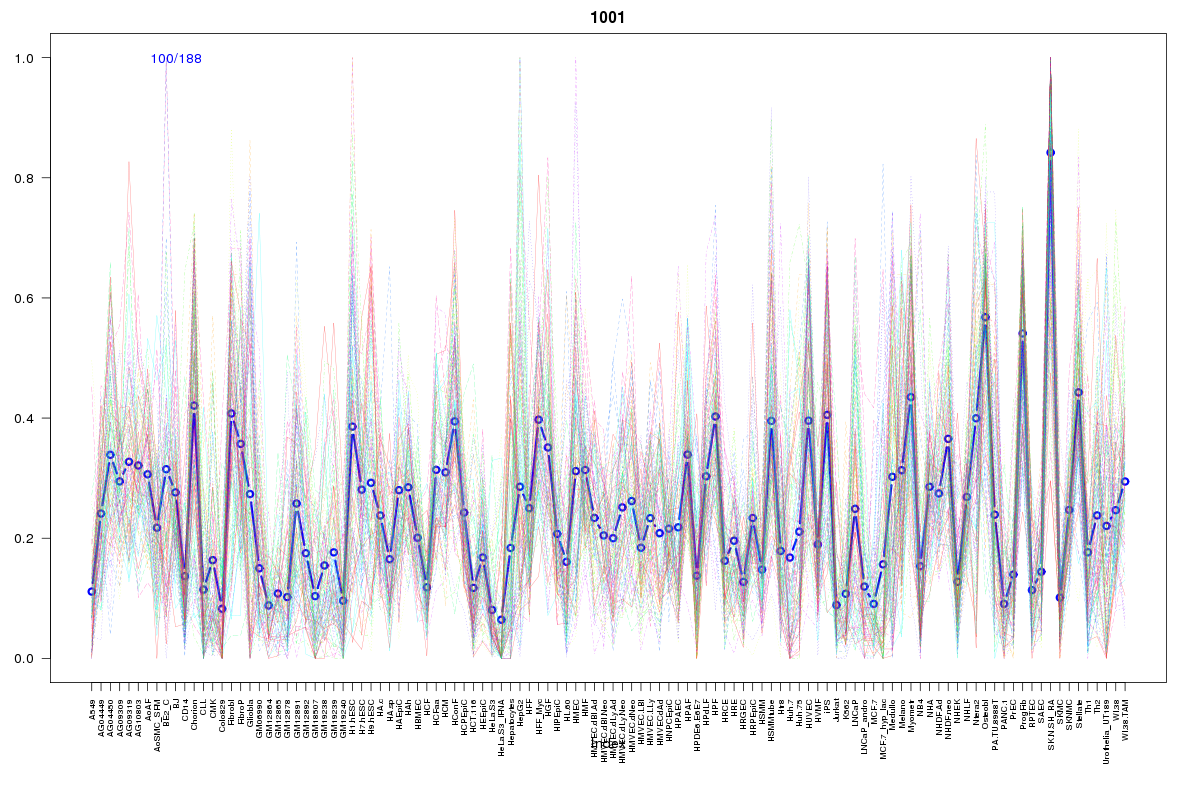 | 1001 | 1 |
 | 927 | 1 |
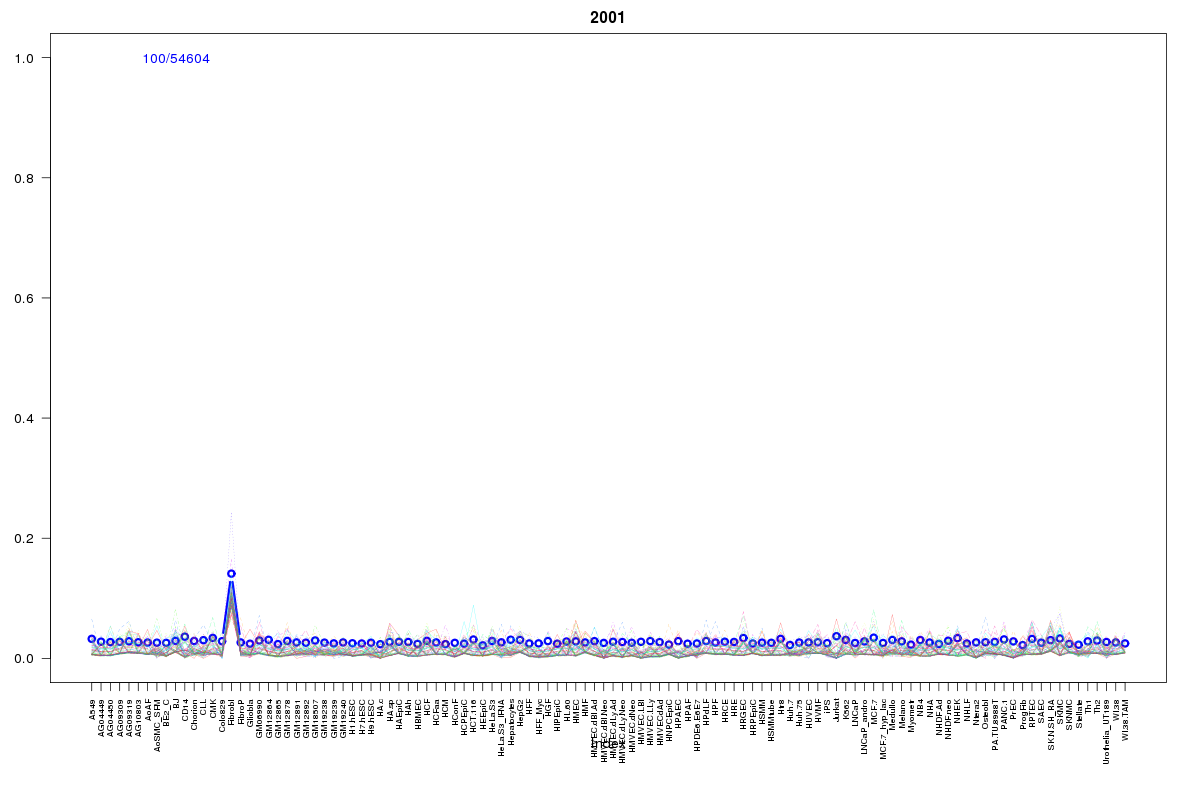 | 2001 | 1 |
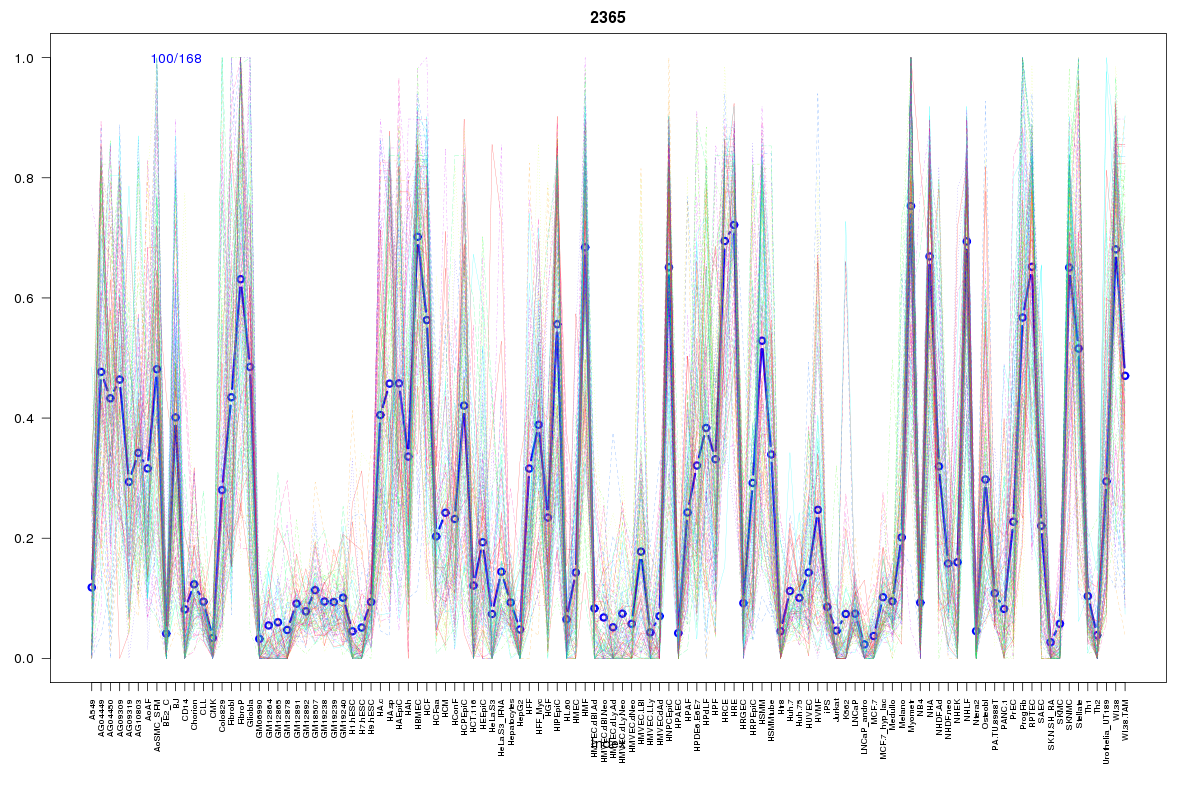 | 2365 | 1 |
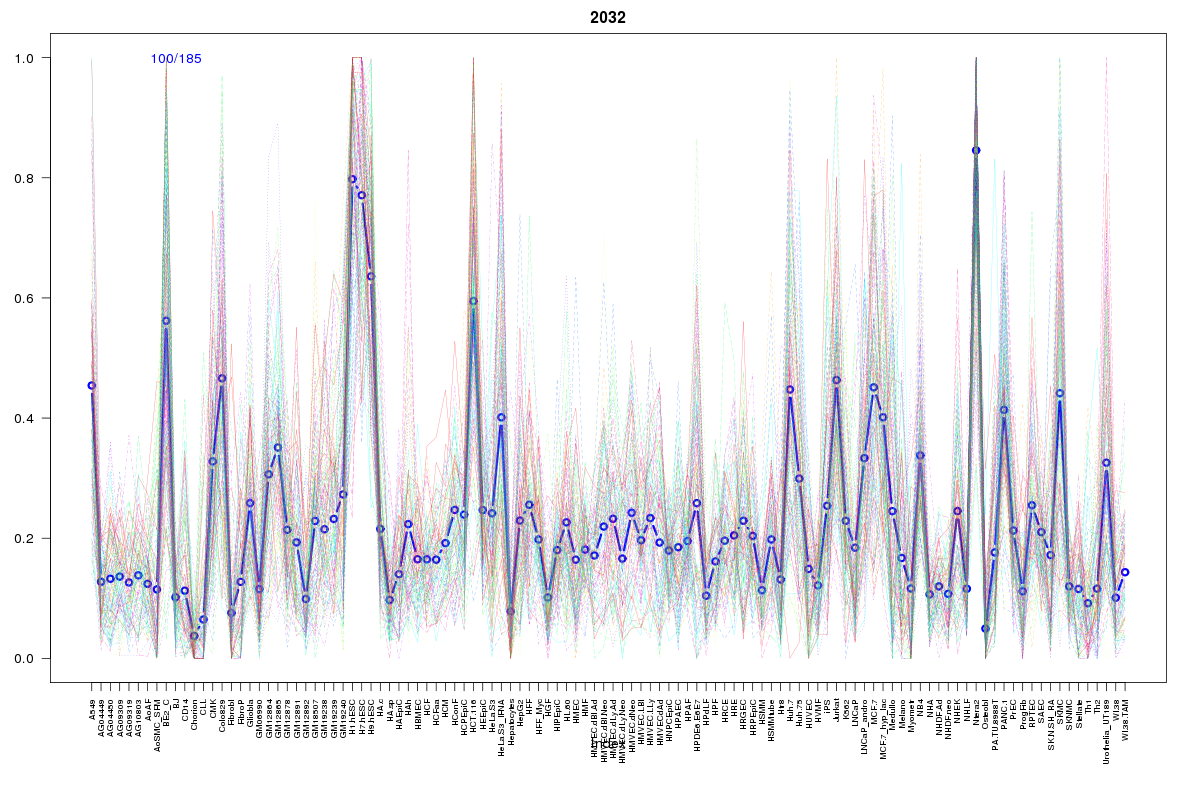 | 2032 | 1 |
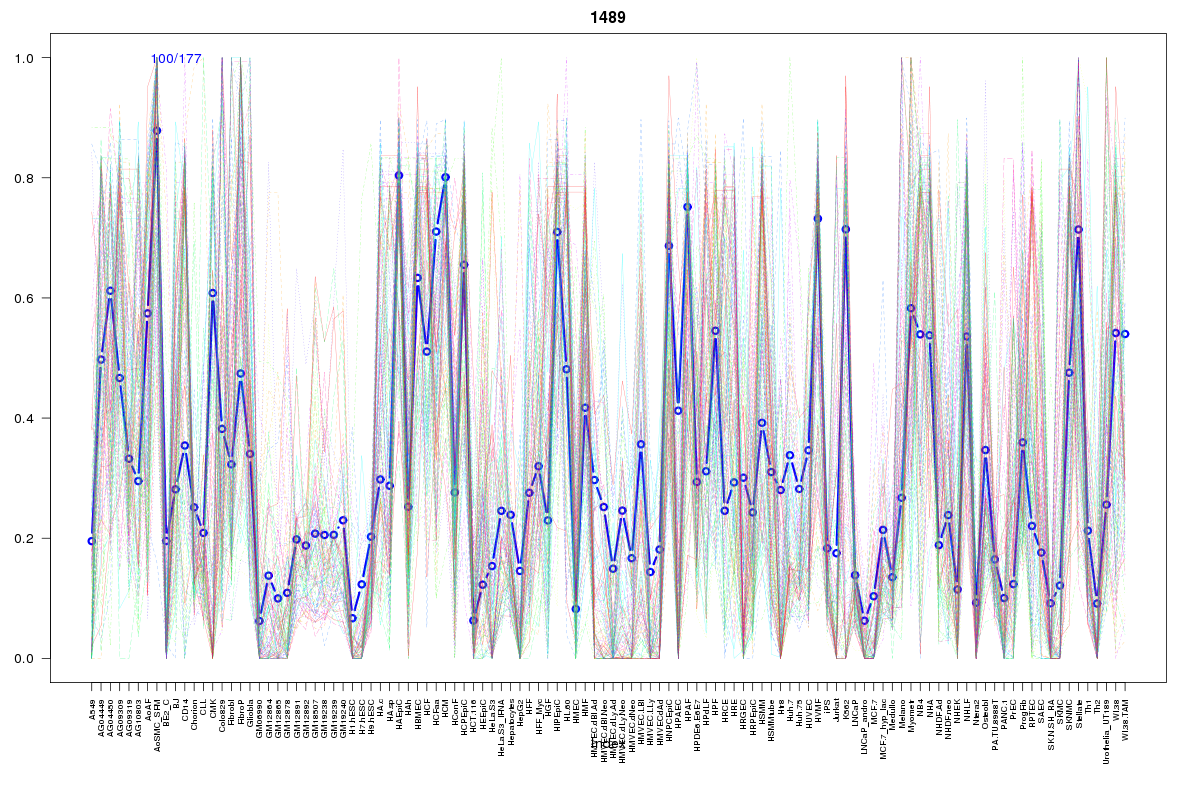 | 1489 | 1 |
Resources
BED file downloads
Connects to 16 DHS sitesTop 10 Correlated DHS Sites
p-values indiciate significant higher or lower correlation| Location | Cluster | P-value |
|---|---|---|
| chr3:148413800-148413950 | 1955 | 0 |
| chr3:148441480-148441630 | 2365 | 0.002 |
| chr3:148415220-148415370 | 1795 | 0.002 |
| chr3:148412080-148412230 | 1891 | 0.002 |
| chr3:148322600-148322750 | 984 | 0.003 |
| chr3:148415545-148415695 | 1001 | 0.003 |
| chr3:148369440-148369590 | 1906 | 0.005 |
| chr3:148428100-148428250 | 2001 | 0.005 |
| chr3:148475440-148475590 | 1489 | 0.007 |
| chr3:148361420-148361570 | 1290 | 0.007 |
| chr3:148366860-148367010 | 1333 | 0.007 |
External Databases
UCSCEnsembl (ENSG00000144891)