Gene: SKA3
chr13: 21727733-21750741Expression Profile
(log scale)
Graphical Connections
Distribution of linked clusters:
You may find it interesting if many of the connected DHS sites belong to the same cluster.| Cluster Profile | Cluster ID | Number of DHS sites in this cluster |
|---|---|---|
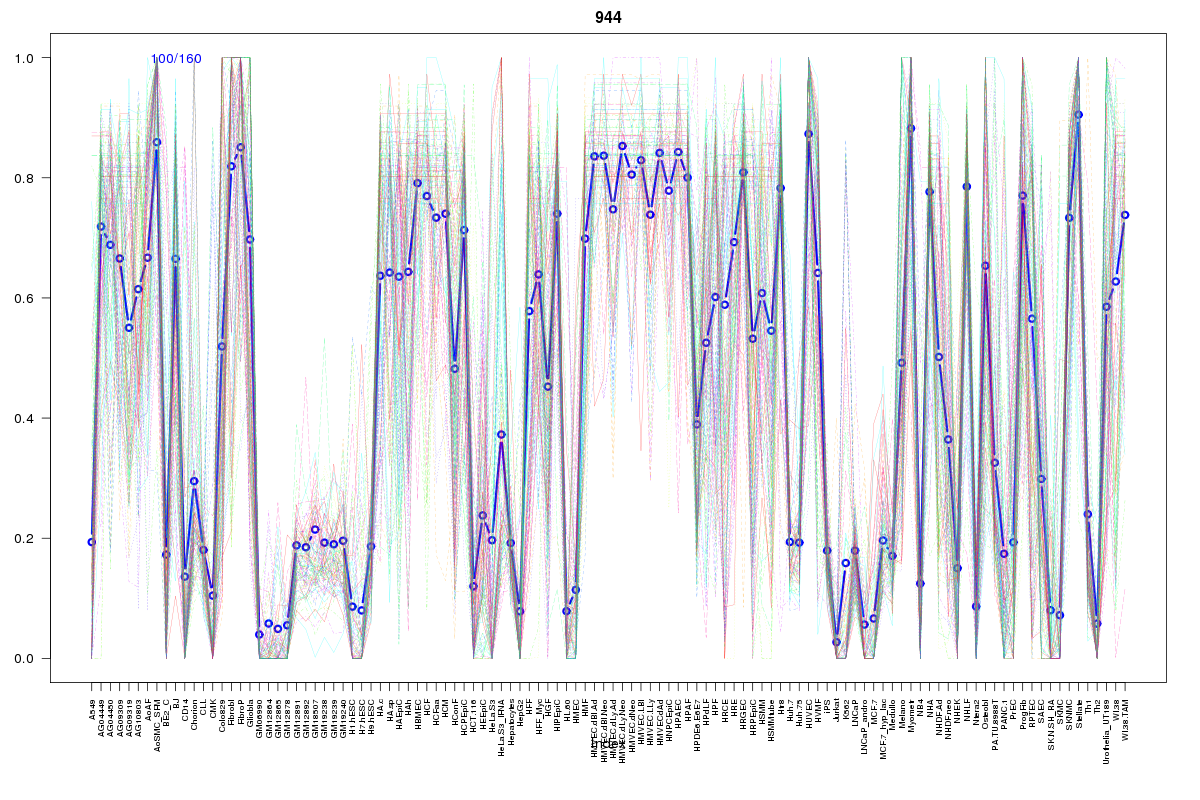 | 944 | 2 |
 | 2063 | 2 |
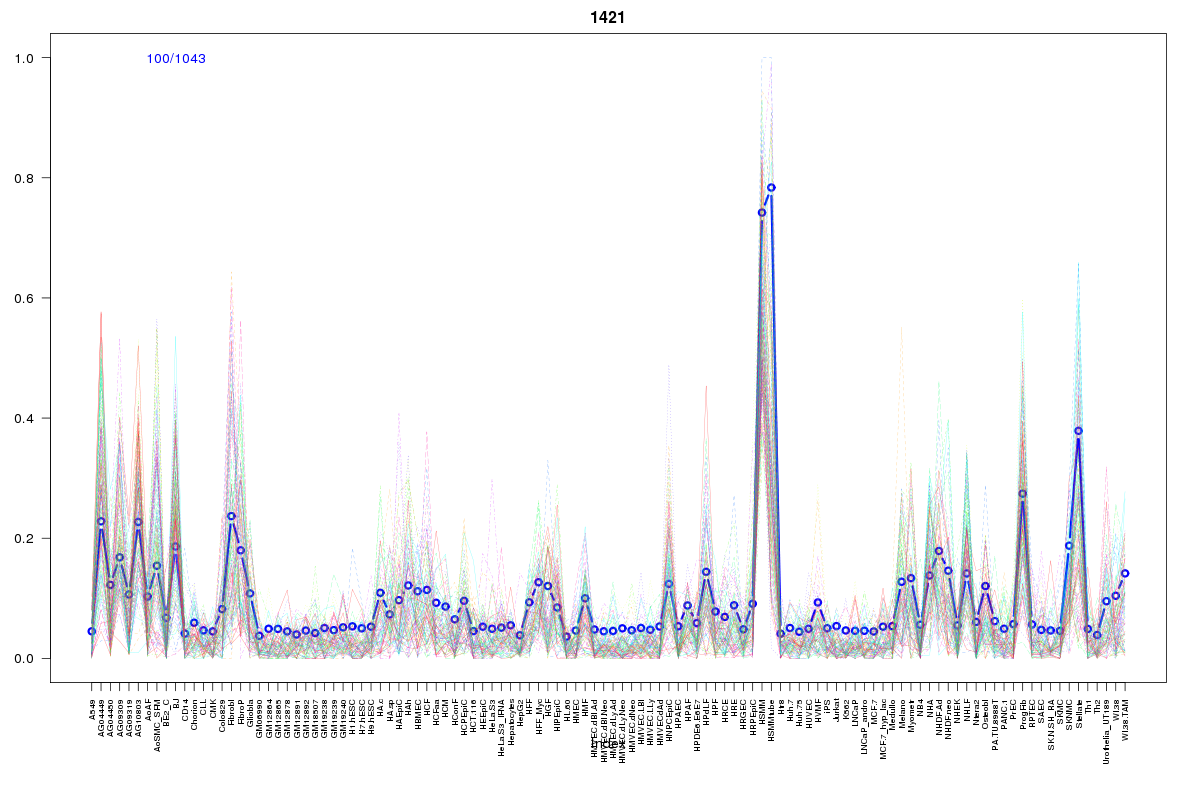 | 1421 | 1 |
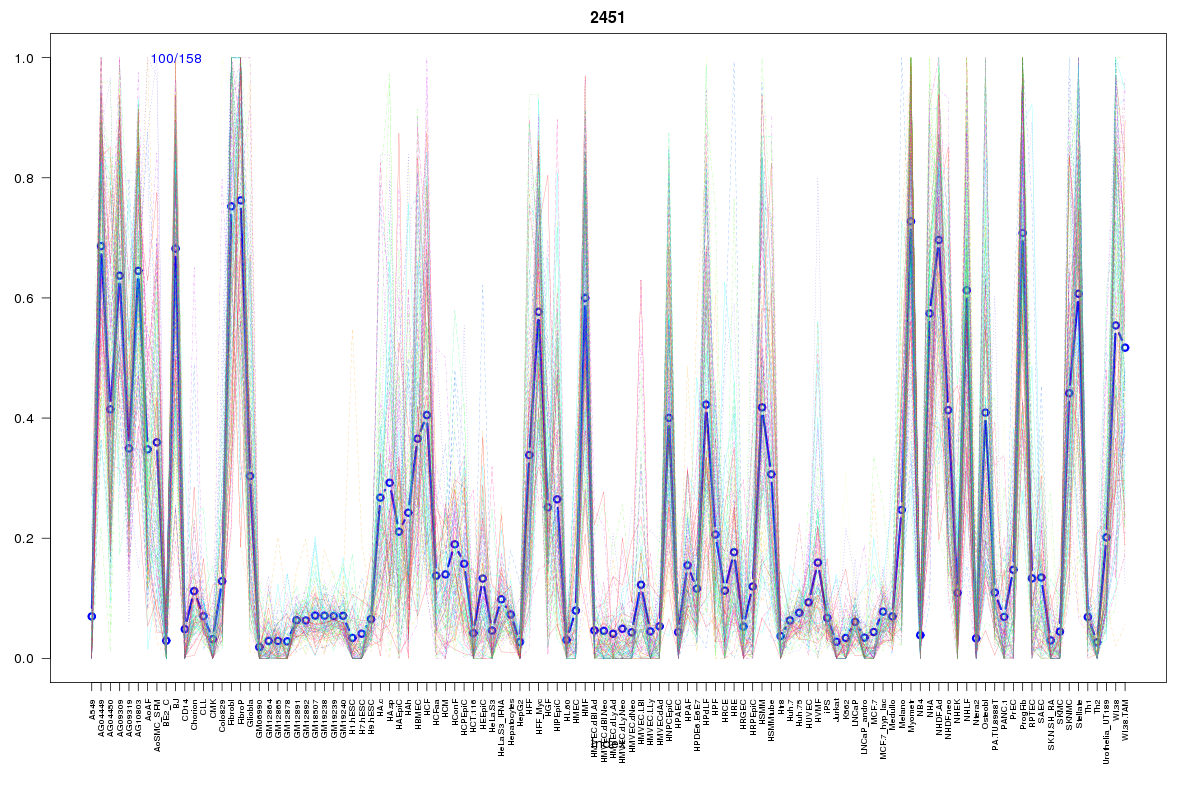 | 2451 | 1 |
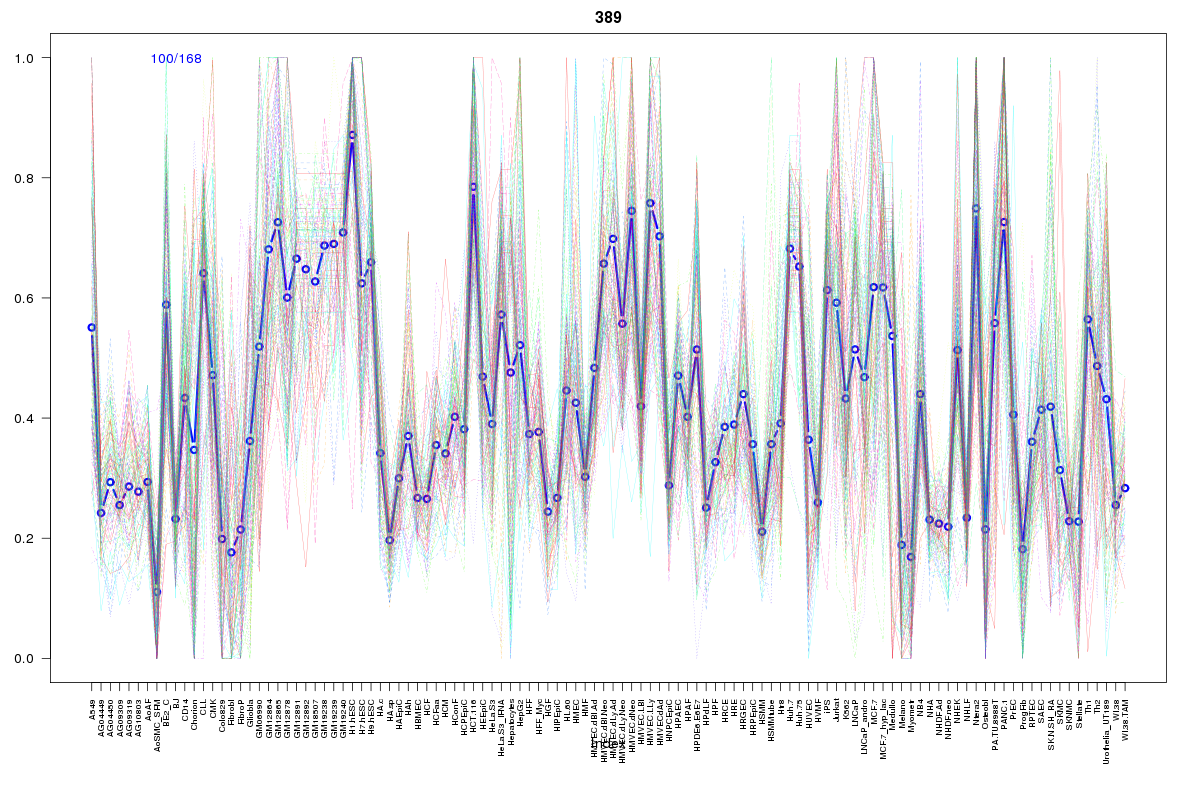 | 389 | 1 |
 | 2075 | 1 |
 | 434 | 1 |
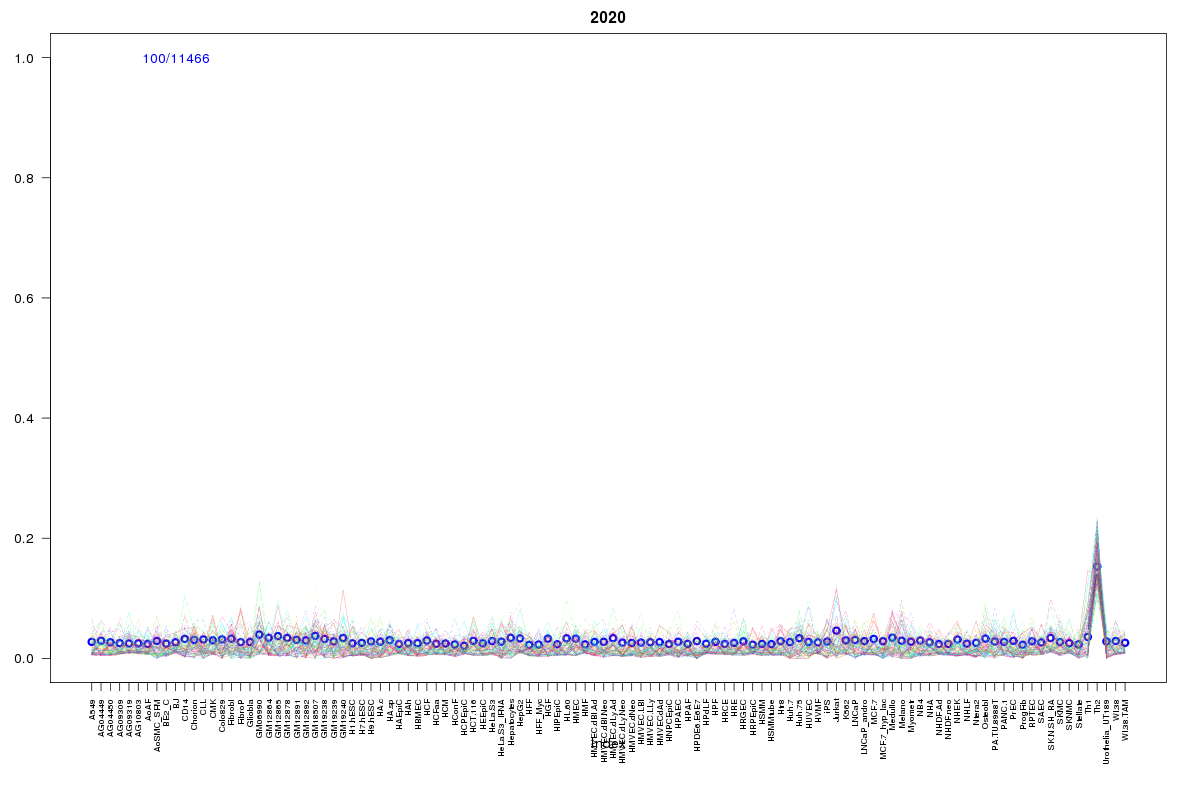 | 2020 | 1 |
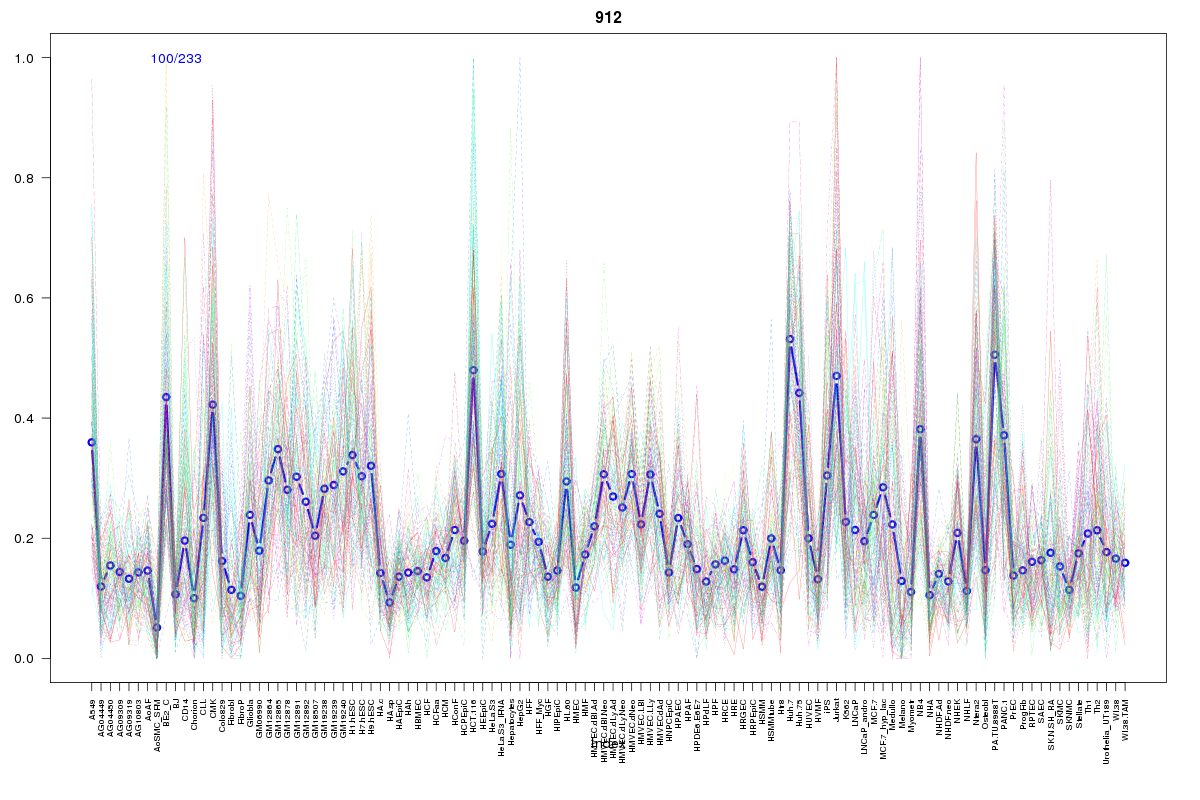 | 912 | 1 |
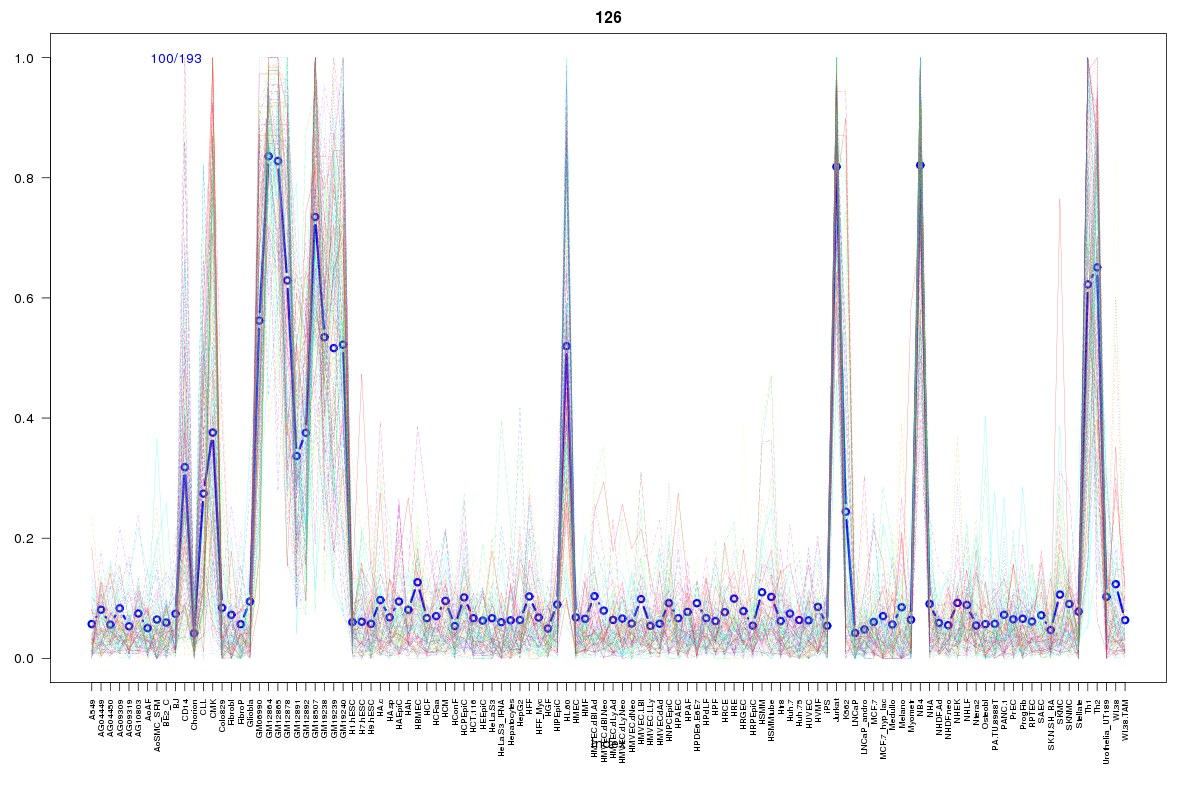 | 126 | 1 |
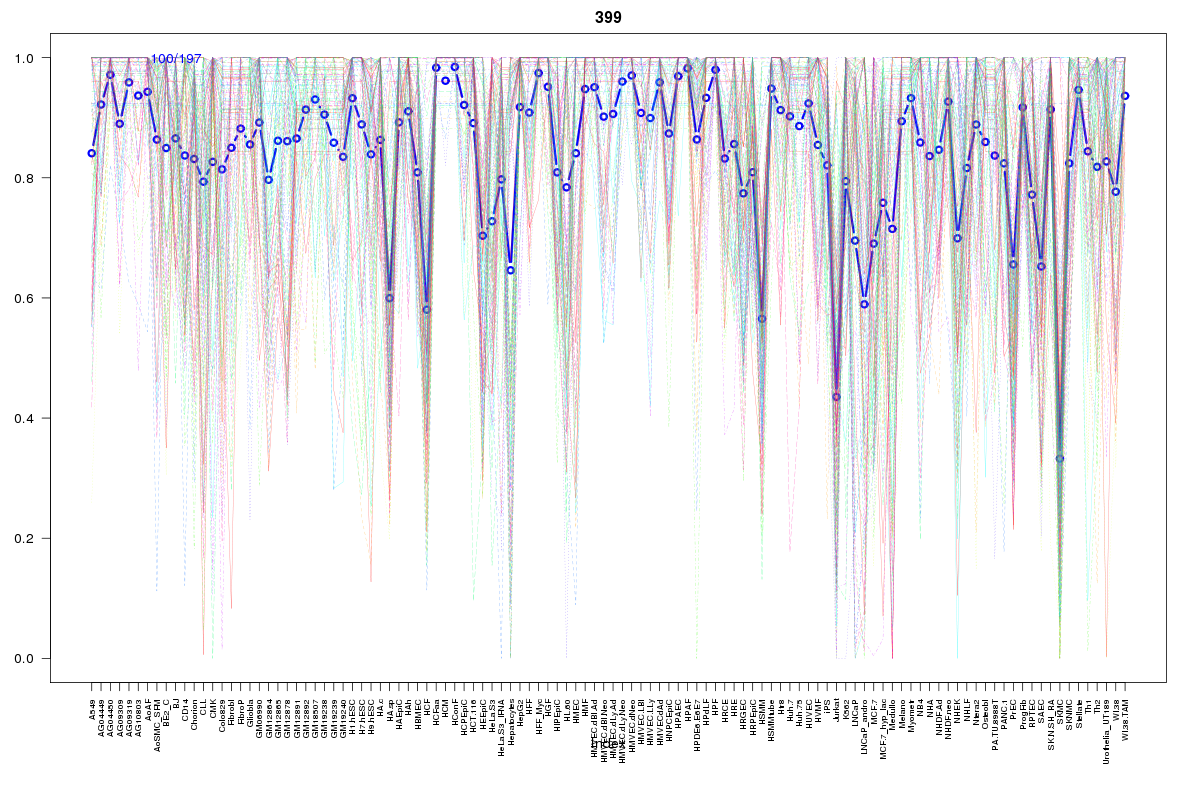 | 399 | 1 |
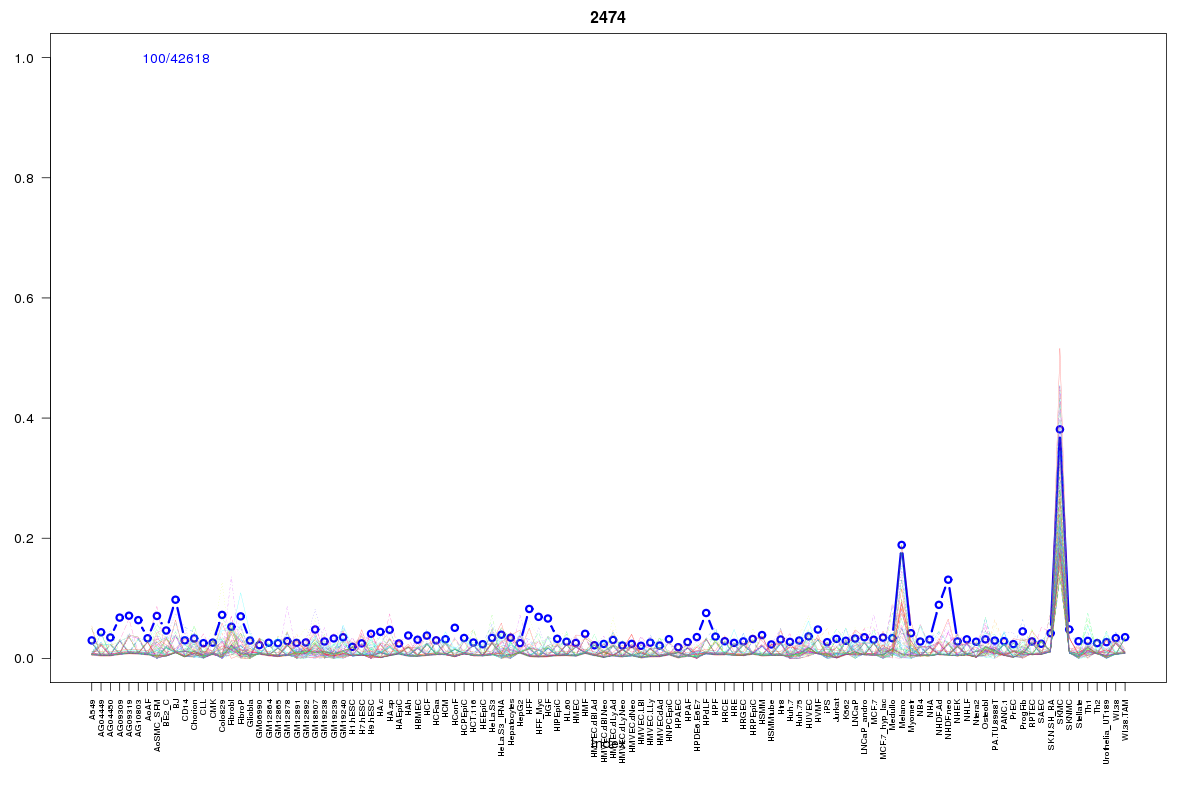 | 2474 | 1 |
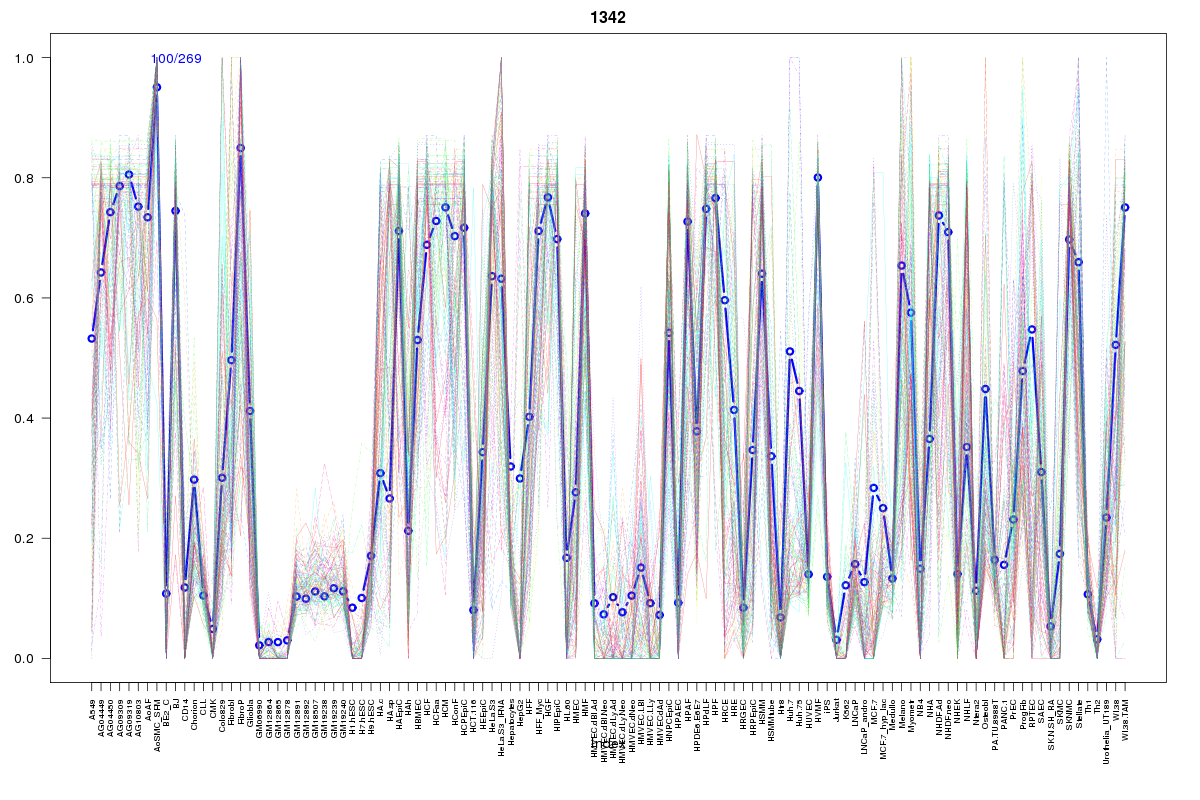 | 1342 | 1 |
 | 110 | 1 |
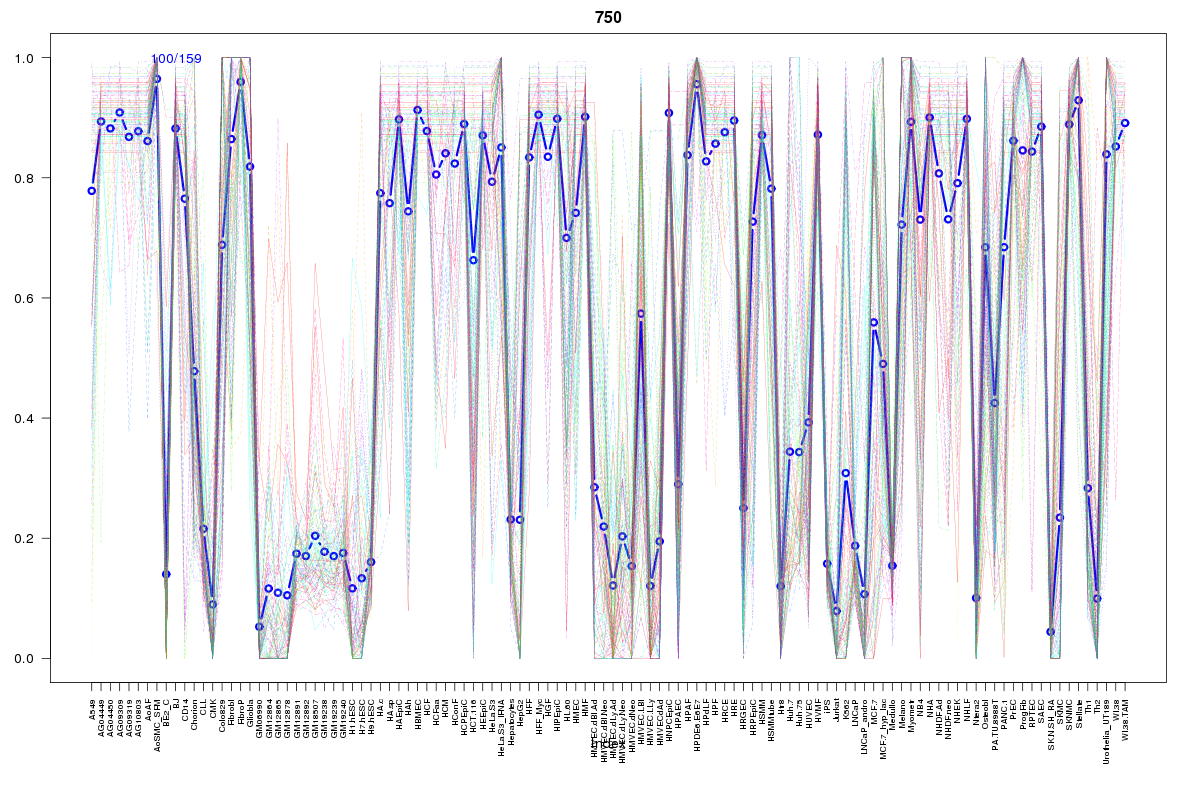 | 750 | 1 |
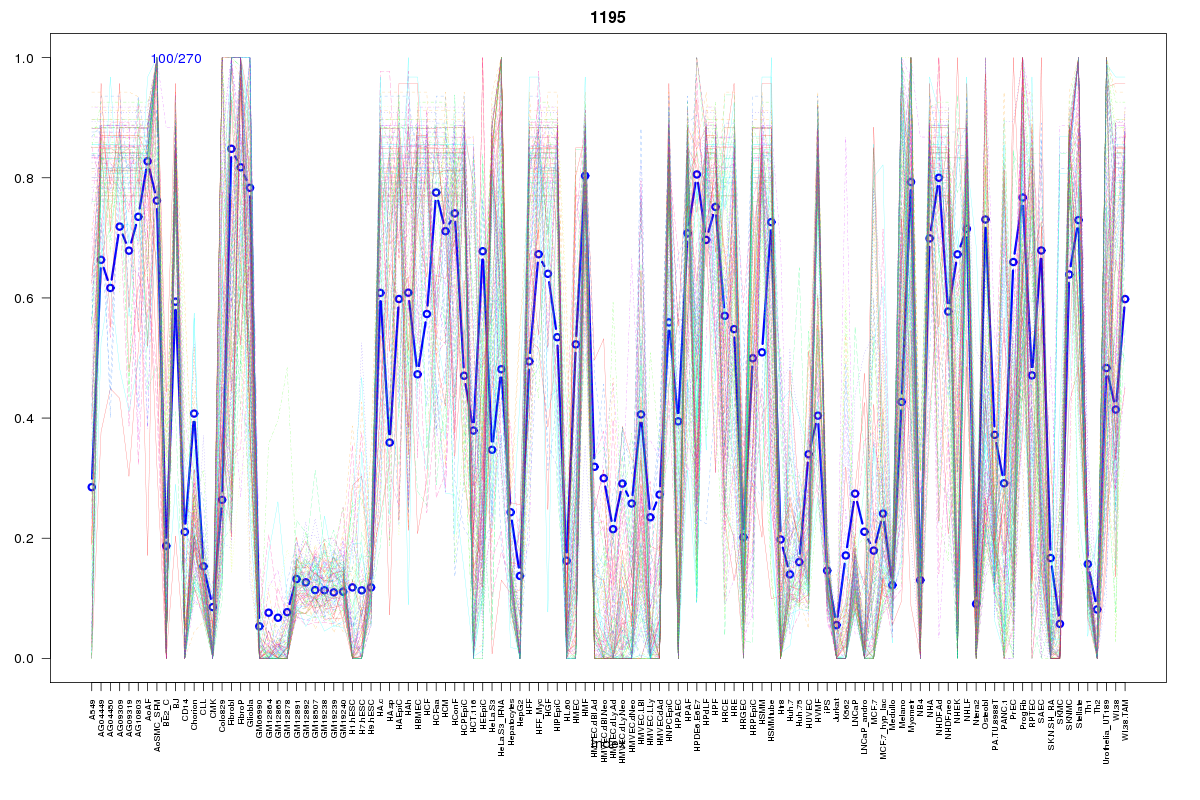 | 1195 | 1 |
 | 2114 | 1 |
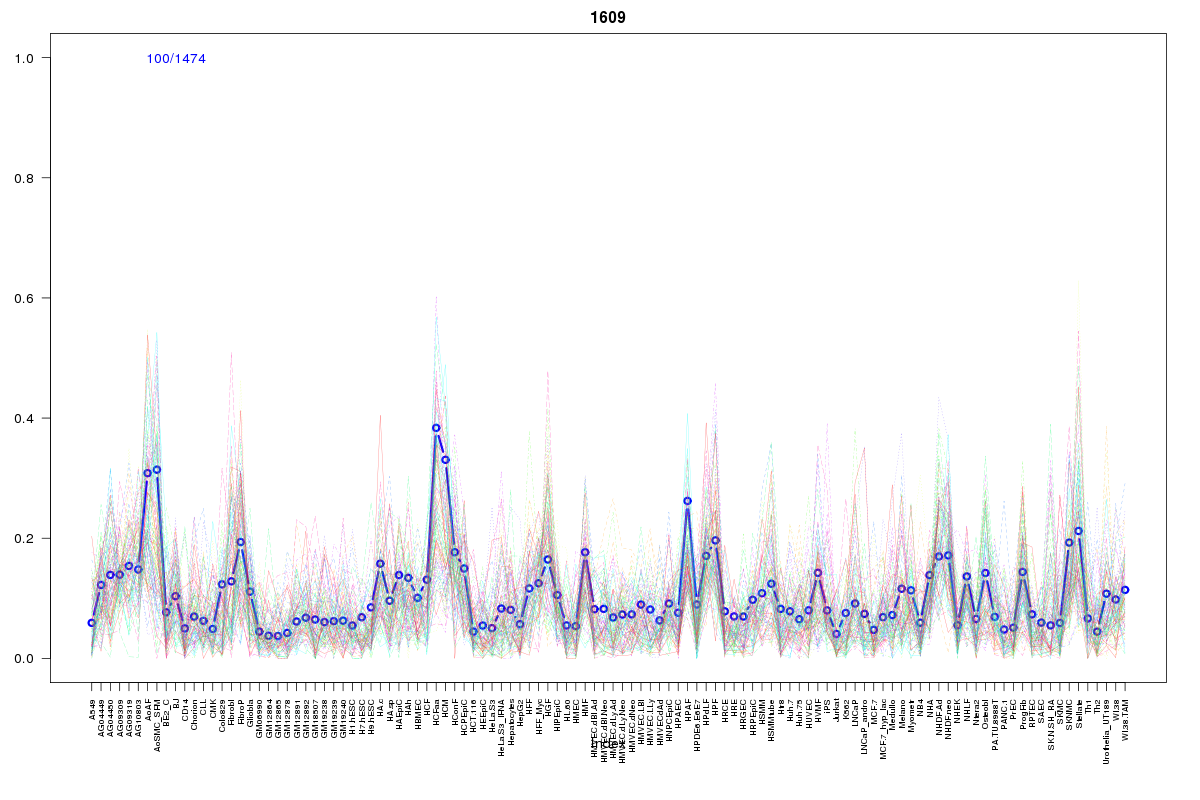 | 1609 | 1 |
Resources
BED file downloads
Connects to 20 DHS sitesTop 10 Correlated DHS Sites
p-values indiciate significant higher or lower correlation| Location | Cluster | P-value |
|---|---|---|
| chr13:21685040-21685190 | 389 | 0.003 |
| chr13:21755000-21755150 | 912 | 0.003 |
| chr13:21794260-21794410 | 2474 | 0.006 |
| chr13:21816460-21816610 | 110 | 0.006 |
| chr13:21793220-21793370 | 2063 | 0.007 |
| chr13:21714260-21714410 | 2075 | 0.007 |
| chr13:21792960-21793110 | 126 | 0.008 |
| chr13:21645880-21646030 | 2114 | 0.009 |
| chr13:21792785-21792935 | 2063 | 0.018 |
| chr13:21754640-21754790 | 2020 | 0.019 |
| chr13:21750360-21750510 | 434 | 0.02 |
External Databases
UCSCEnsembl (ENSG00000165480)