Gene: TMIE
chr3: 46742822-46752376Expression Profile
(log scale)
Graphical Connections
Distribution of linked clusters:
You may find it interesting if many of the connected DHS sites belong to the same cluster.| Cluster Profile | Cluster ID | Number of DHS sites in this cluster |
|---|---|---|
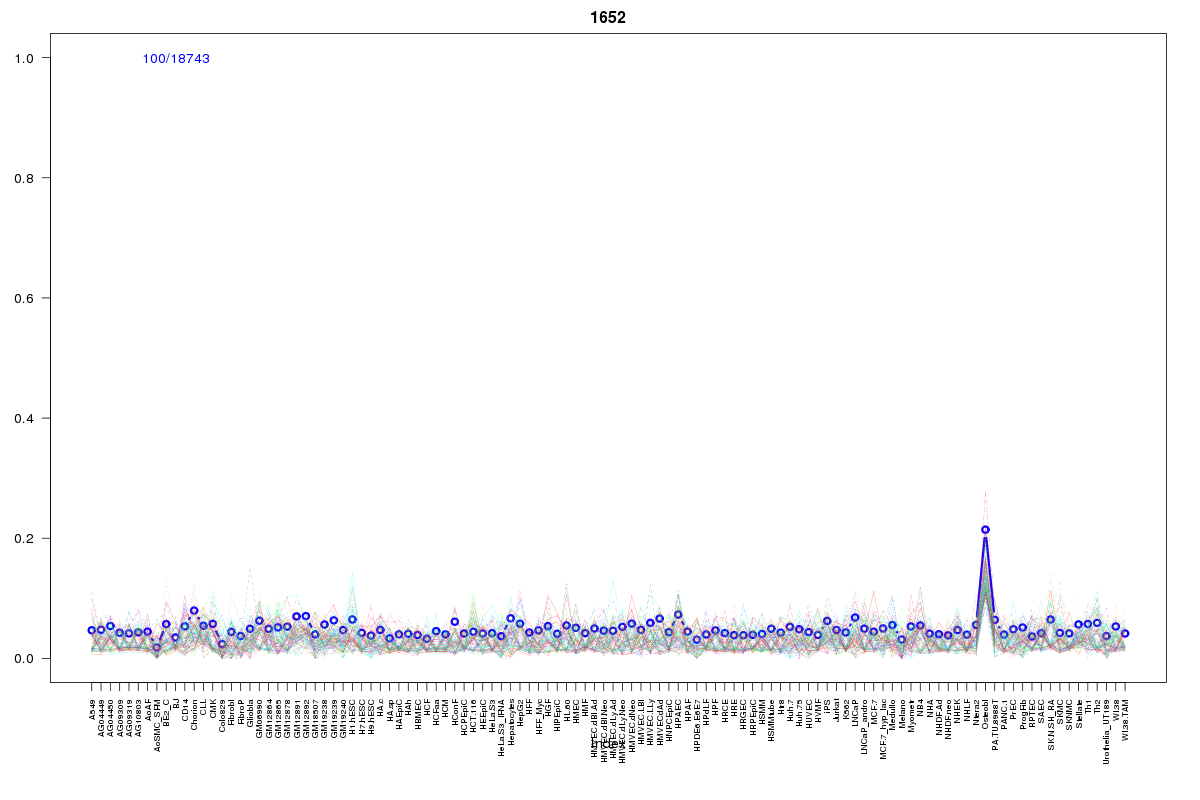 | 1652 | 1 |
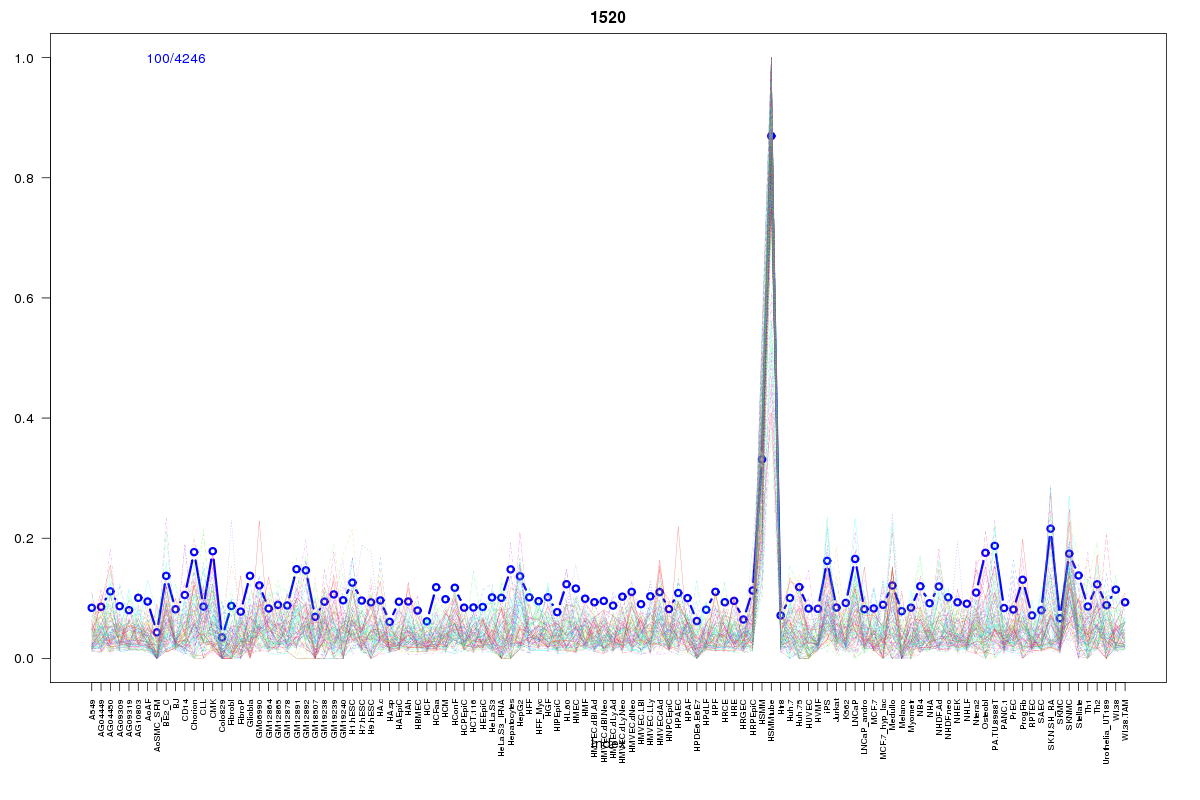 | 1520 | 1 |
 | 994 | 1 |
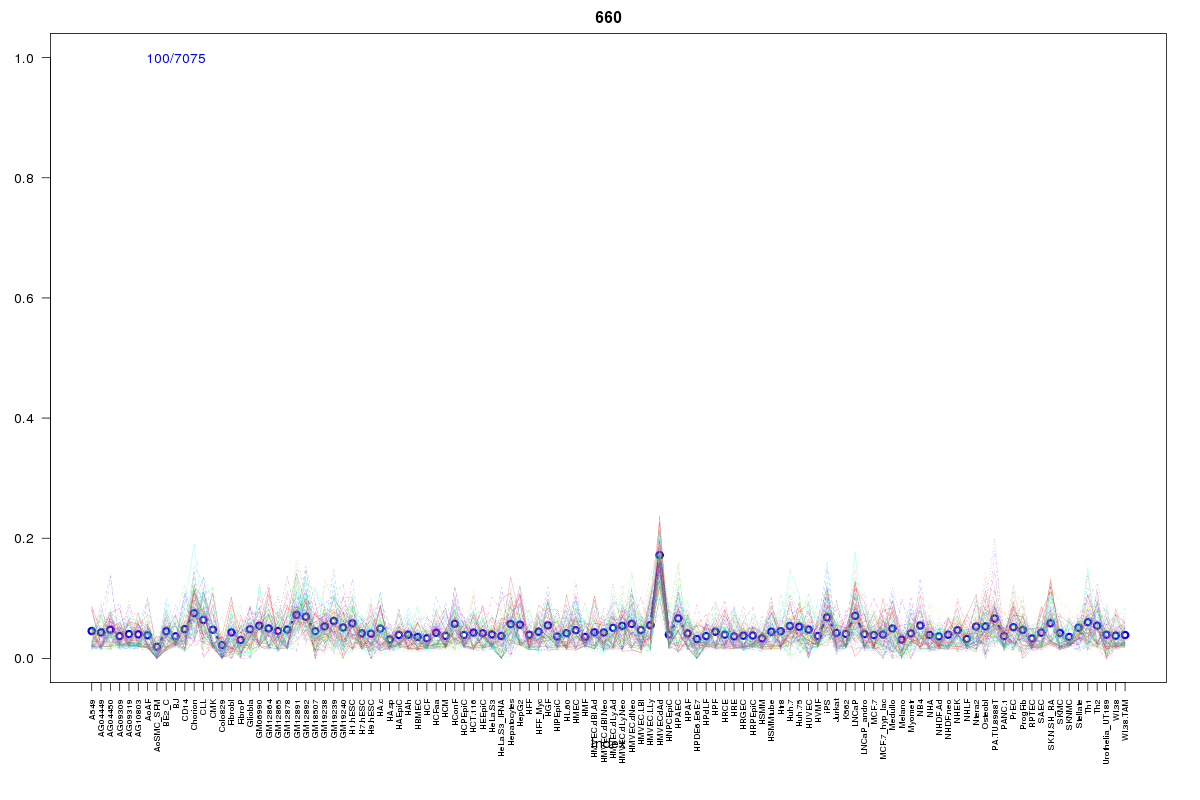 | 660 | 1 |
 | 881 | 1 |
 | 927 | 1 |
 | 15 | 1 |
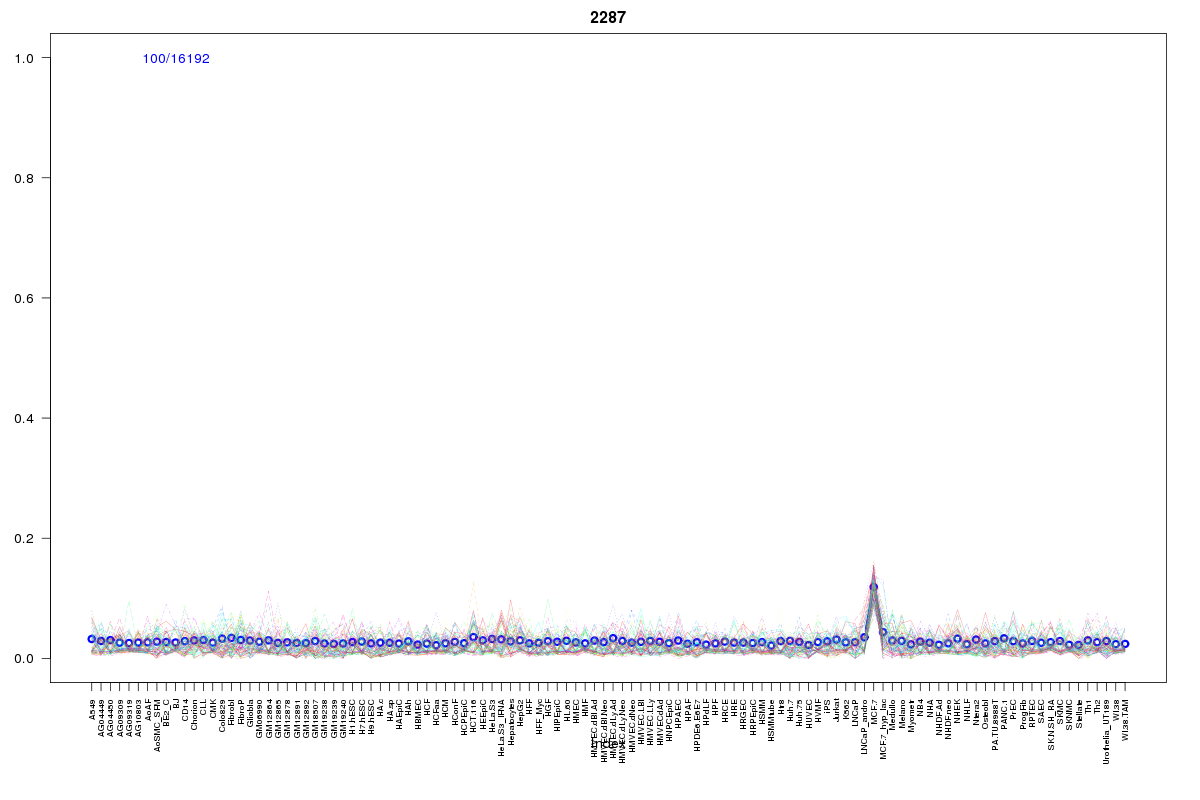 | 2287 | 1 |
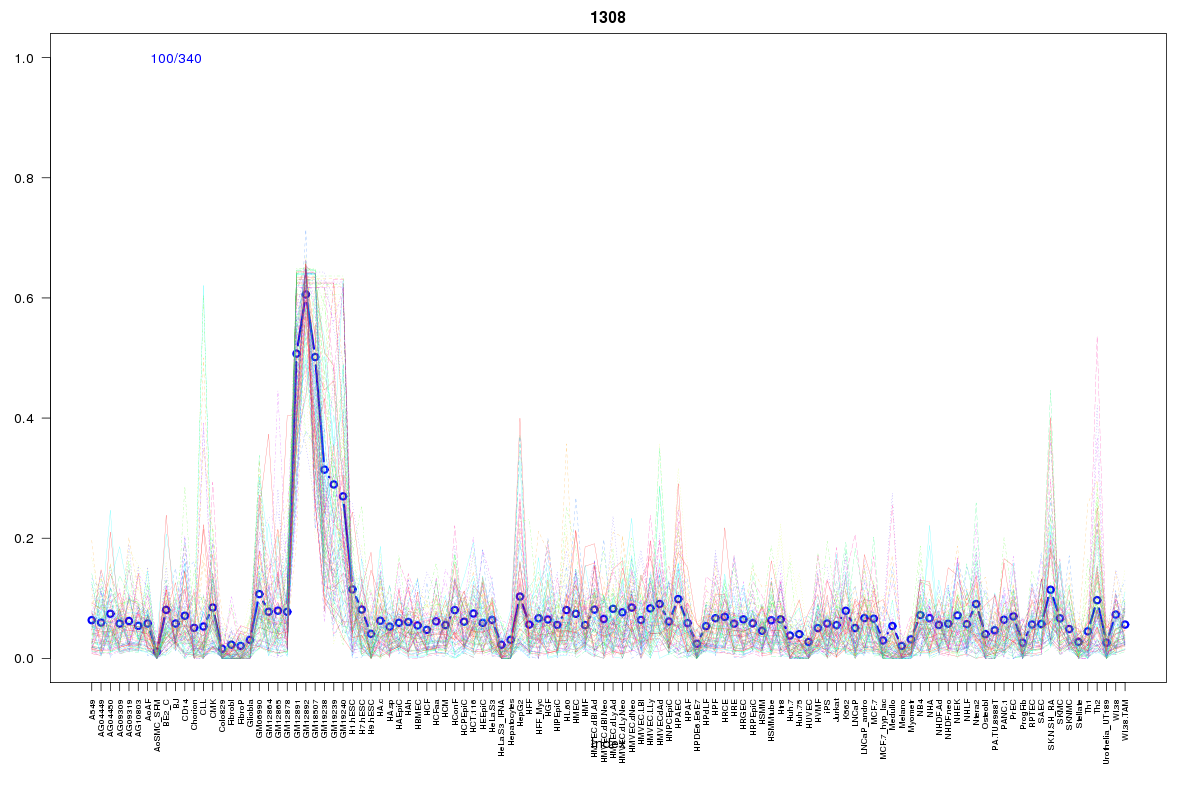 | 1308 | 1 |
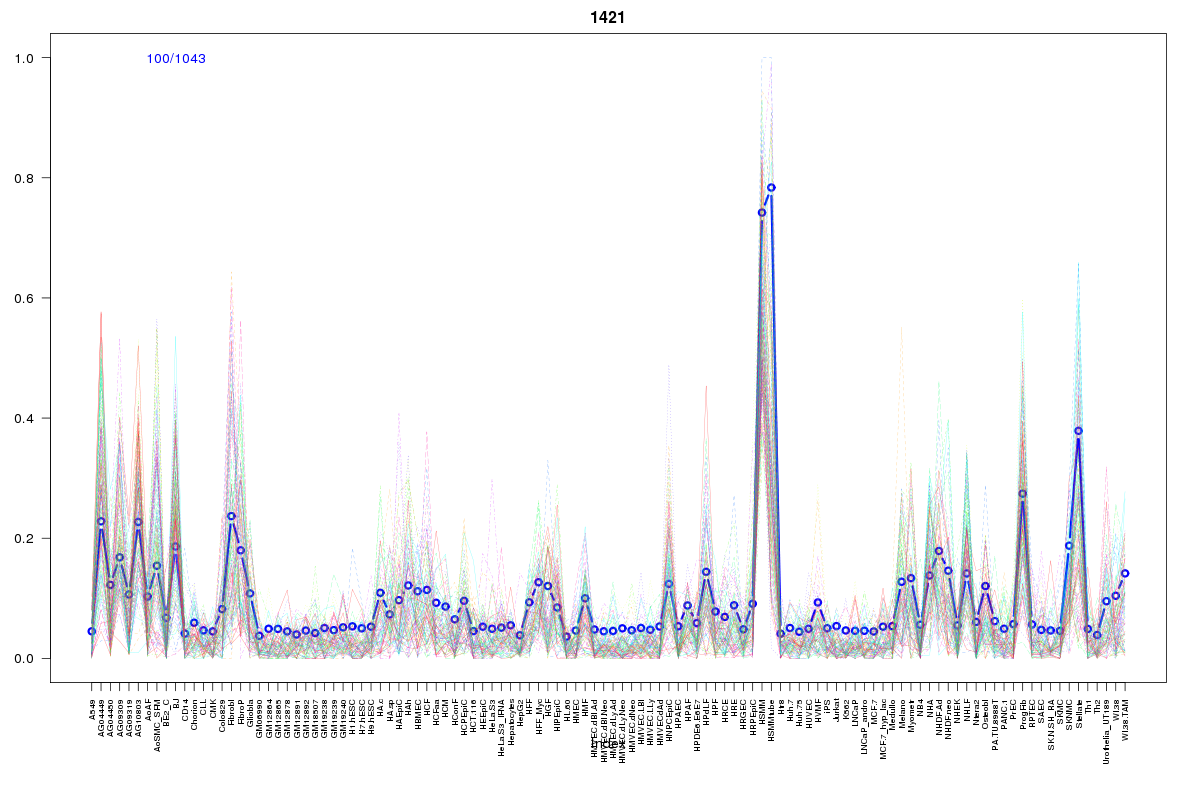 | 1421 | 1 |
 | 2055 | 1 |
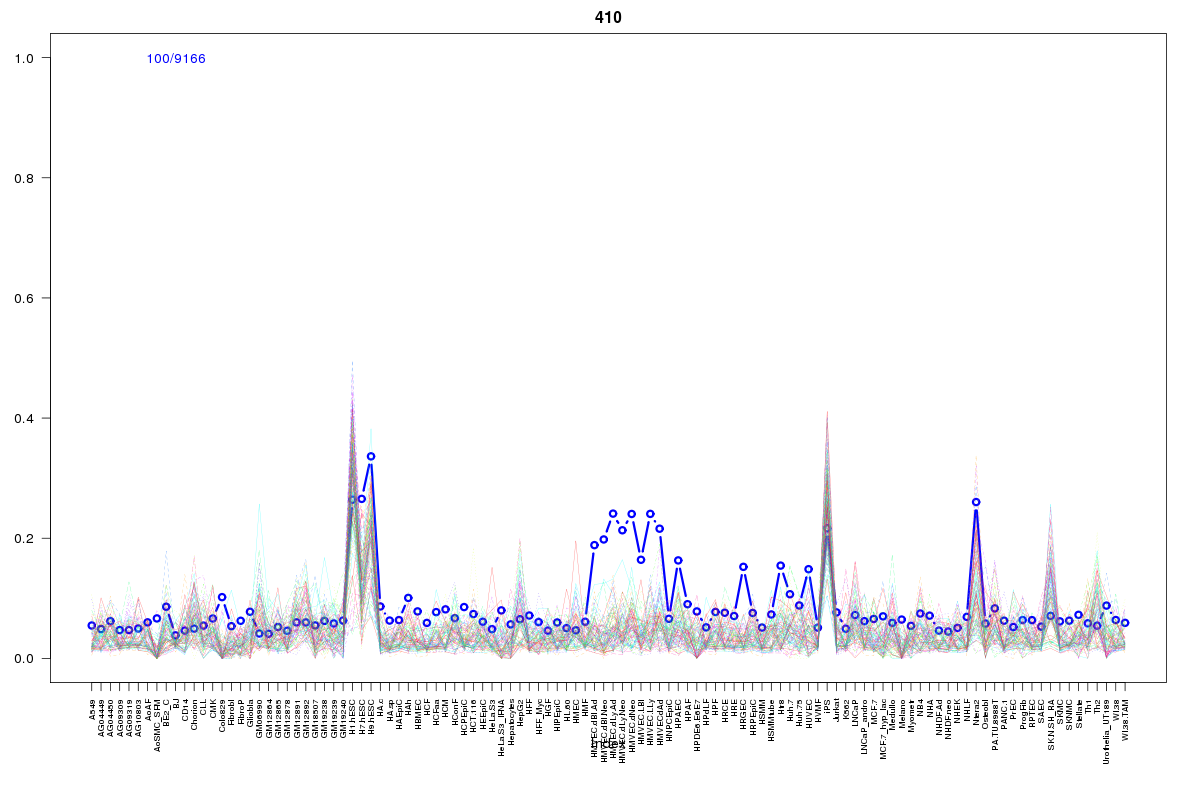 | 410 | 1 |
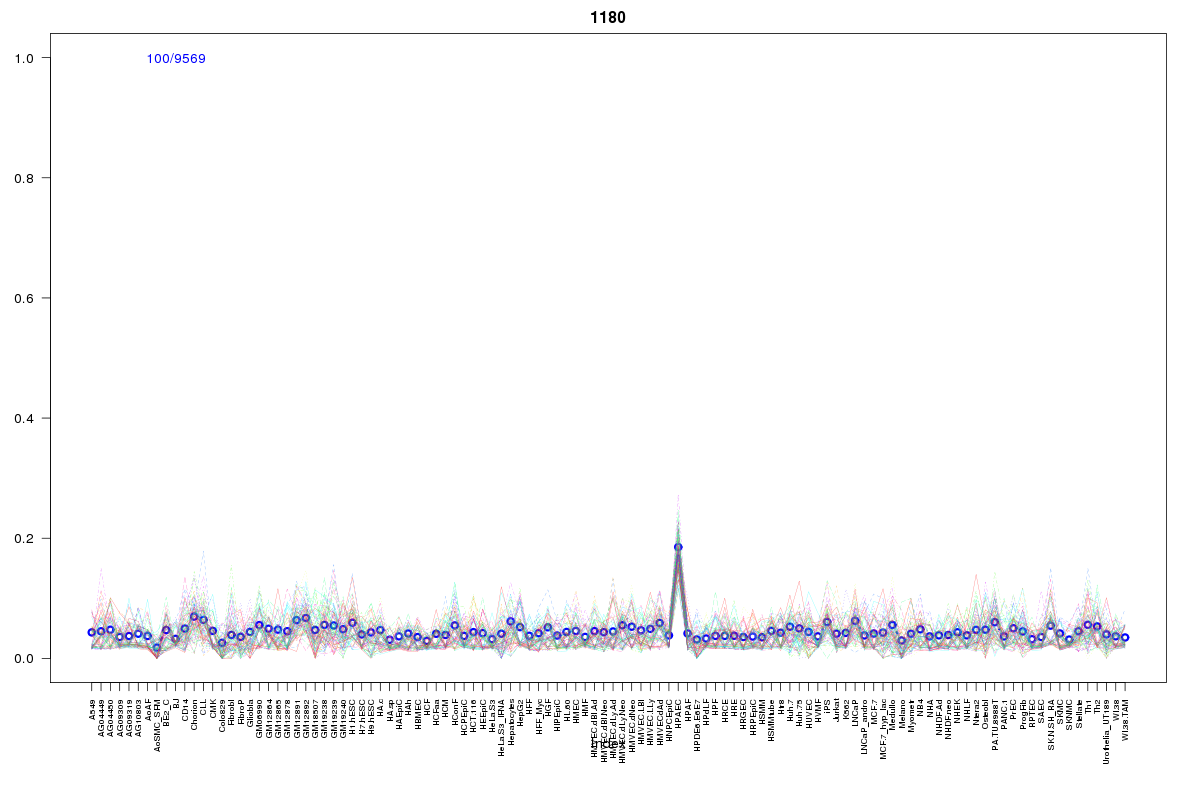 | 1180 | 1 |
Resources
BED file downloads
Connects to 13 DHS sitesTop 10 Correlated DHS Sites
p-values indiciate significant higher or lower correlation| Location | Cluster | P-value |
|---|---|---|
| chr3:46766105-46766255 | 15 | 0.004 |
| chr3:46747720-46747870 | 994 | 0.01 |
| chr3:46848845-46848995 | 2287 | 0.014 |
| chr3:46738200-46738350 | 1520 | 0.019 |
| chr3:46718920-46719070 | 1421 | 0.024 |
| chr3:46754945-46755095 | 881 | 0.024 |
| chr3:46720145-46720295 | 410 | 0.022 |
| chr3:46749425-46749575 | 660 | 0.018 |
| chr3:46719485-46719635 | 2055 | 0.017 |
| chr3:46728365-46728515 | 1652 | 0.011 |
| chr3:46709585-46709735 | 1308 | 0.006 |
External Databases
UCSCEnsembl (ENSG00000181585)