Gene: TMEM259
chr19: 1009646-1021117Expression Profile
(log scale)
Graphical Connections
Distribution of linked clusters:
You may find it interesting if many of the connected DHS sites belong to the same cluster.| Cluster Profile | Cluster ID | Number of DHS sites in this cluster |
|---|---|---|
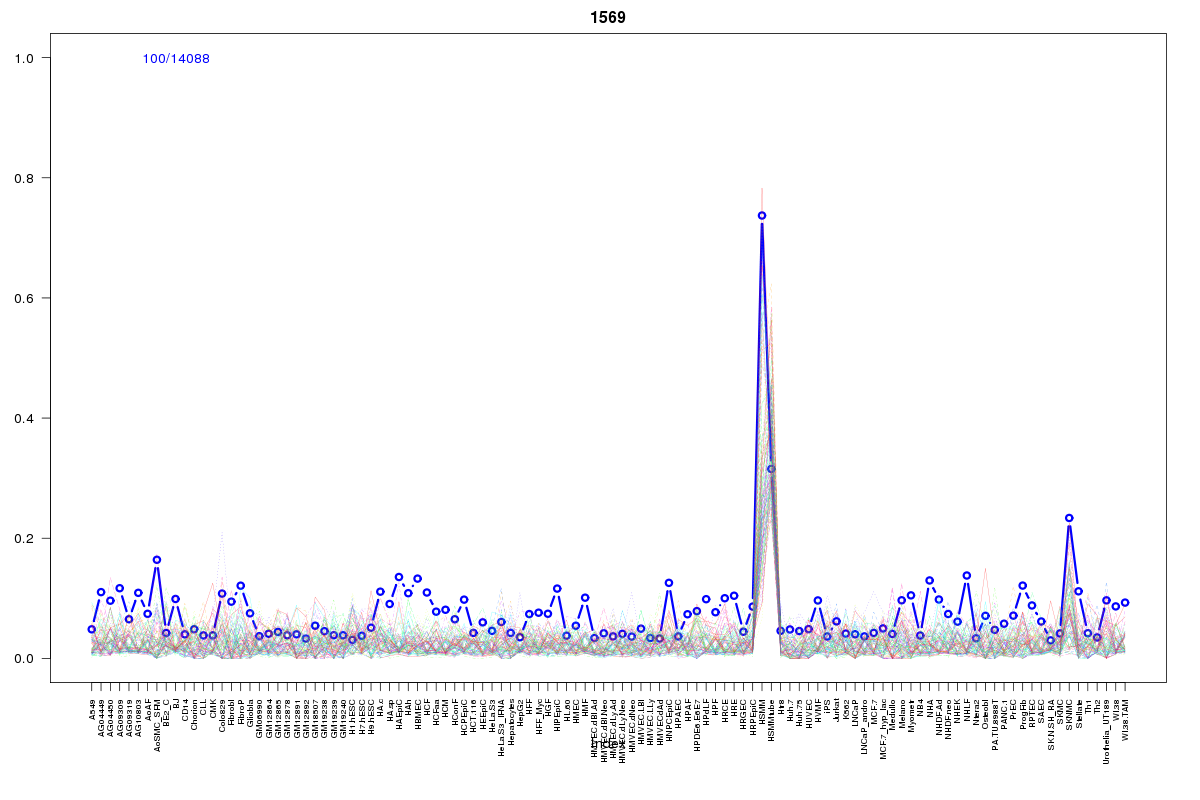 | 1569 | 1 |
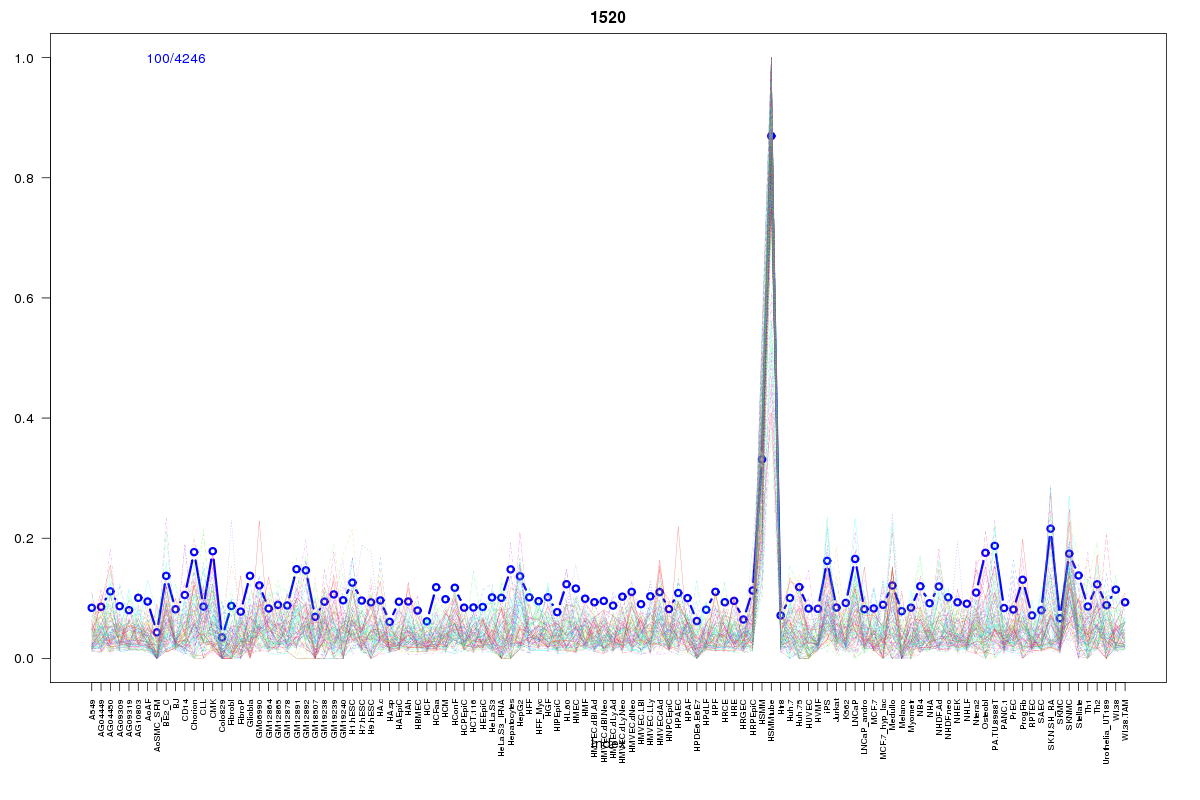 | 1520 | 1 |
 | 570 | 1 |
 | 1008 | 1 |
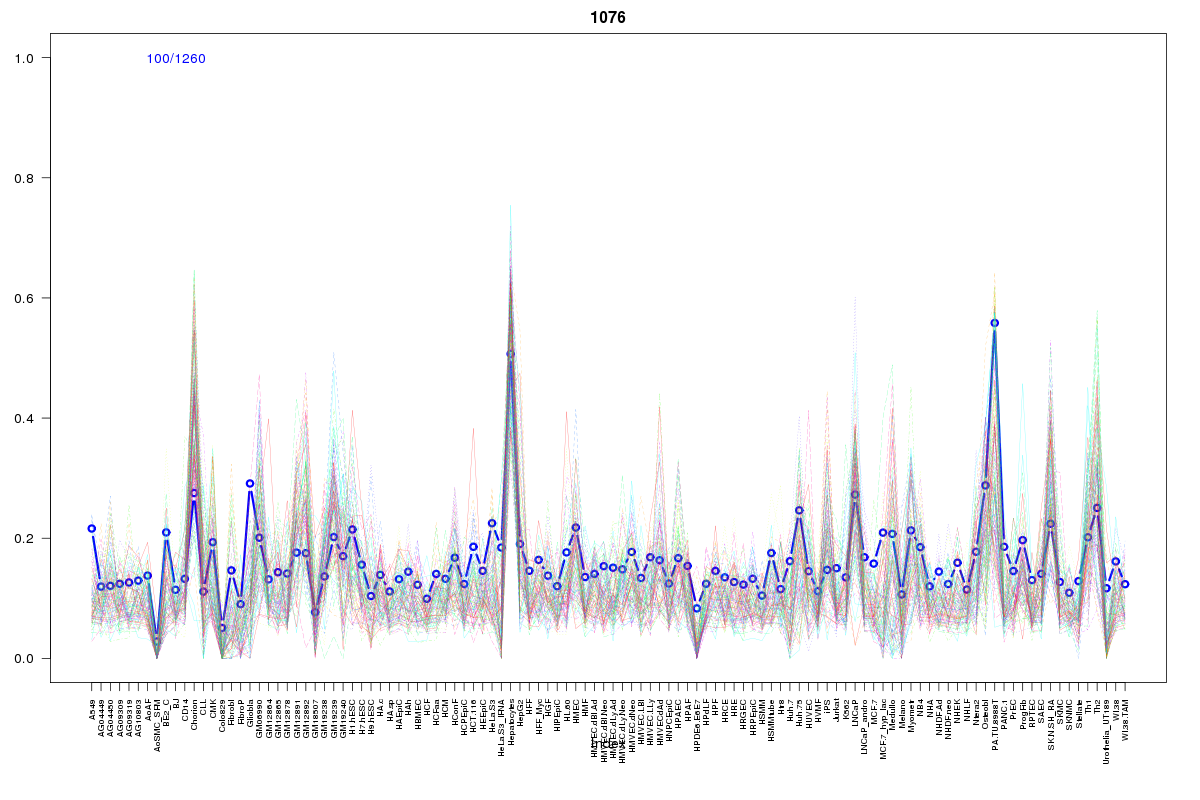 | 1076 | 1 |
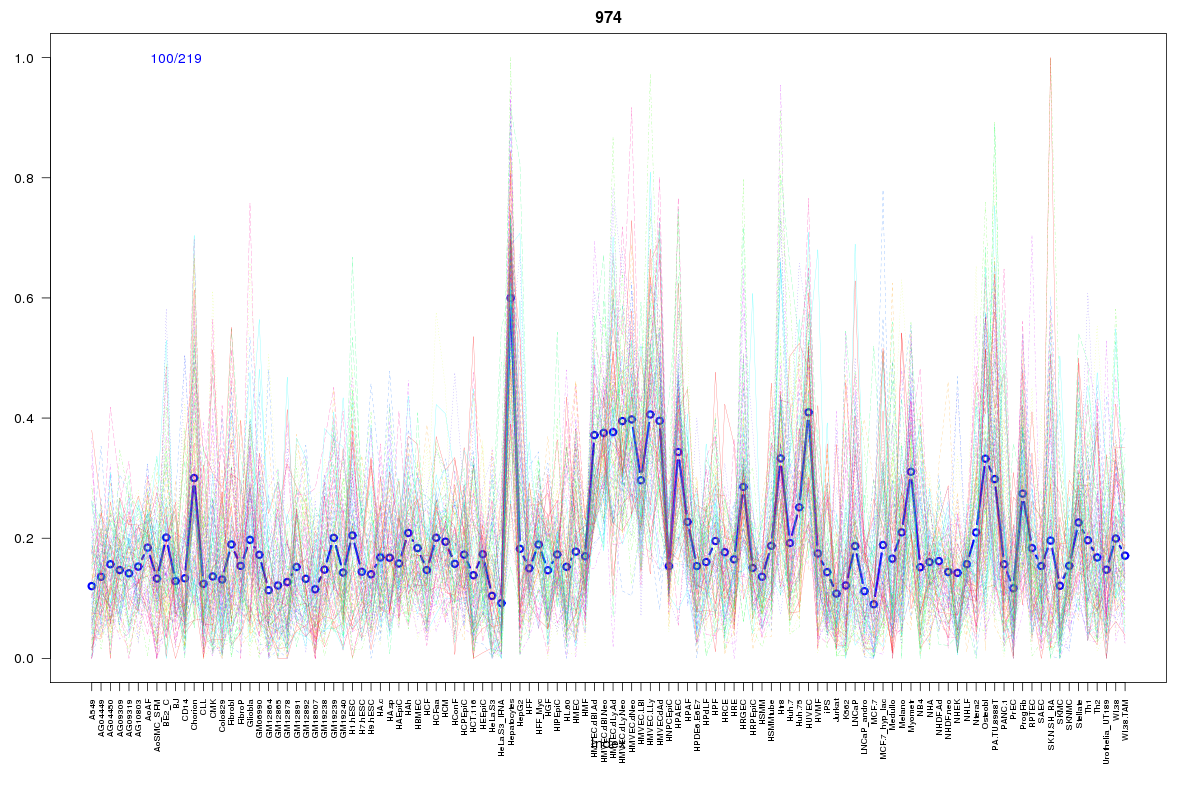 | 974 | 1 |
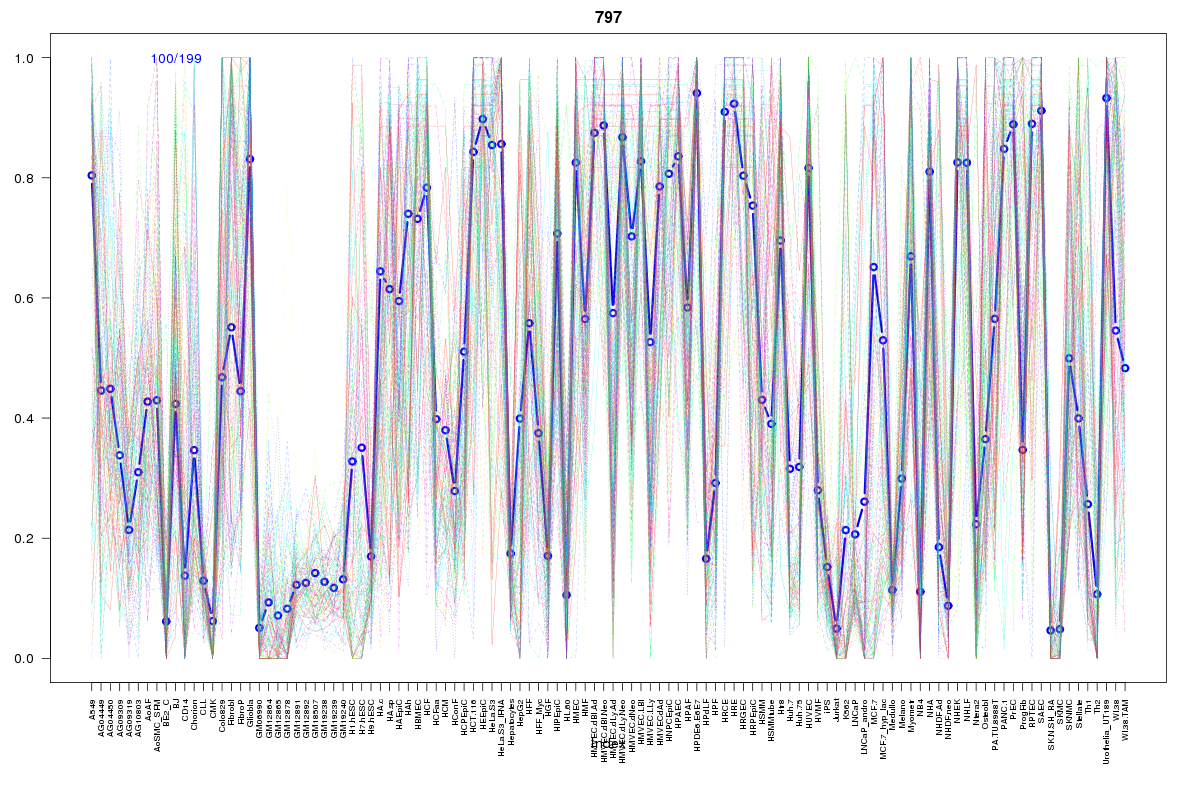 | 797 | 1 |
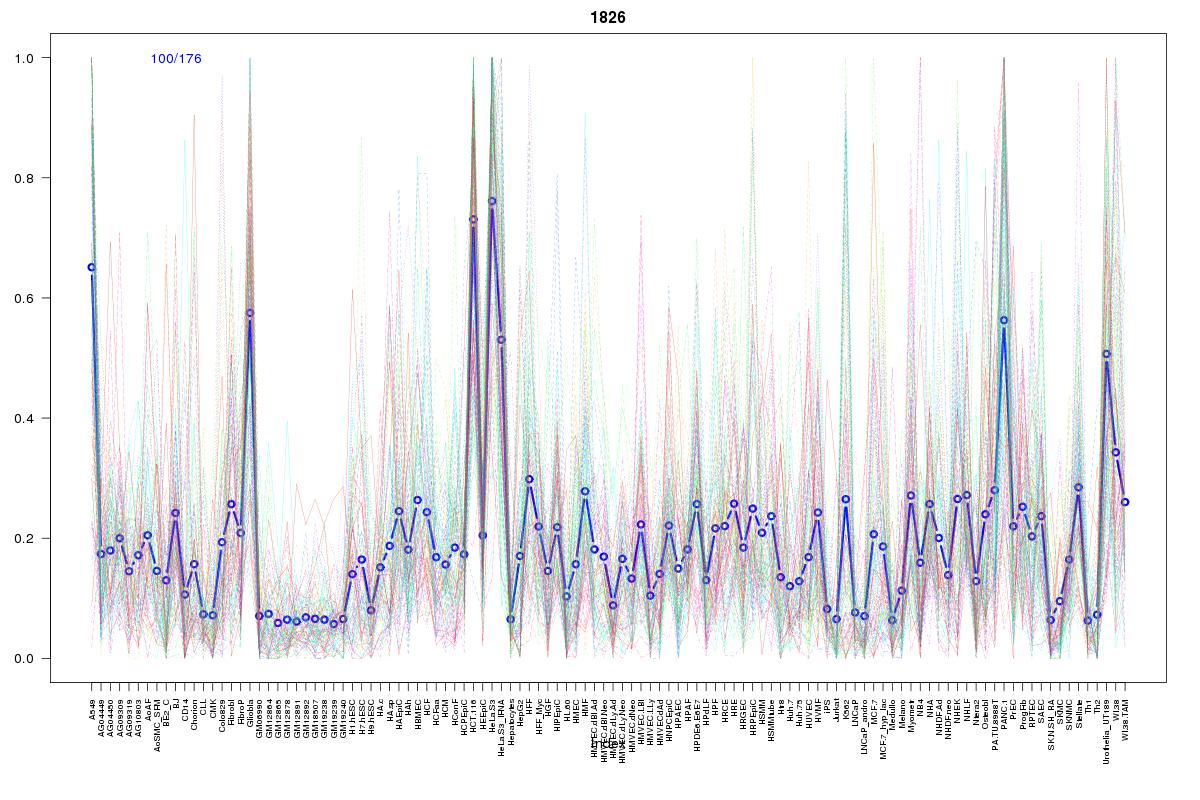 | 1826 | 1 |
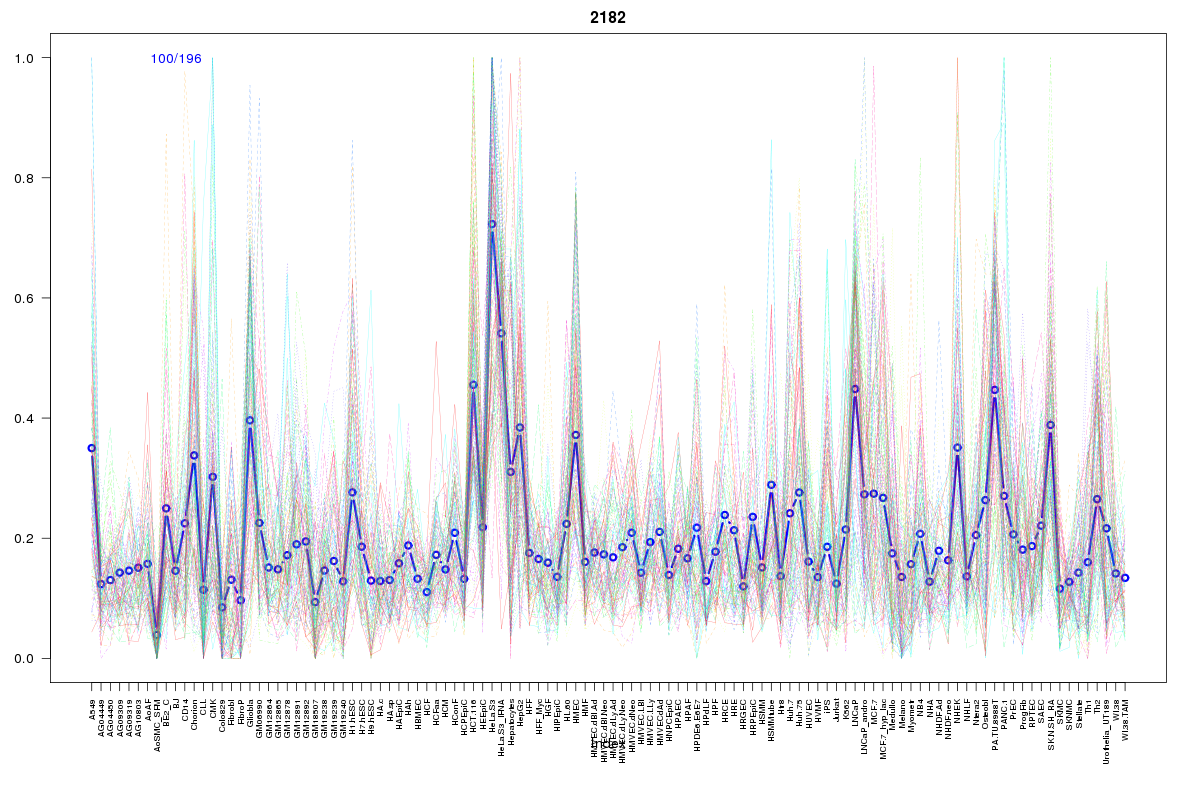 | 2182 | 1 |
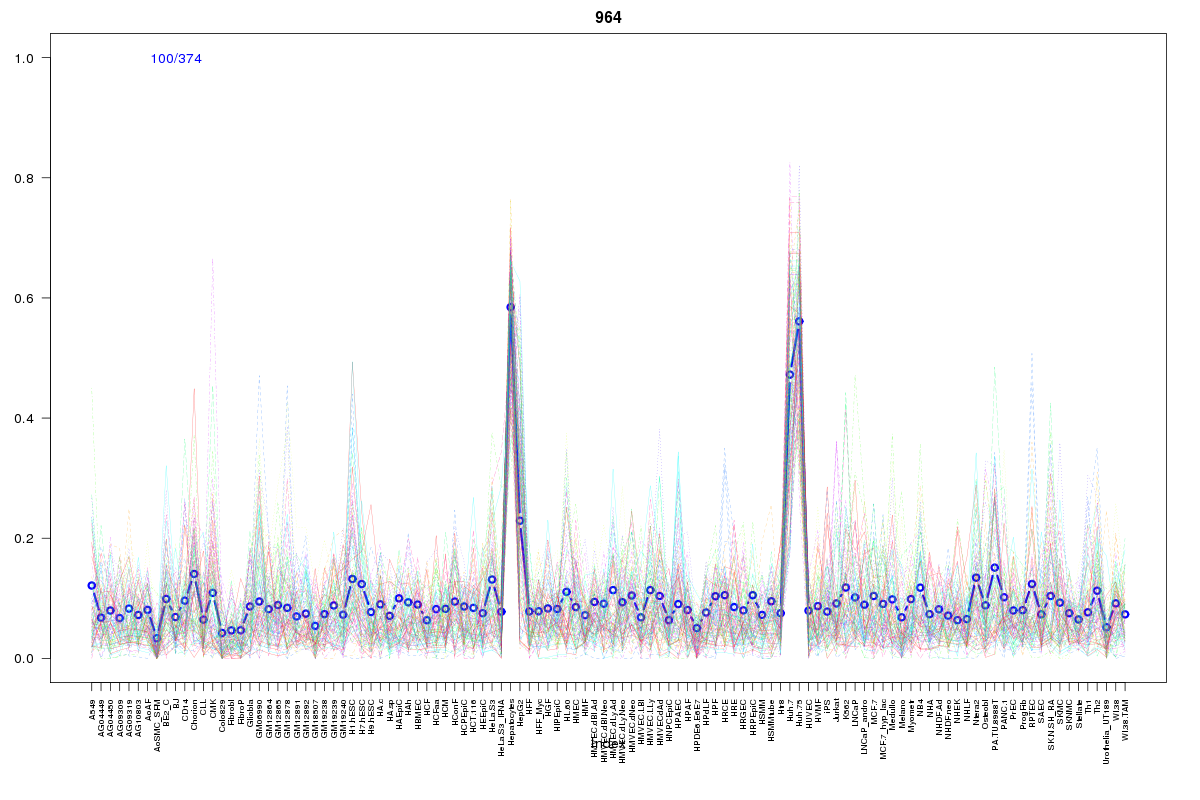 | 964 | 1 |
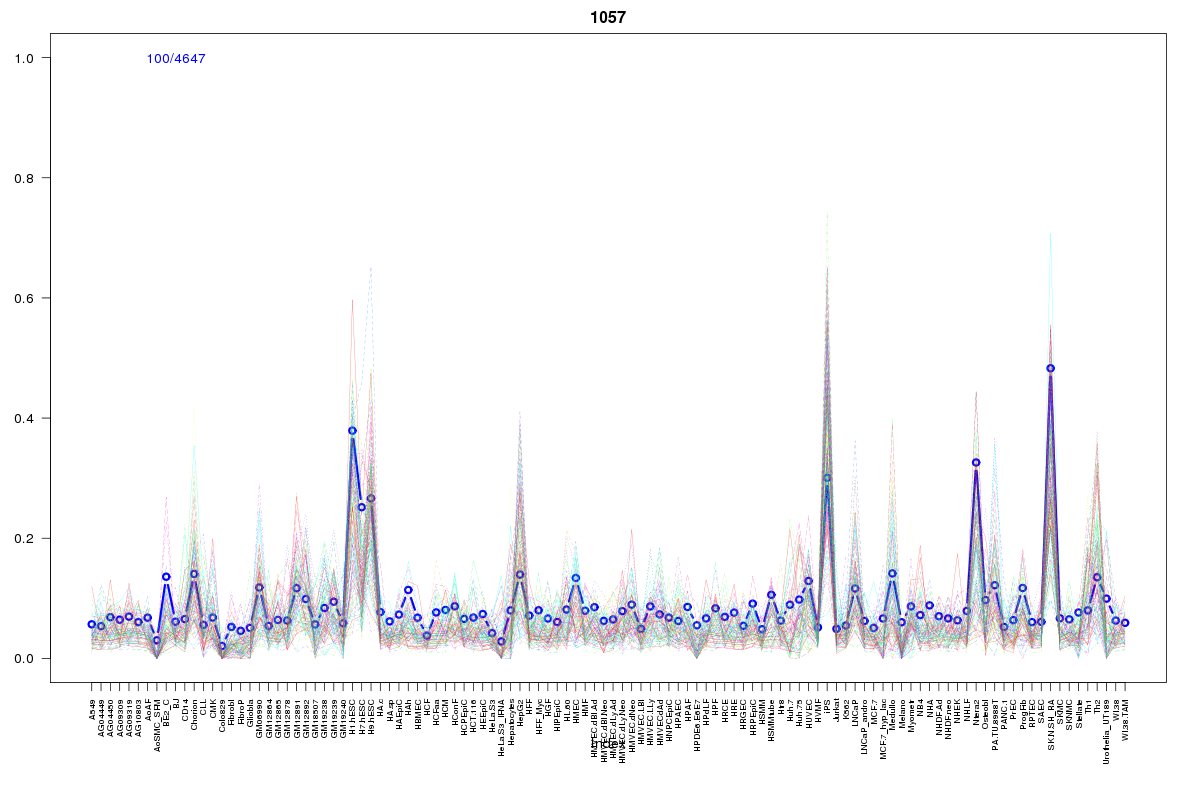 | 1057 | 1 |
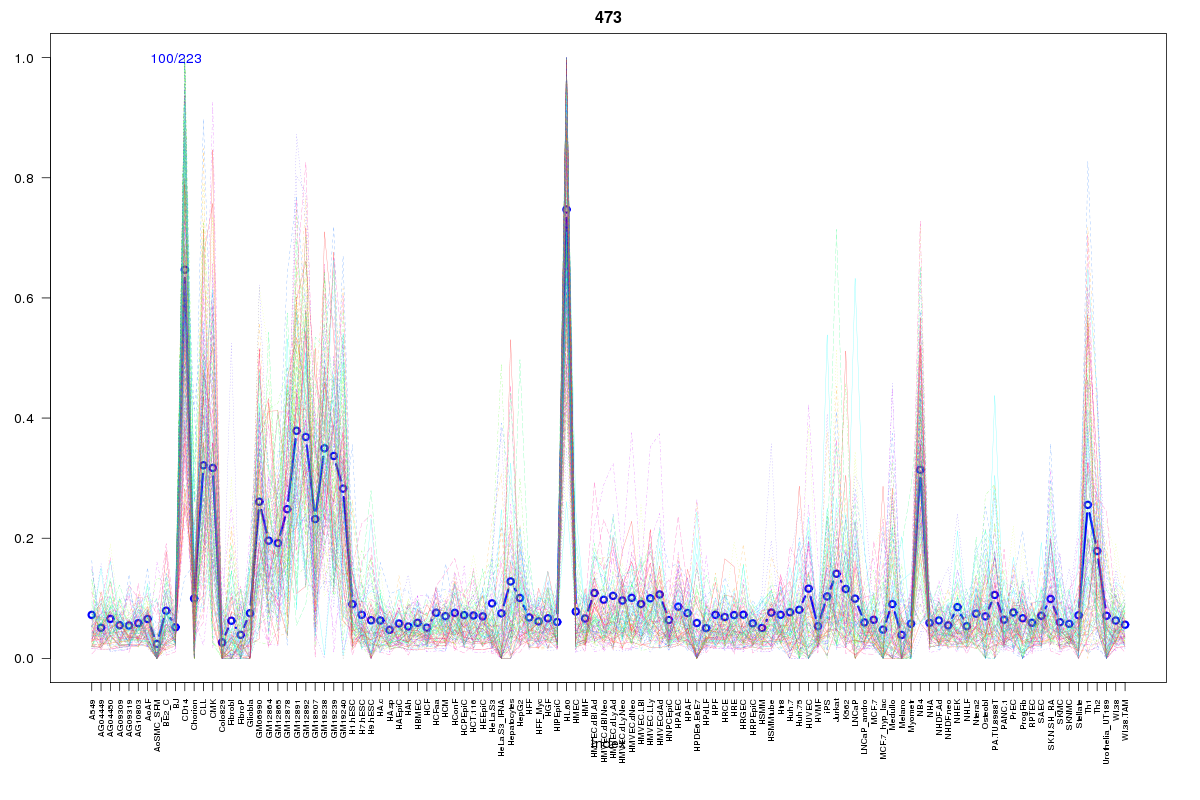 | 473 | 1 |
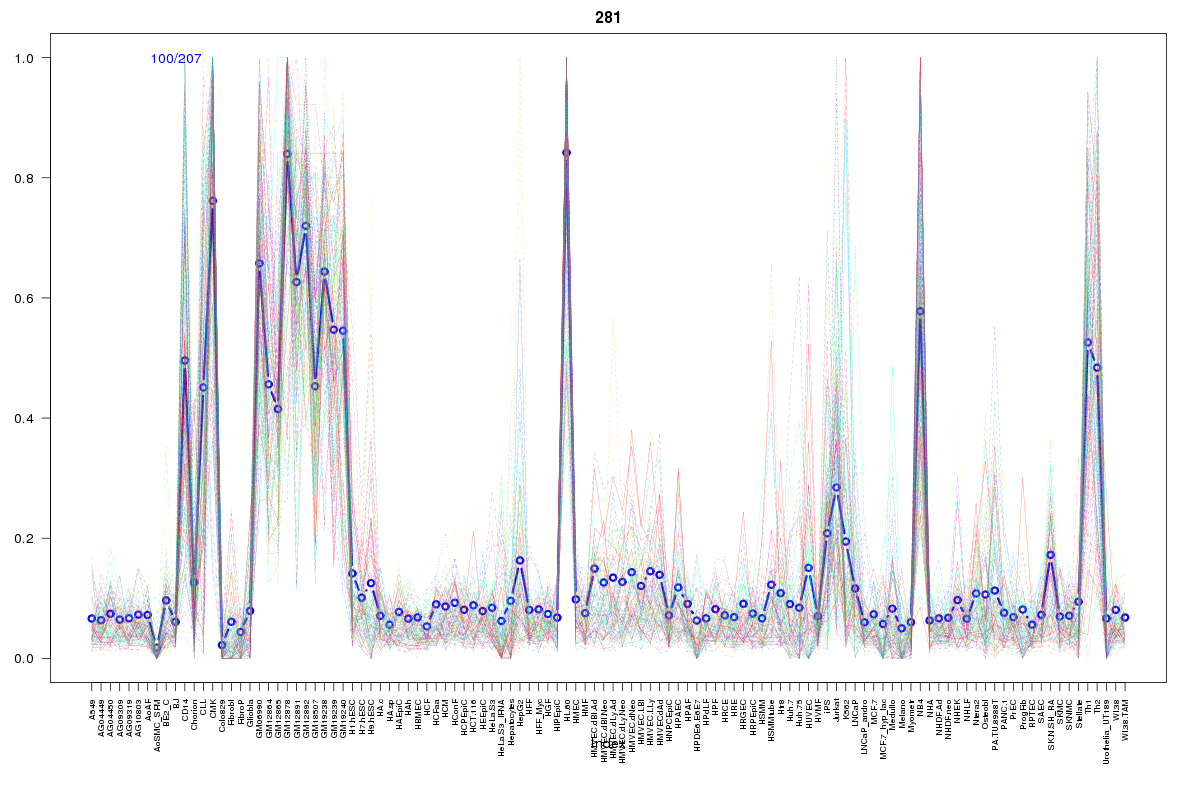 | 281 | 1 |
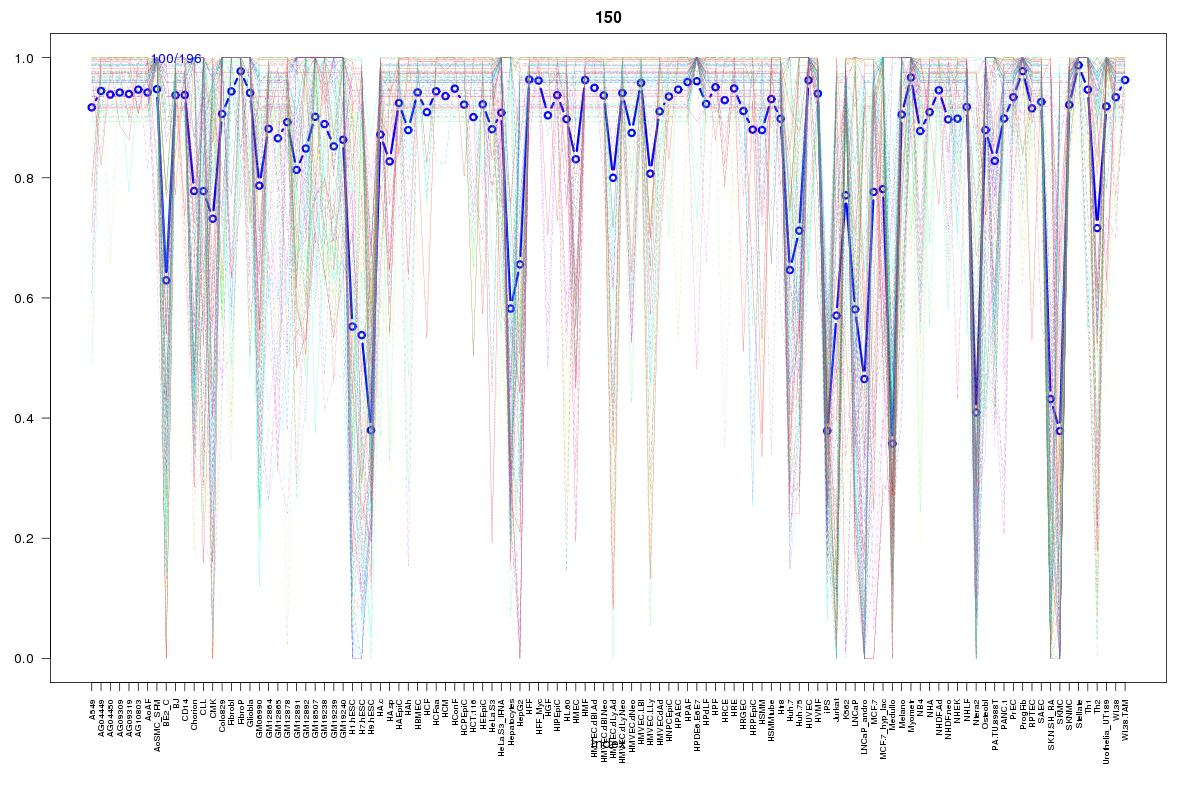 | 150 | 1 |
 | 927 | 1 |
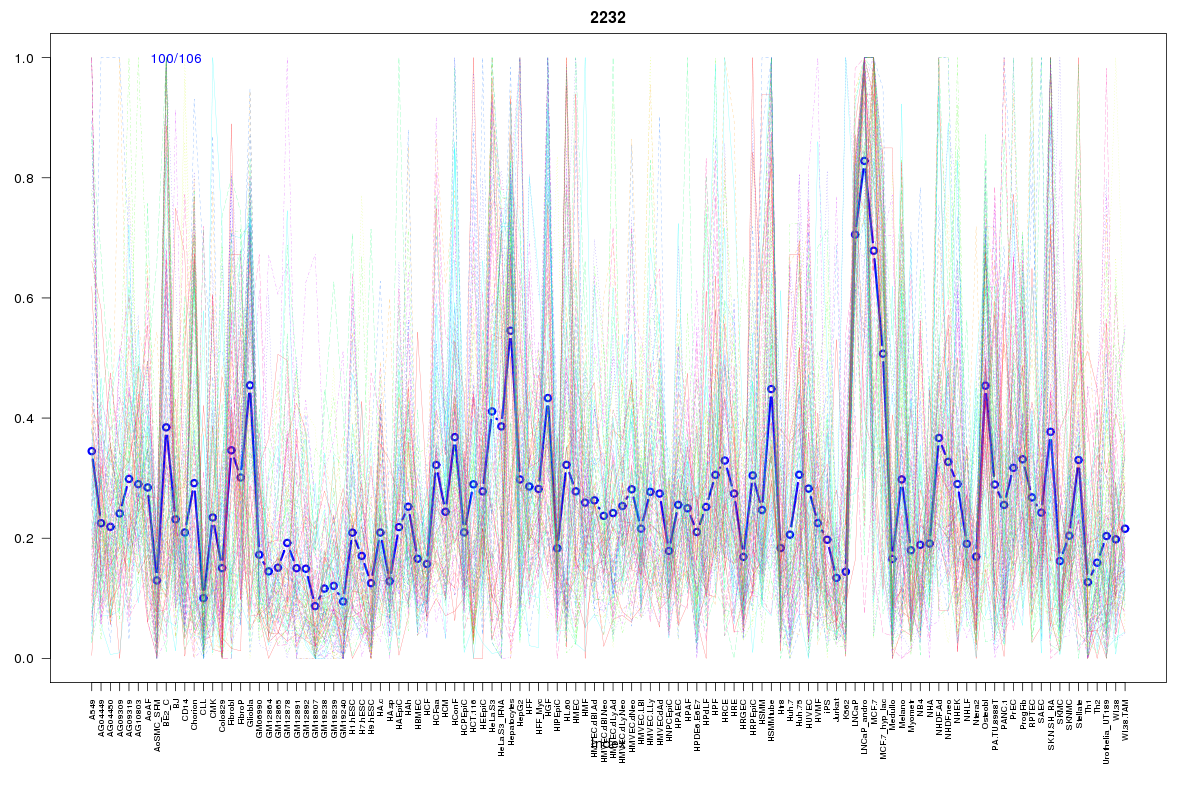 | 2232 | 1 |
 | 770 | 1 |
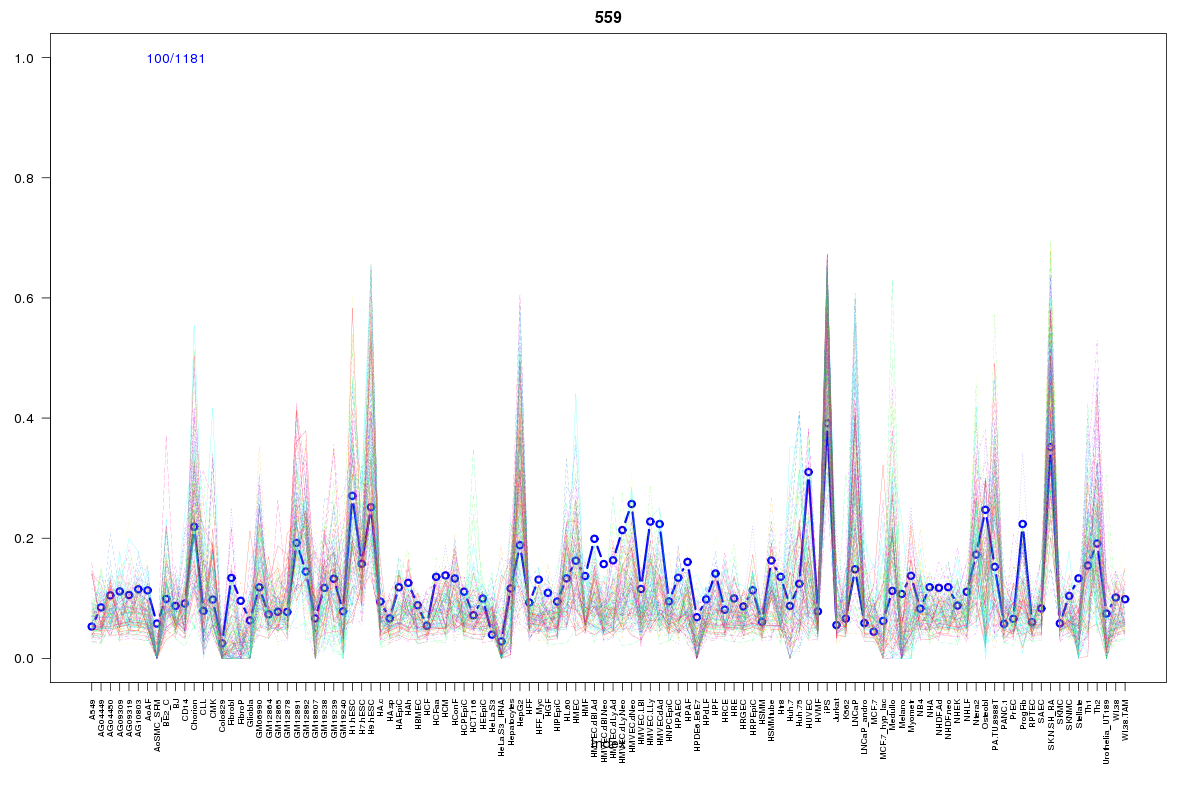 | 559 | 1 |
Resources
BED file downloads
Connects to 18 DHS sitesTop 10 Correlated DHS Sites
p-values indiciate significant higher or lower correlation| Location | Cluster | P-value |
|---|---|---|
| chr19:1016880-1017030 | 797 | 0 |
| chr19:1075845-1075995 | 964 | 0.006 |
| chr19:998965-999115 | 1076 | 0.013 |
| chr19:997225-997375 | 1008 | 0.015 |
| chr19:1016625-1016775 | 974 | 0.015 |
| chr19:1042300-1042450 | 1826 | 0.018 |
| chr19:1101820-1101970 | 150 | 0.02 |
| chr19:922105-922255 | 927 | 0.021 |
| chr19:1106980-1107130 | 2232 | 0.024 |
| chr19:1065585-1065735 | 2182 | 0.024 |
| chr19:972845-972995 | 570 | 0.024 |
External Databases
UCSCEnsembl (ENSG00000182087)