Gene: Y_RNA
chr1: 26203986-26204096Expression Profile
(log scale)
Graphical Connections
Distribution of linked clusters:
You may find it interesting if many of the connected DHS sites belong to the same cluster.| Cluster Profile | Cluster ID | Number of DHS sites in this cluster |
|---|---|---|
 | 615 | 2 |
 | 1963 | 2 |
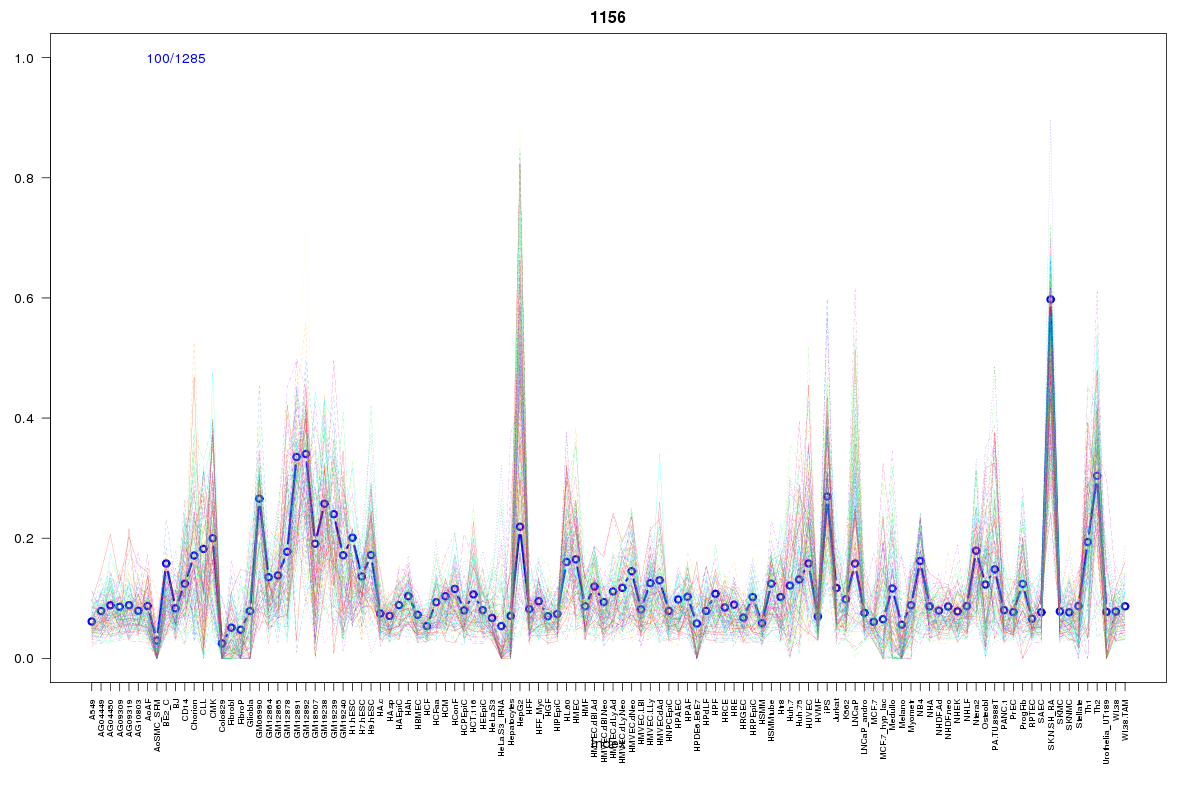 | 1156 | 1 |
 | 2110 | 1 |
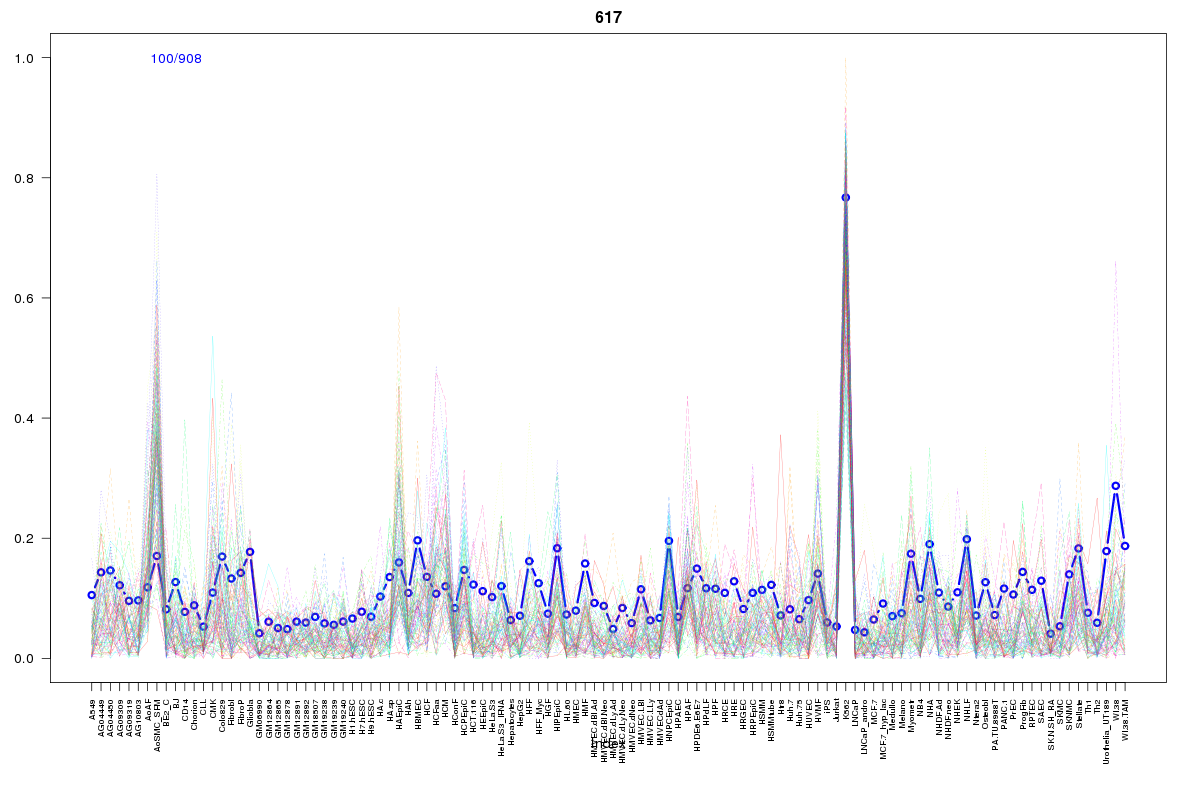 | 617 | 1 |
 | 860 | 1 |
 | 251 | 1 |
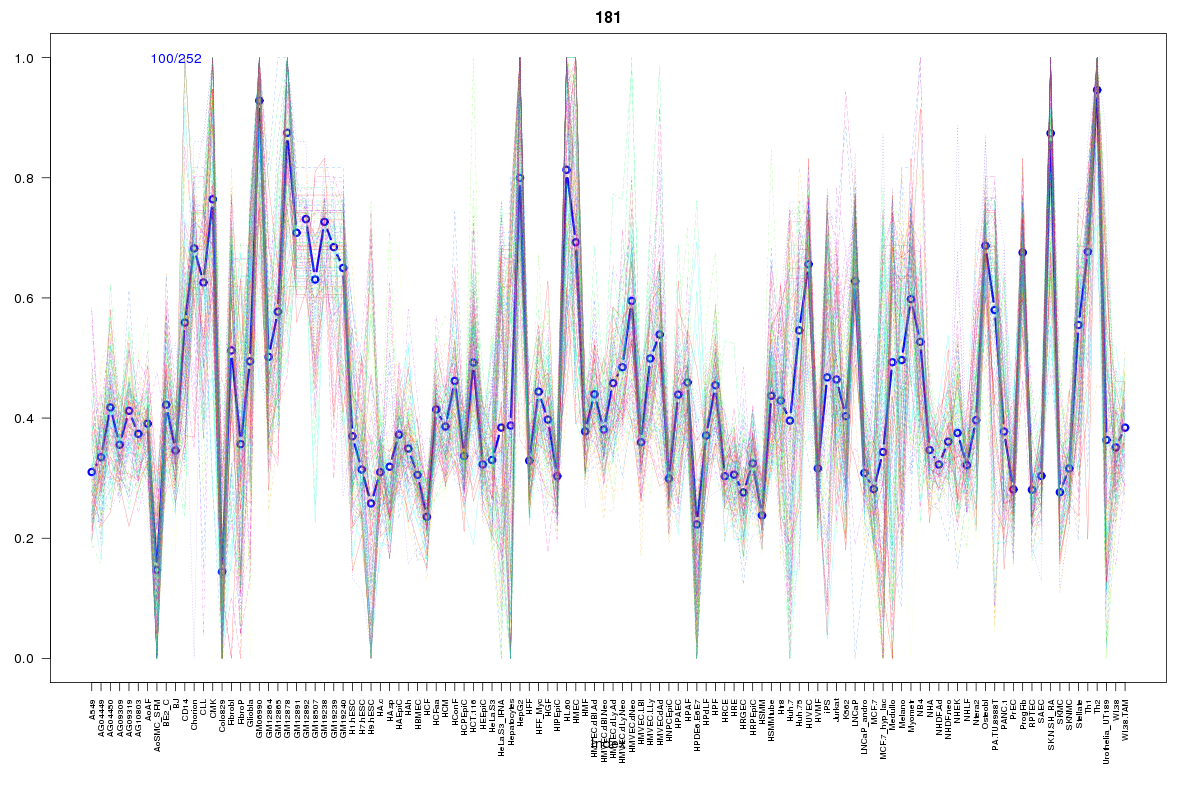 | 181 | 1 |
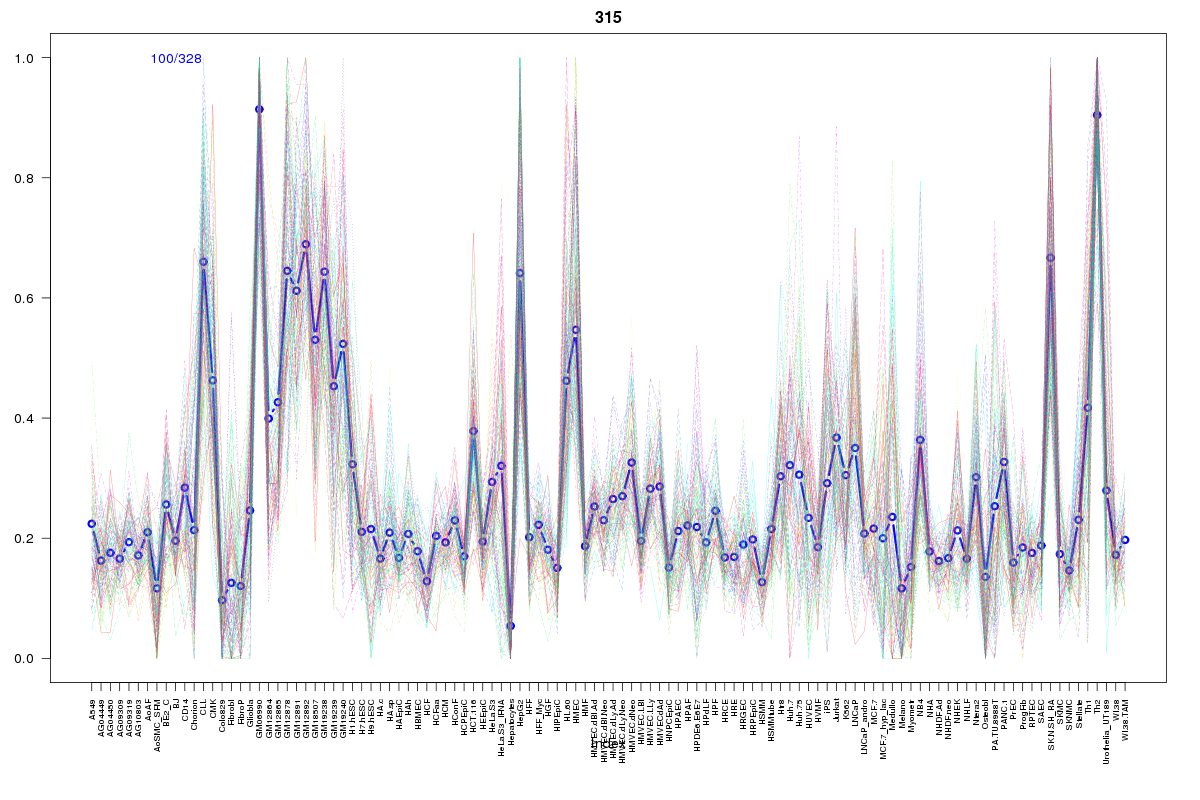 | 315 | 1 |
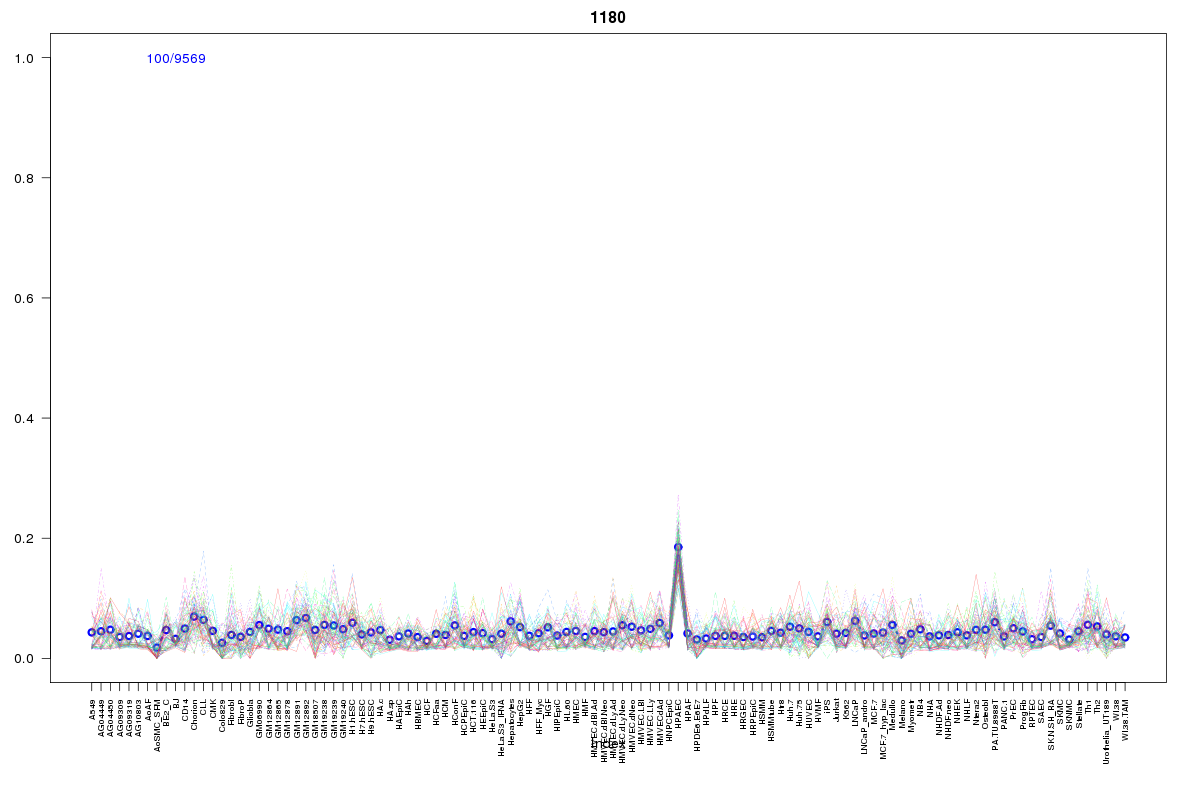 | 1180 | 1 |
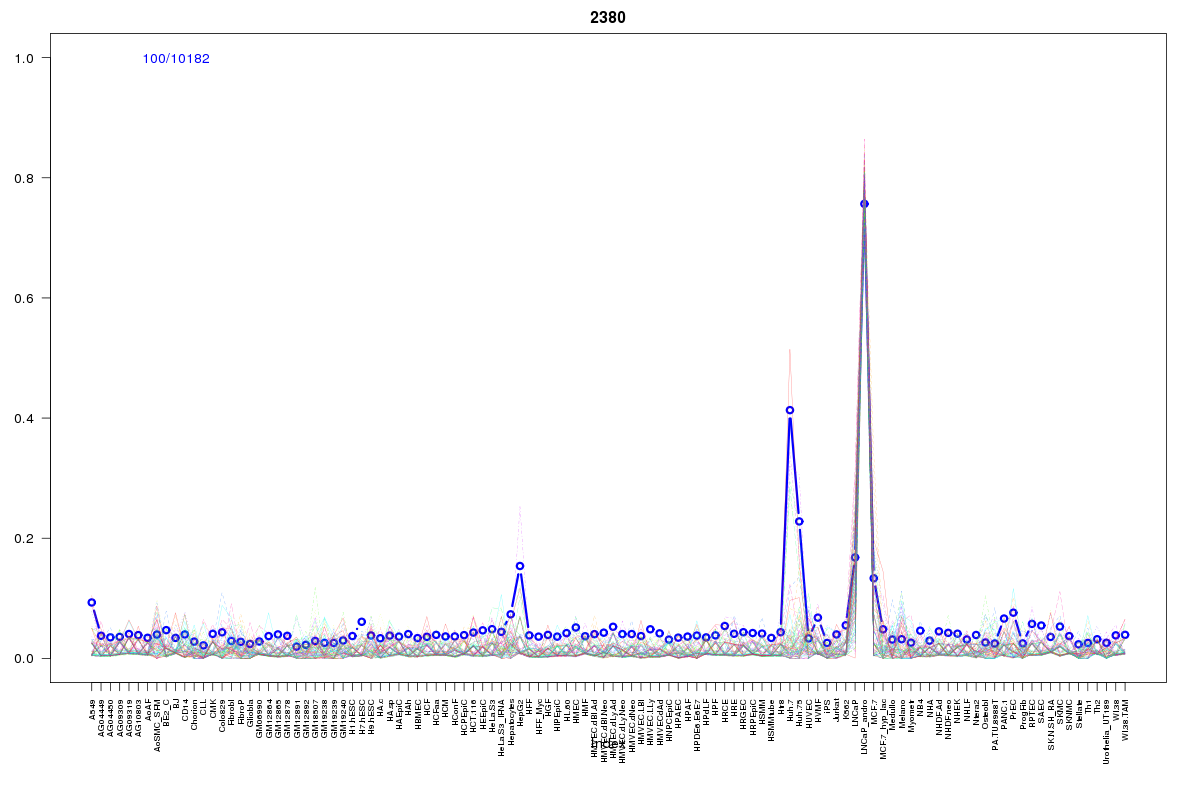 | 2380 | 1 |
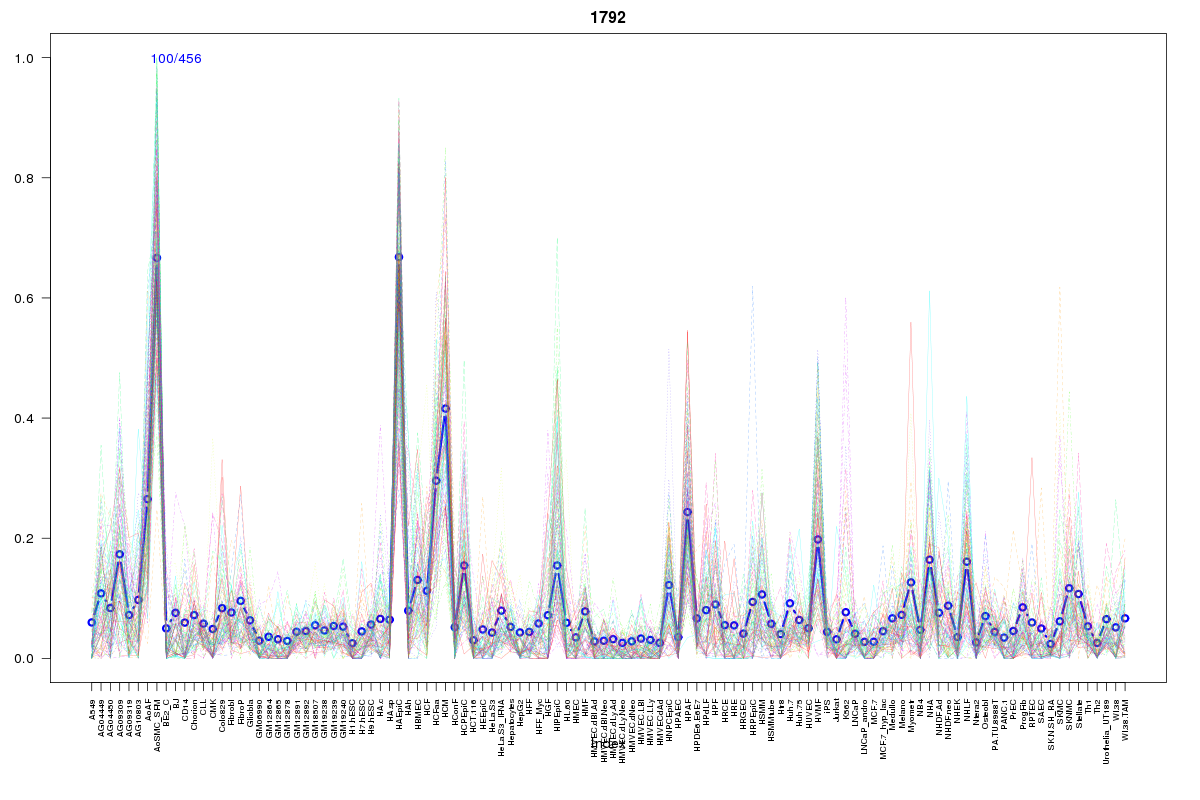 | 1792 | 1 |
 | 1942 | 1 |
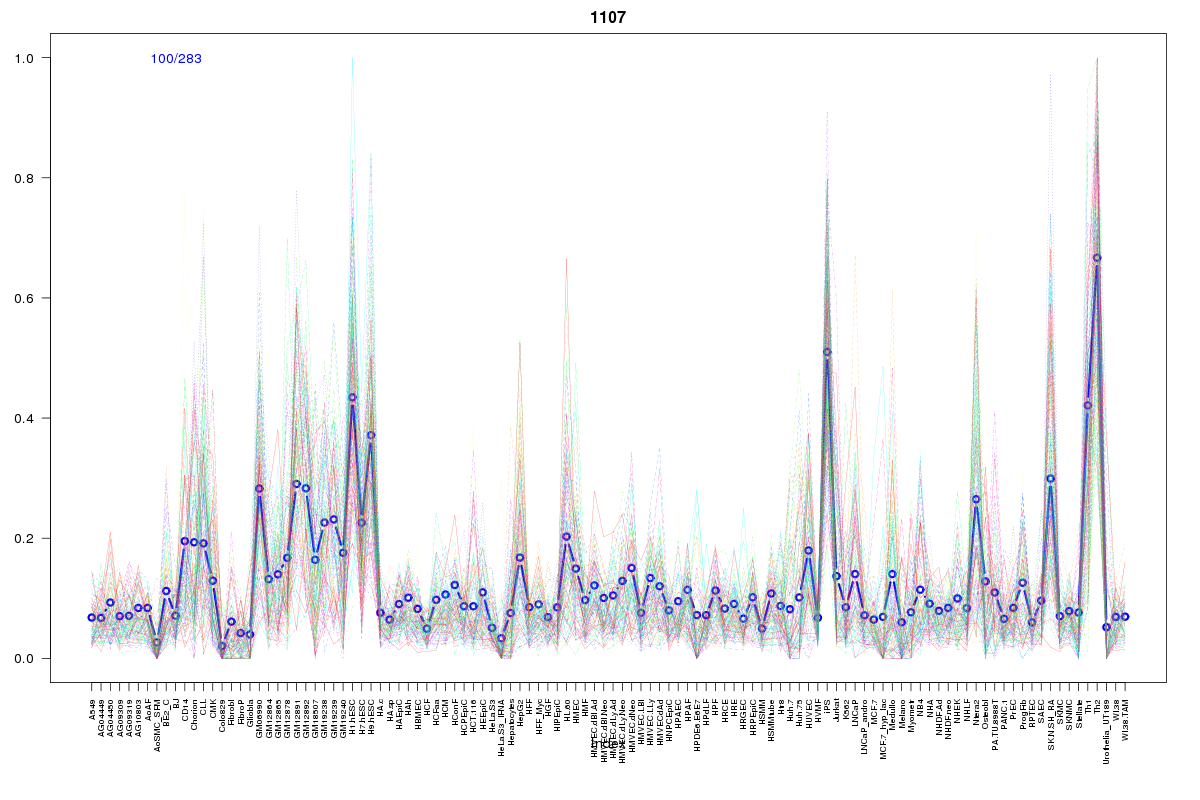 | 1107 | 1 |
Resources
BED file downloads
Connects to 16 DHS sitesTop 10 Correlated DHS Sites
p-values indiciate significant higher or lower correlation| Location | Cluster | P-value |
|---|---|---|
| chr1:26233380-26233530 | 1156 | 0 |
| chr1:26147025-26147175 | 315 | 0.001 |
| chr1:26121660-26121810 | 860 | 0.002 |
| chr1:26198680-26198830 | 2380 | 0.002 |
| chr1:26146640-26146790 | 181 | 0.005 |
| chr1:26190825-26190975 | 1180 | 0.008 |
| chr1:26126585-26126735 | 251 | 0.009 |
| chr1:26233205-26233355 | 1107 | 0.021 |
| chr1:26260080-26260230 | 617 | 0.016 |
| chr1:26246140-26246290 | 2110 | 0.015 |
| chr1:26159840-26159990 | 615 | 0.014 |
External Databases
UCSCEnsembl (ENSG00000207302)