Gene: TMEM253
chr14: 21567095-21571883Expression Profile
(log scale)
Graphical Connections
Distribution of linked clusters:
You may find it interesting if many of the connected DHS sites belong to the same cluster.| Cluster Profile | Cluster ID | Number of DHS sites in this cluster |
|---|---|---|
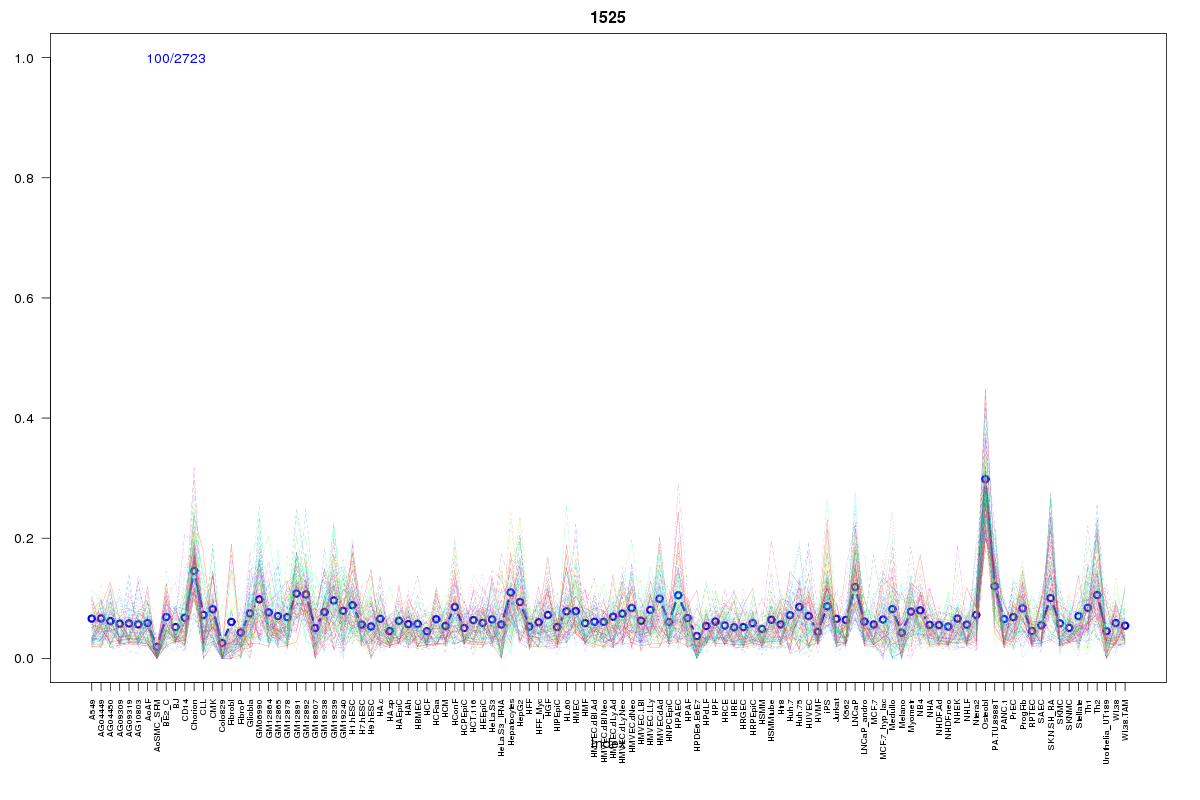 | 1525 | 1 |
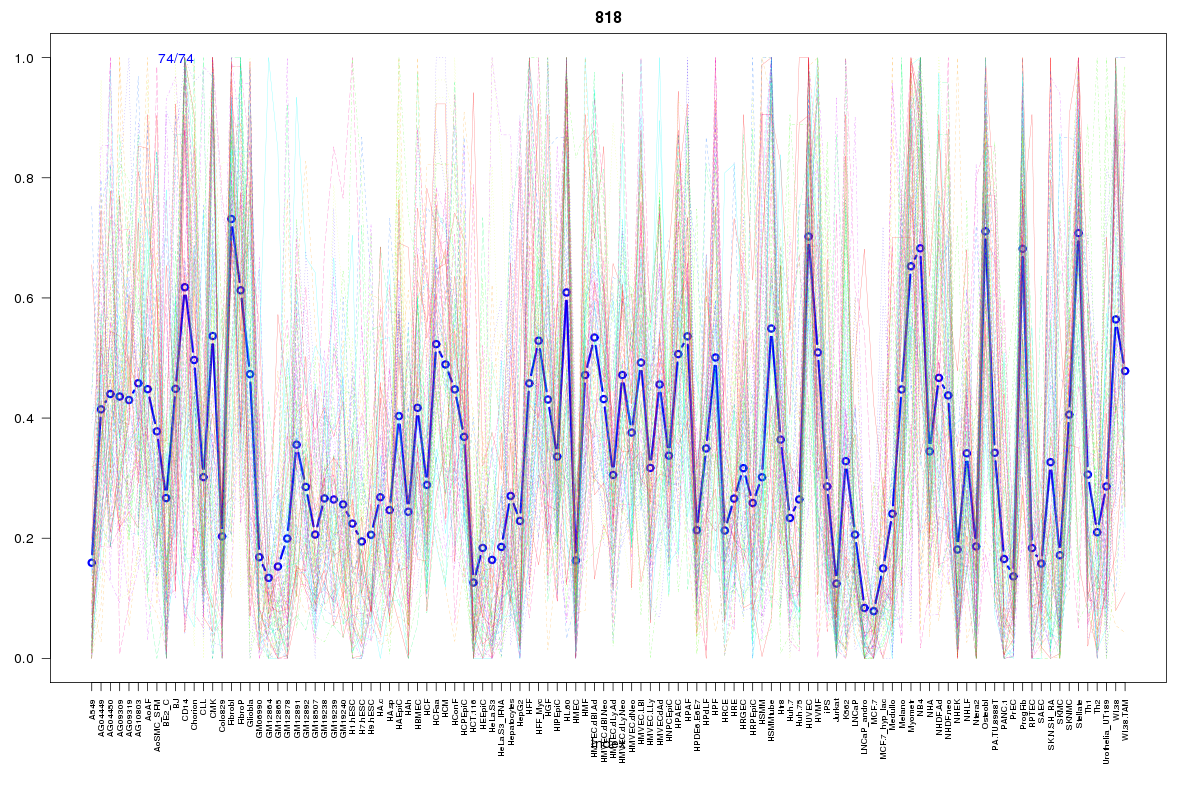 | 818 | 1 |
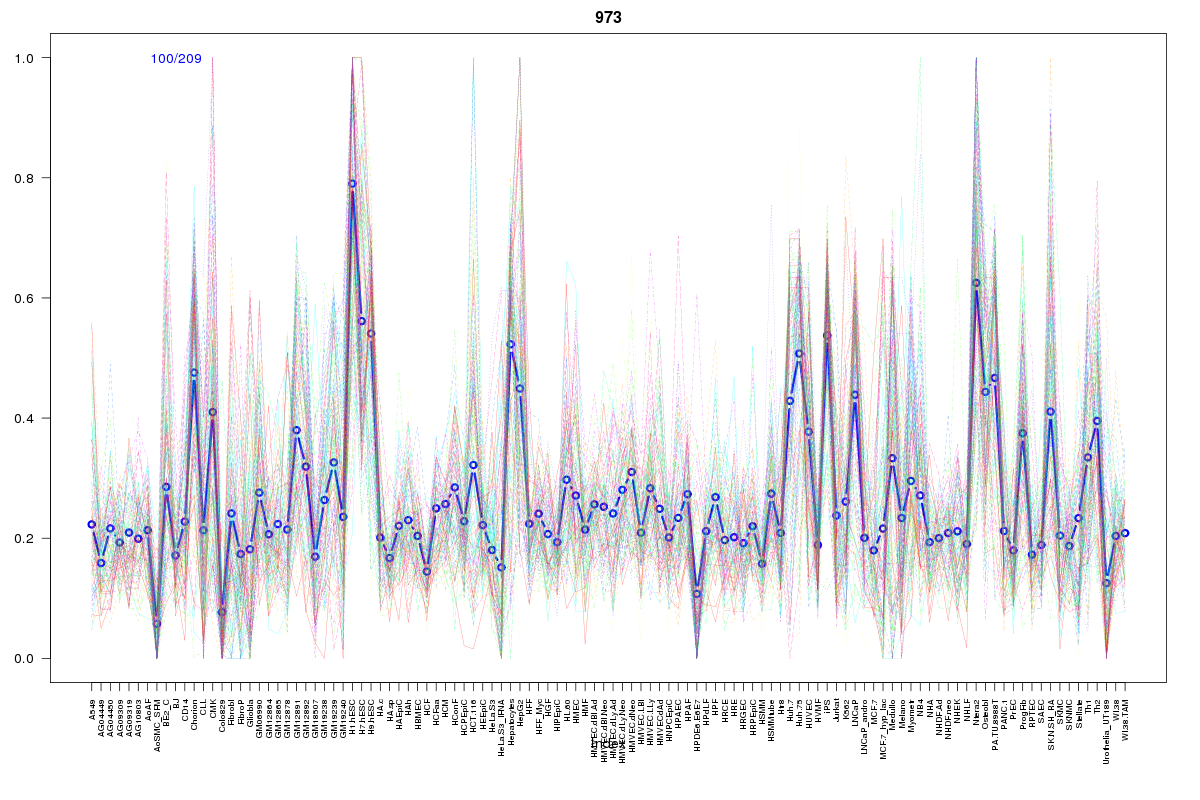 | 973 | 1 |
 | 10 | 1 |
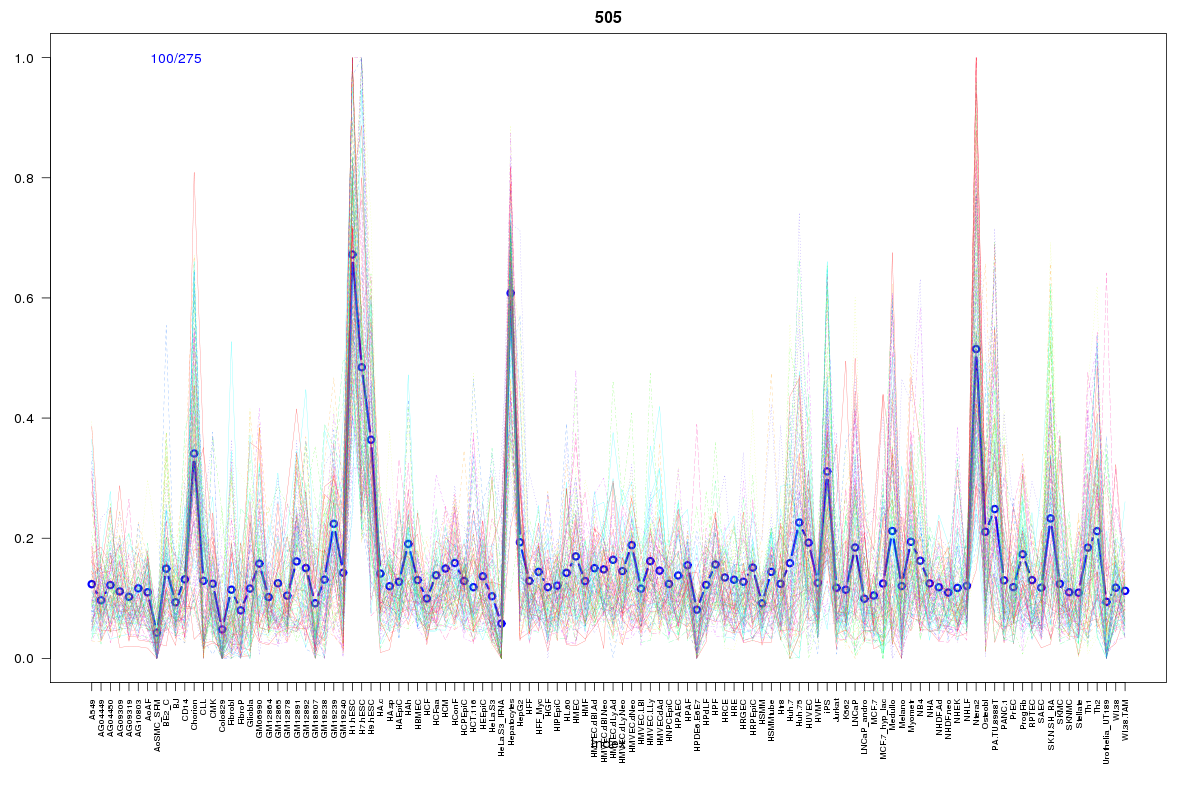 | 505 | 1 |
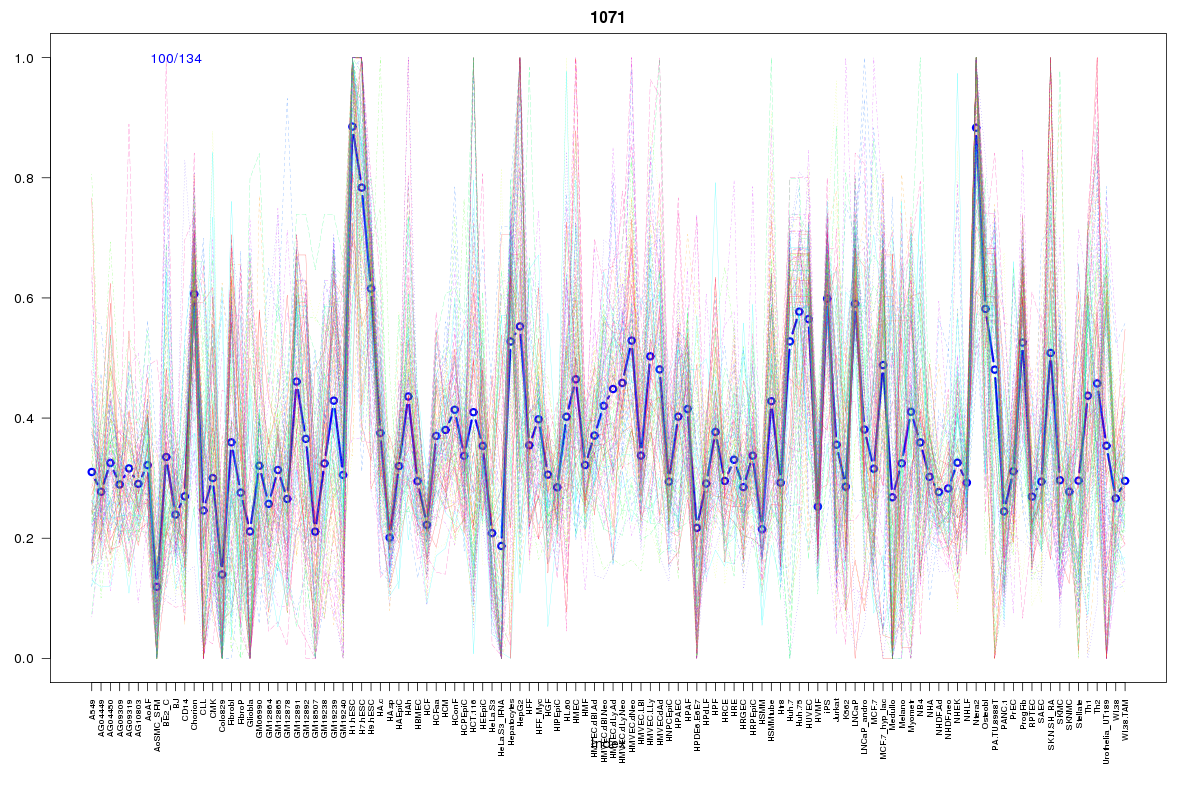 | 1071 | 1 |
 | 1820 | 1 |
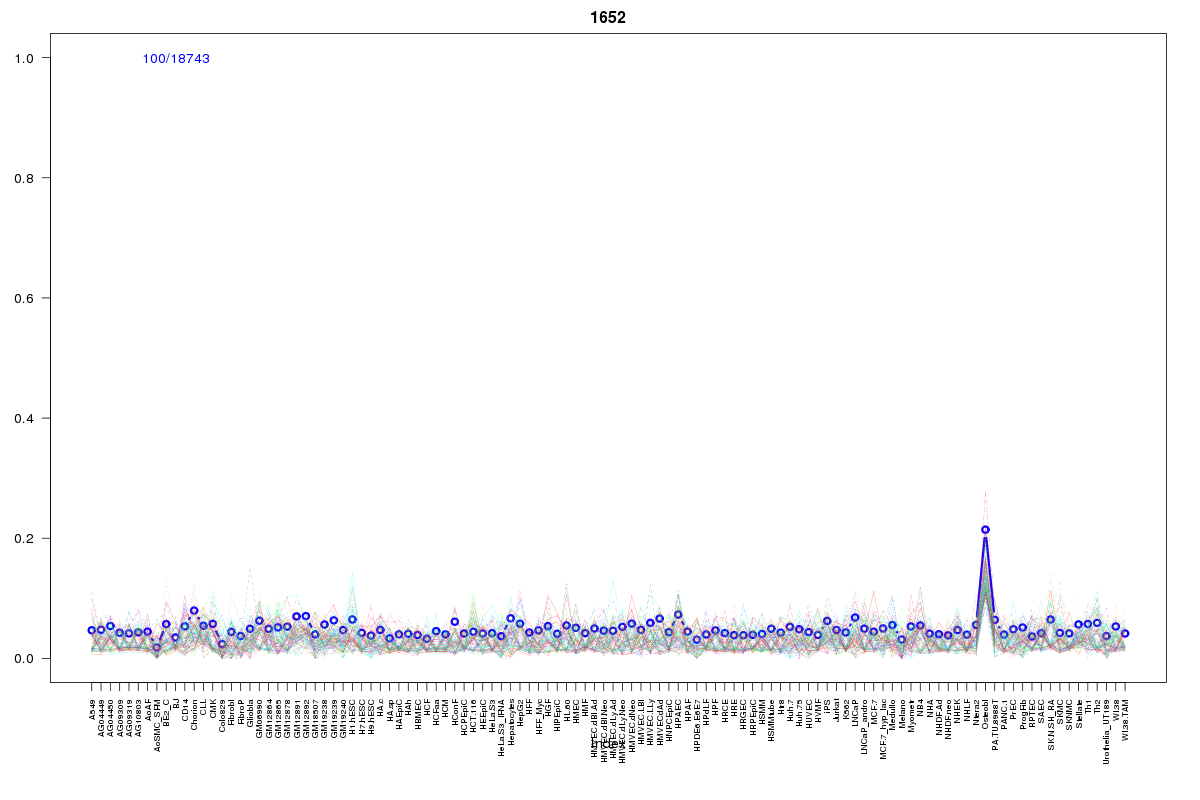 | 1652 | 1 |
 | 2355 | 1 |
 | 1113 | 1 |
Resources
BED file downloads
Connects to 10 DHS sitesTop 10 Correlated DHS Sites
p-values indiciate significant higher or lower correlation| Location | Cluster | P-value |
|---|---|---|
| chr14:21566840-21566990 | 1071 | 0.013 |
| chr14:21665260-21665410 | 1652 | 0.015 |
| chr14:21524800-21524950 | 2355 | 0.02 |
| chr14:21558545-21558695 | 973 | 0.021 |
| chr14:21565880-21566030 | 505 | 0.021 |
| chr14:21562865-21563015 | 10 | 0.021 |
| chr14:21537825-21537975 | 1113 | 0.024 |
| chr14:21626380-21626530 | 1820 | 0.017 |
| chr14:21556045-21556195 | 818 | 0.016 |
| chr14:21552965-21553115 | 1525 | 0.016 |
External Databases
UCSCEnsembl (ENSG00000232070)