Gene: TPM3P9
chr19: 53935236-53947923Expression Profile
(log scale)
Graphical Connections
Distribution of linked clusters:
You may find it interesting if many of the connected DHS sites belong to the same cluster.| Cluster Profile | Cluster ID | Number of DHS sites in this cluster |
|---|---|---|
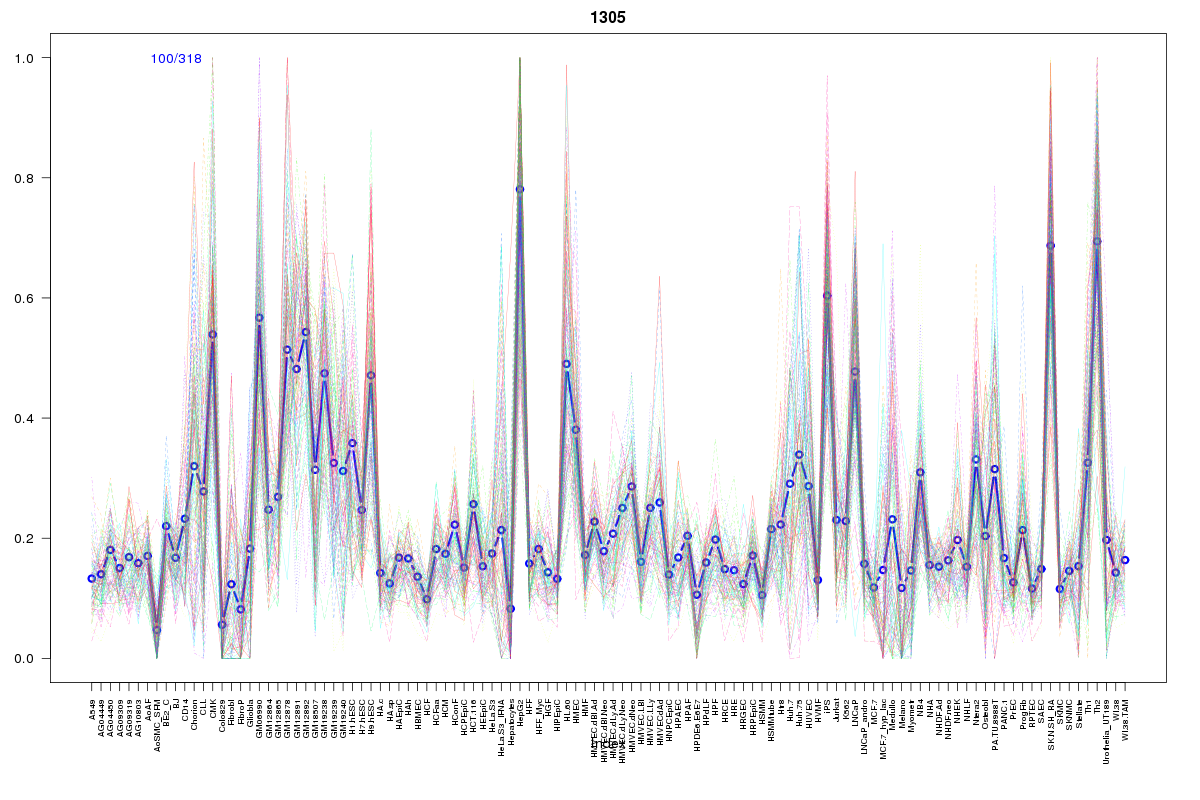 | 1305 | 1 |
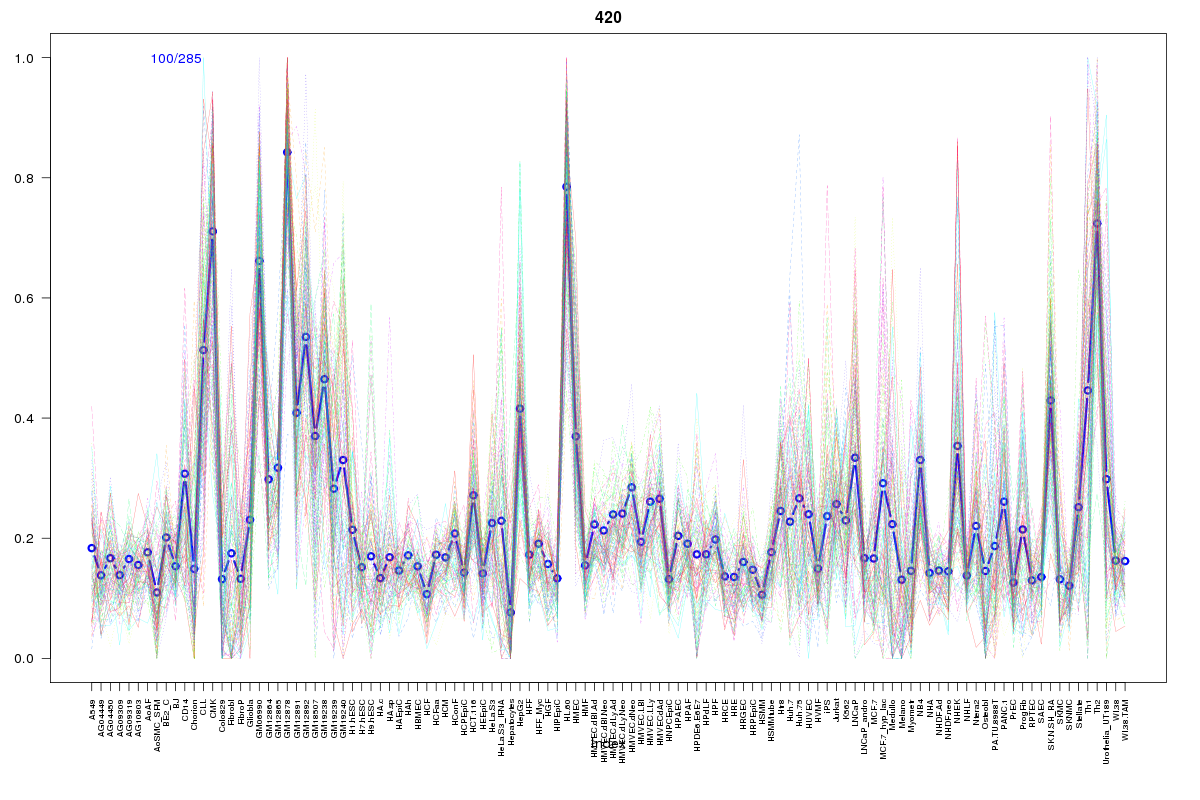 | 420 | 1 |
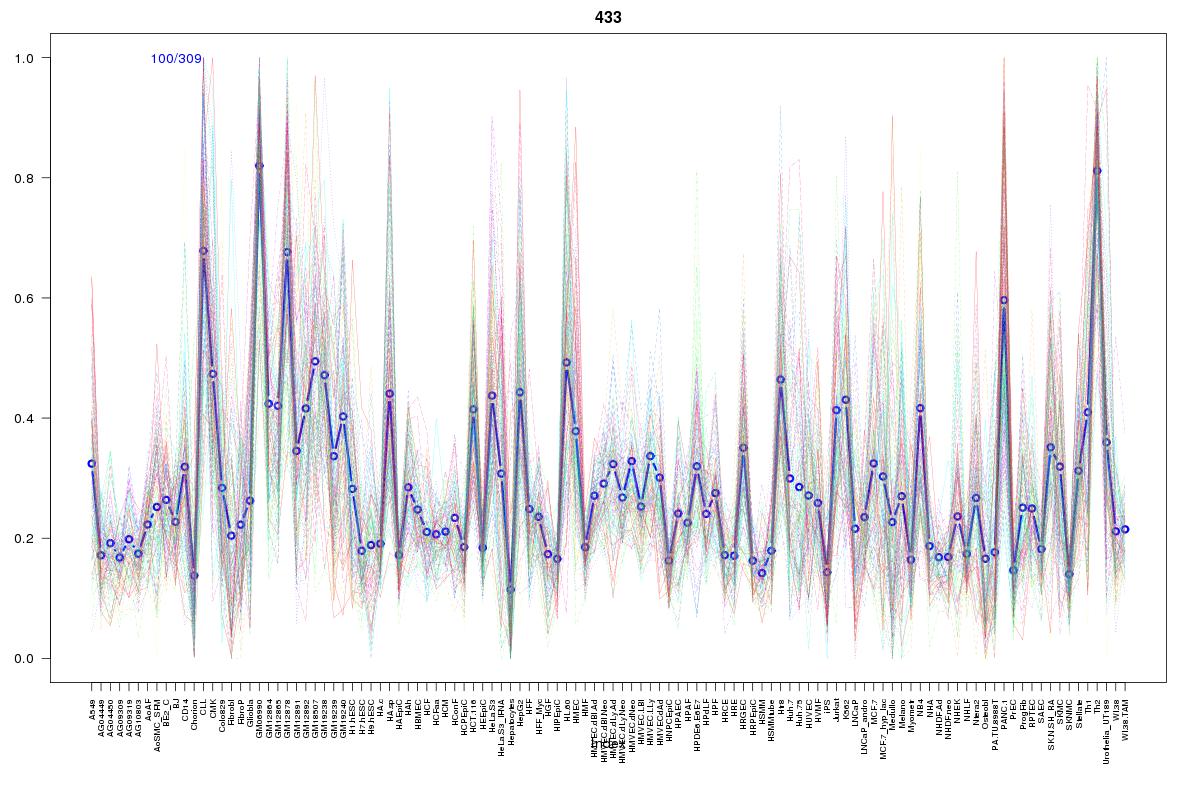 | 433 | 1 |
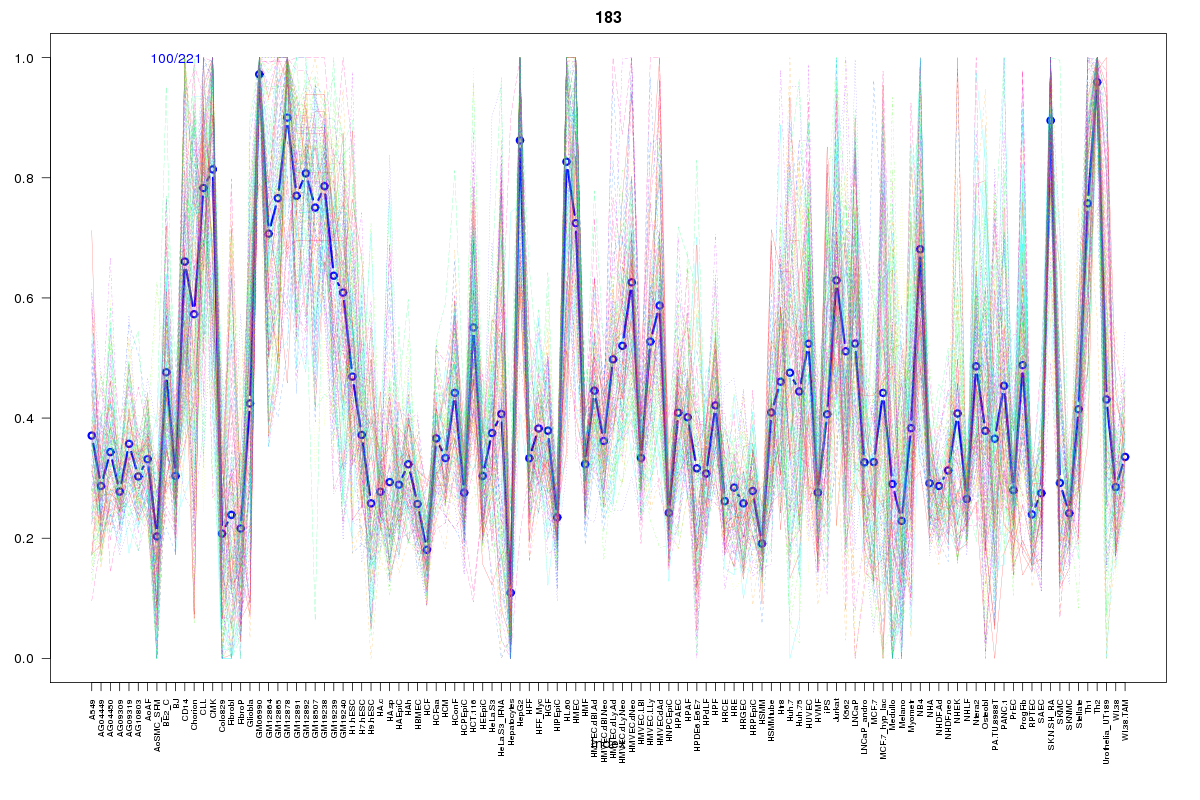 | 183 | 1 |
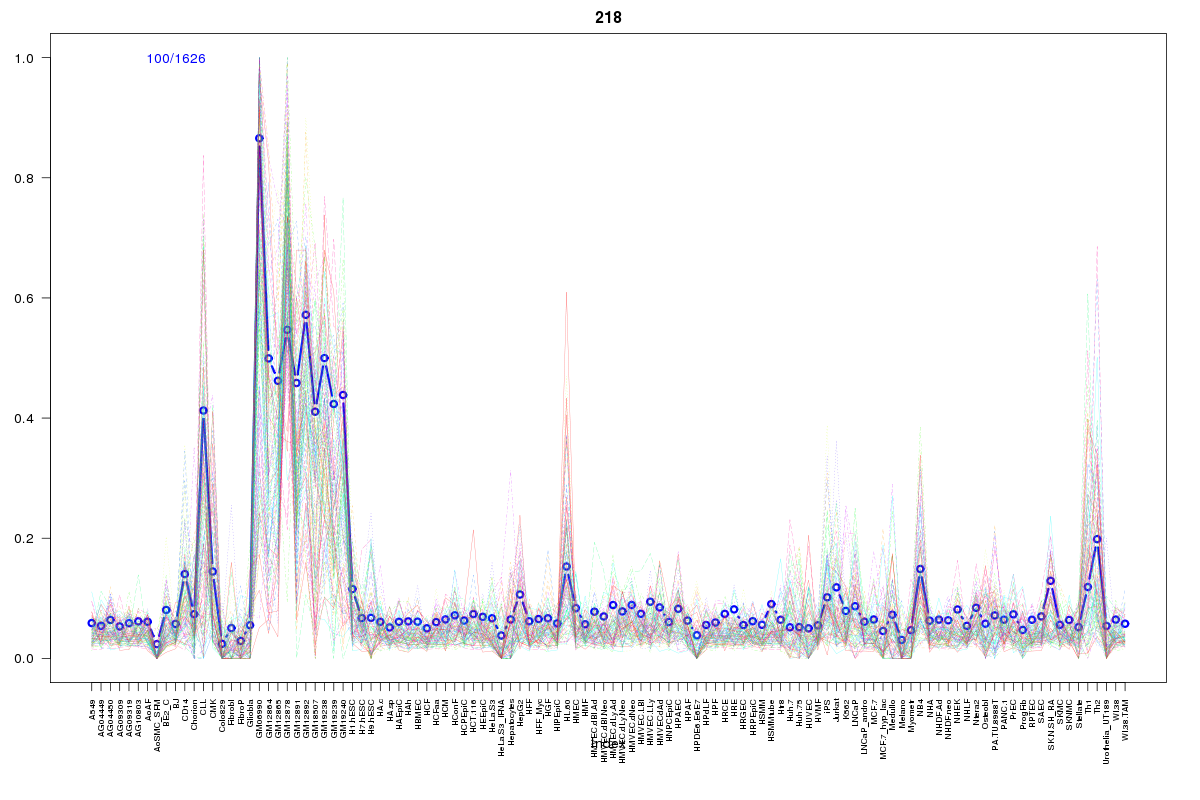 | 218 | 1 |
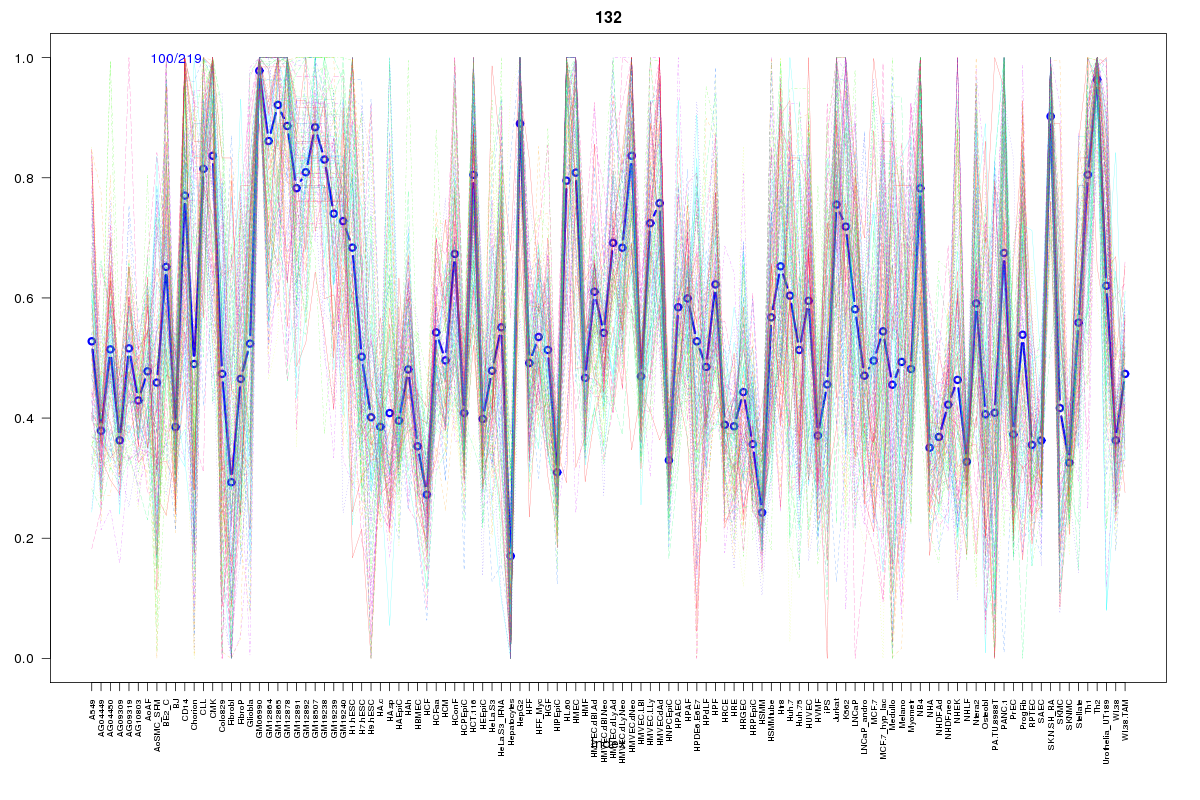 | 132 | 1 |
 | 629 | 1 |
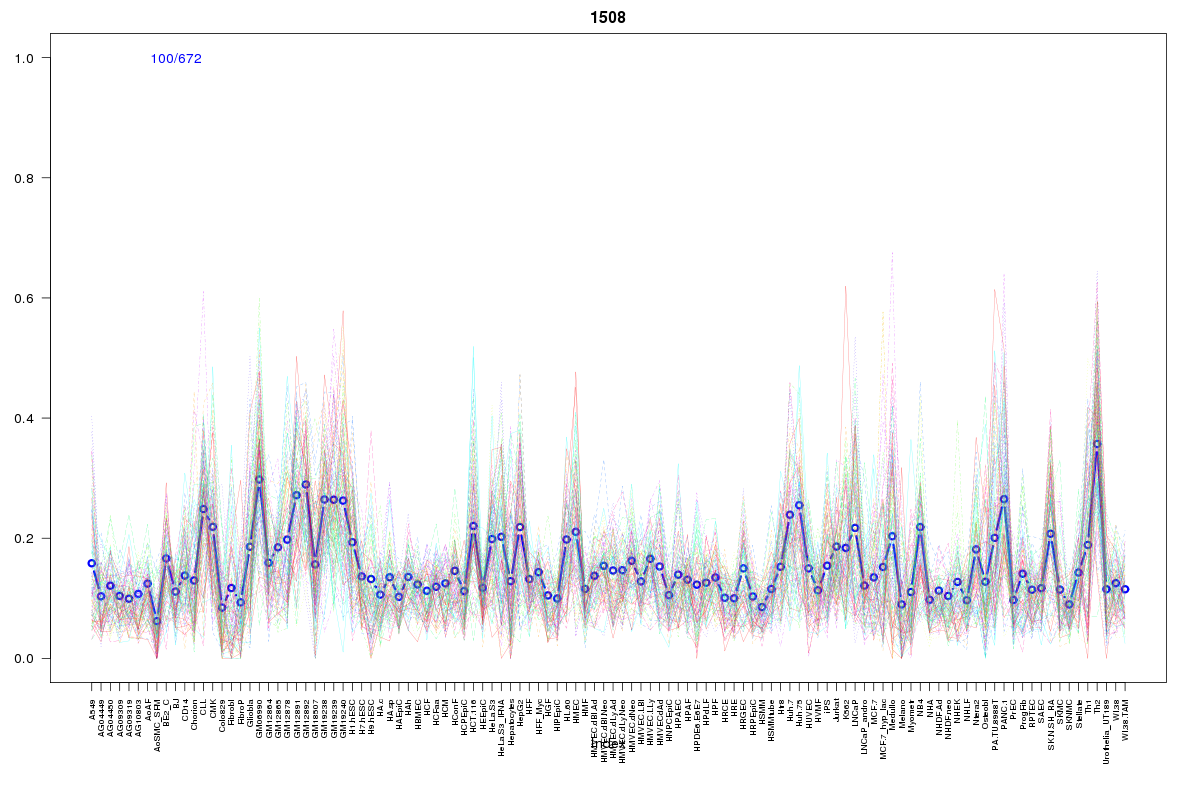 | 1508 | 1 |
 | 192 | 1 |
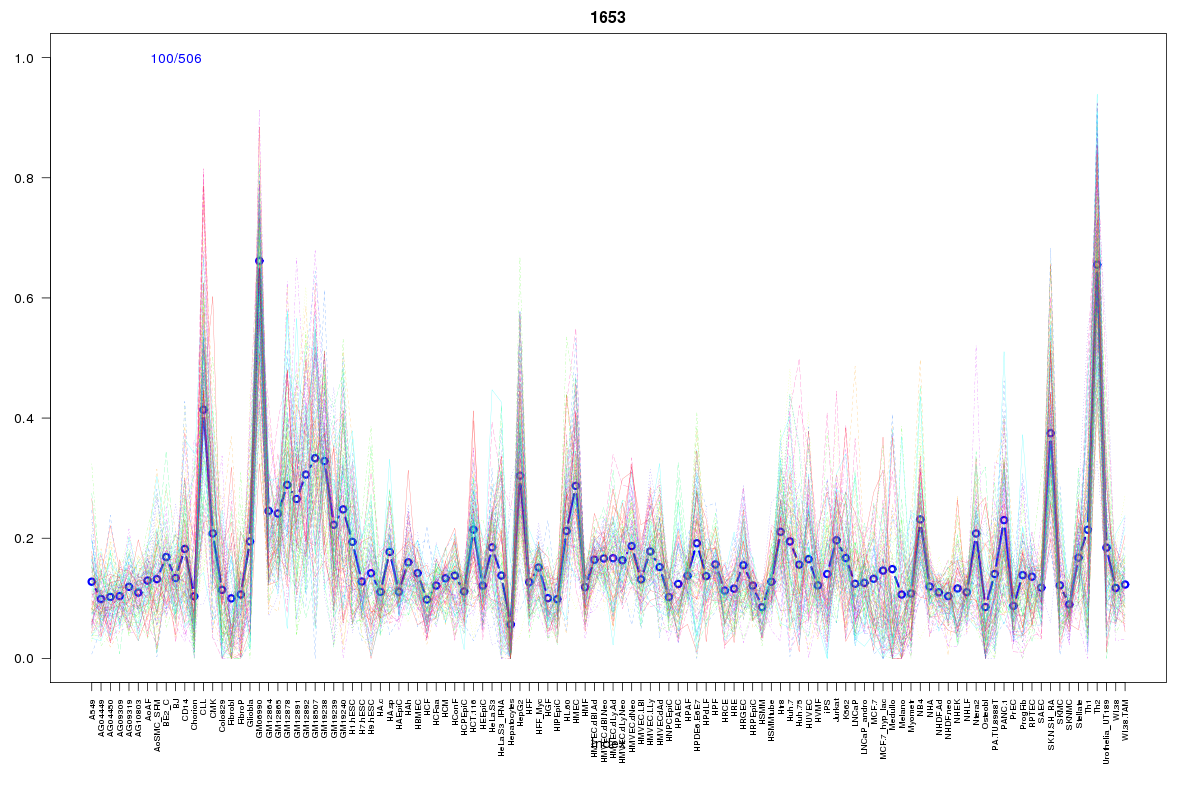 | 1653 | 1 |
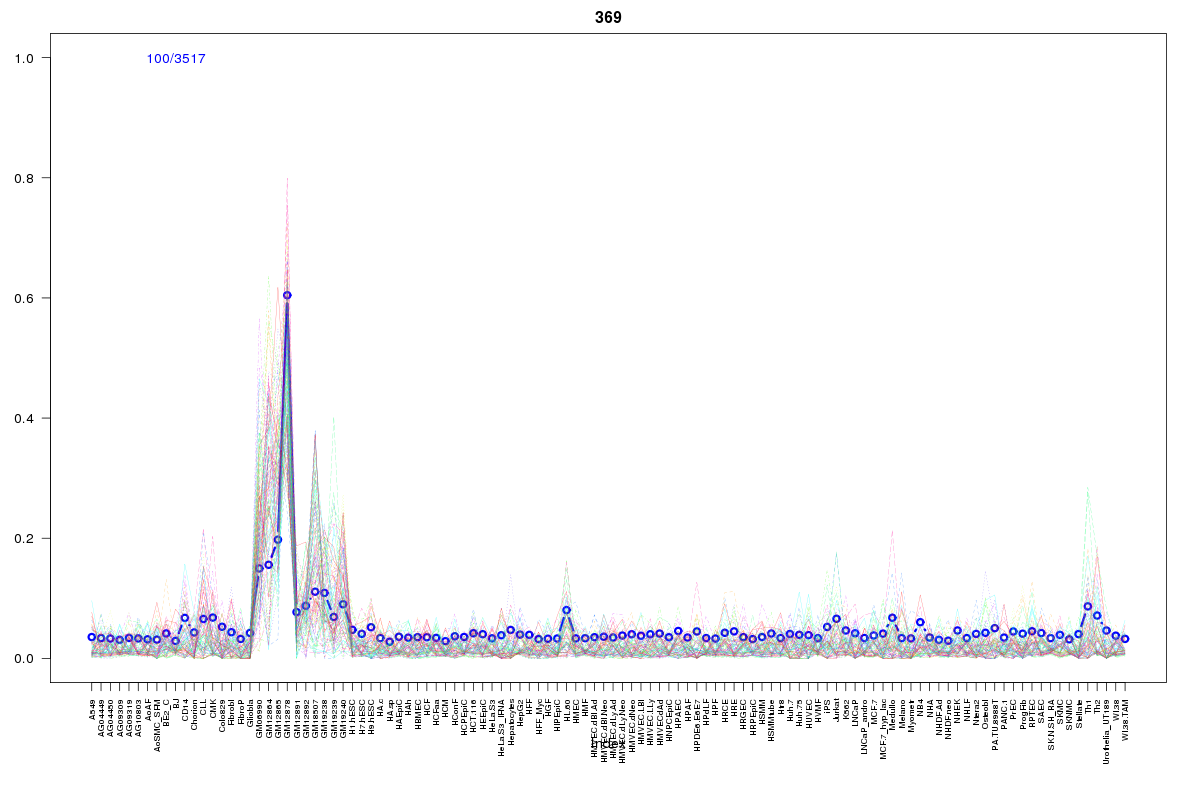 | 369 | 1 |
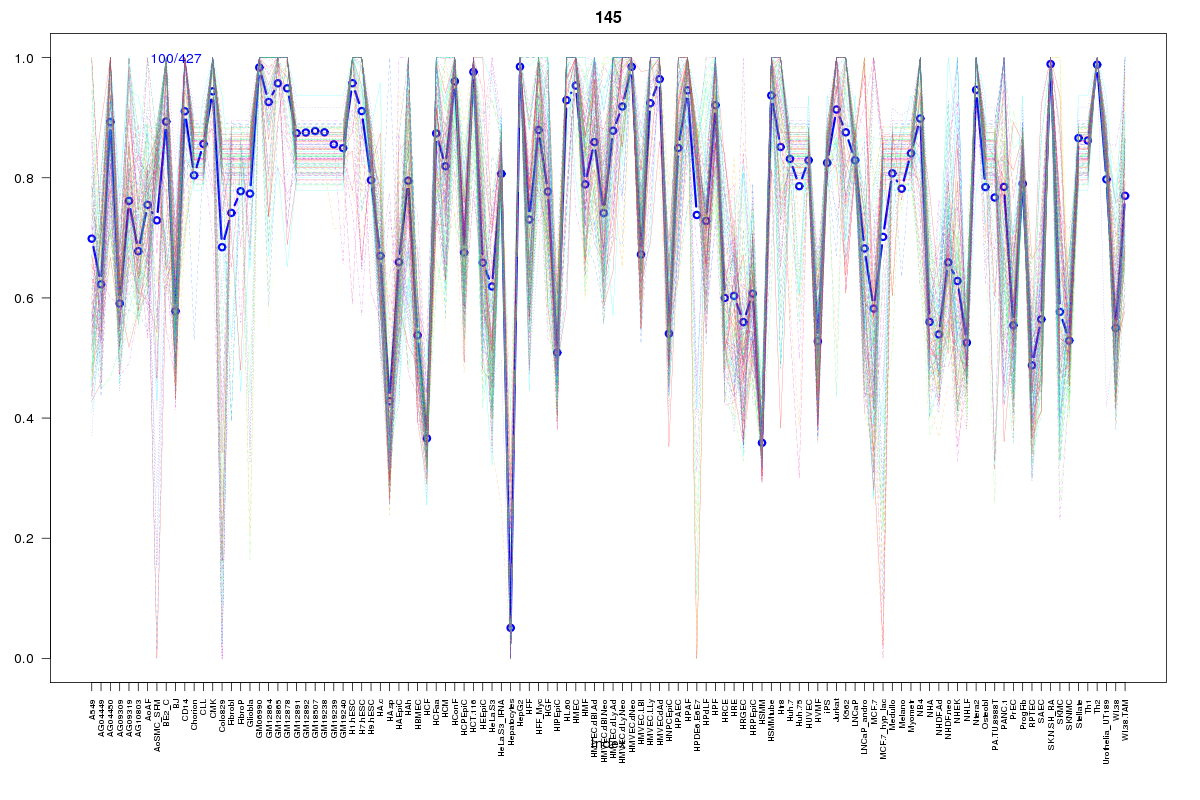 | 145 | 1 |
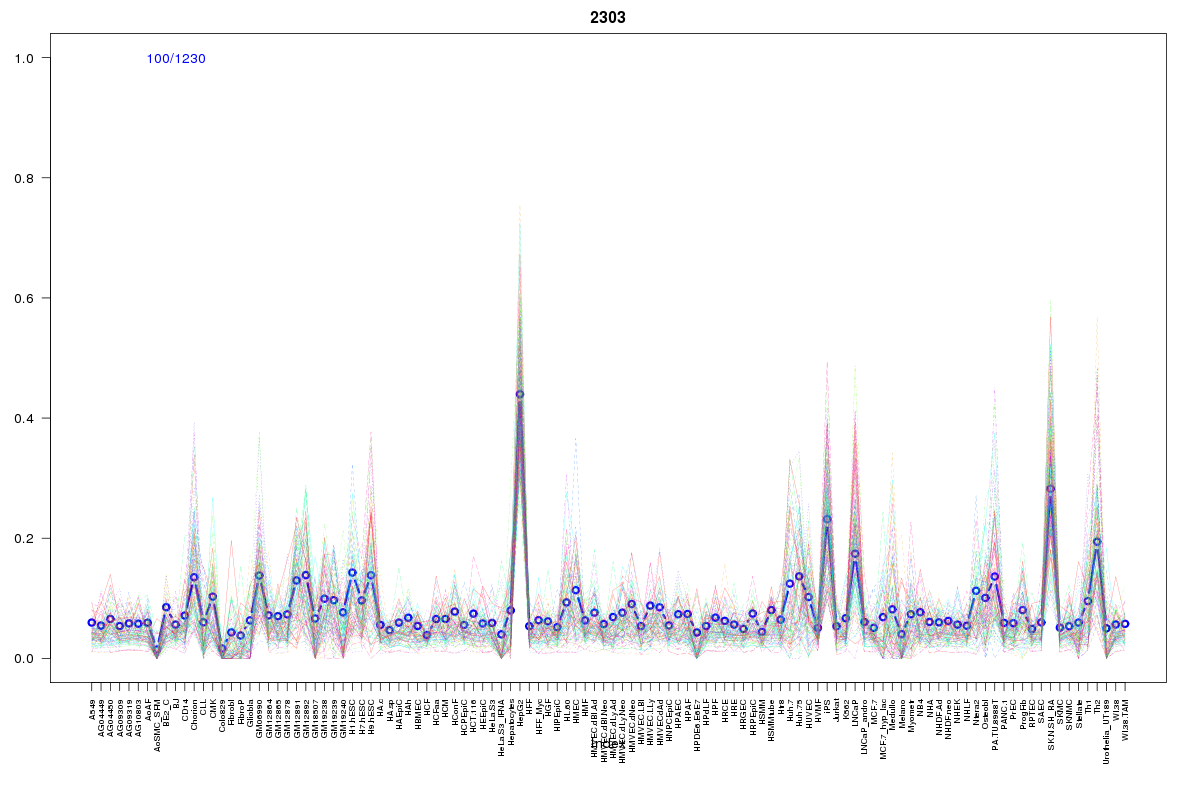 | 2303 | 1 |
 | 1404 | 1 |
 | 770 | 1 |
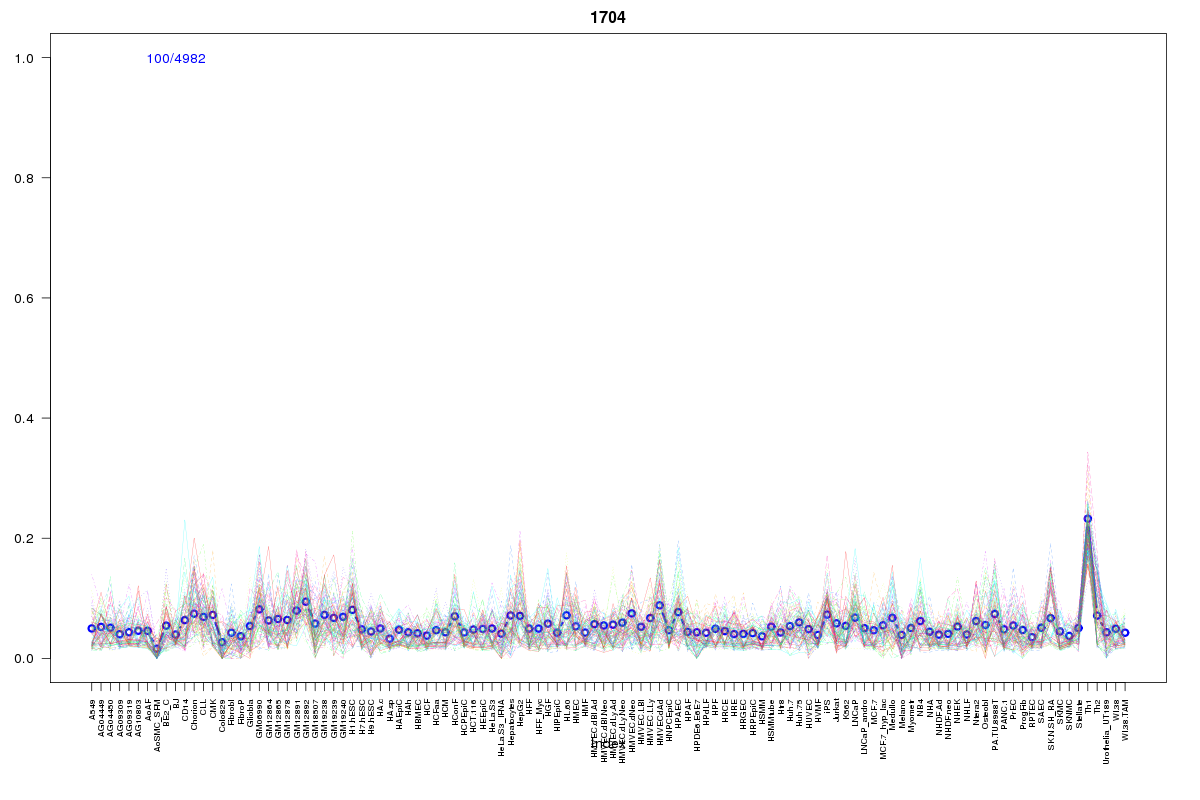 | 1704 | 1 |
Resources
BED file downloads
Connects to 16 DHS sitesTop 10 Correlated DHS Sites
p-values indiciate significant higher or lower correlation| Location | Cluster | P-value |
|---|---|---|
| chr19:53868820-53868970 | 192 | 0 |
| chr19:54040760-54040910 | 1305 | 0.002 |
| chr19:54024405-54024555 | 1404 | 0.003 |
| chr19:54041100-54041250 | 433 | 0.003 |
| chr19:54040925-54041075 | 420 | 0.004 |
| chr19:53971445-53971595 | 2303 | 0.007 |
| chr19:53869400-53869550 | 369 | 0.008 |
| chr19:54041665-54041815 | 218 | 0.012 |
| chr19:54041380-54041530 | 183 | 0.014 |
| chr19:53837400-53837550 | 1508 | 0.017 |
| chr19:54024785-54024935 | 1704 | 0.019 |
External Databases
UCSCEnsembl (ENSG00000241015)