Gene: GLYCTK-AS1
chr3: 52322598-52333040Expression Profile
(log scale)
Graphical Connections
Distribution of linked clusters:
You may find it interesting if many of the connected DHS sites belong to the same cluster.| Cluster Profile | Cluster ID | Number of DHS sites in this cluster |
|---|---|---|
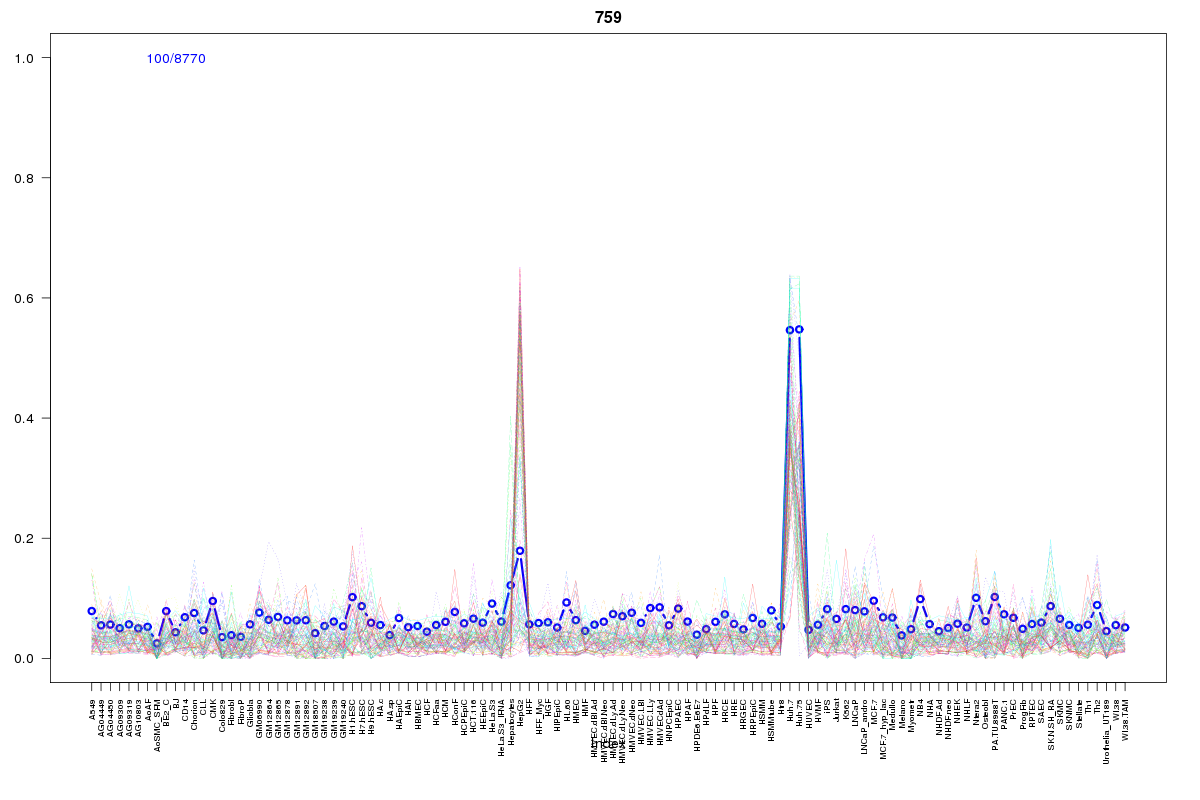 | 759 | 3 |
 | 1970 | 2 |
 | 570 | 2 |
 | 1078 | 2 |
 | 881 | 2 |
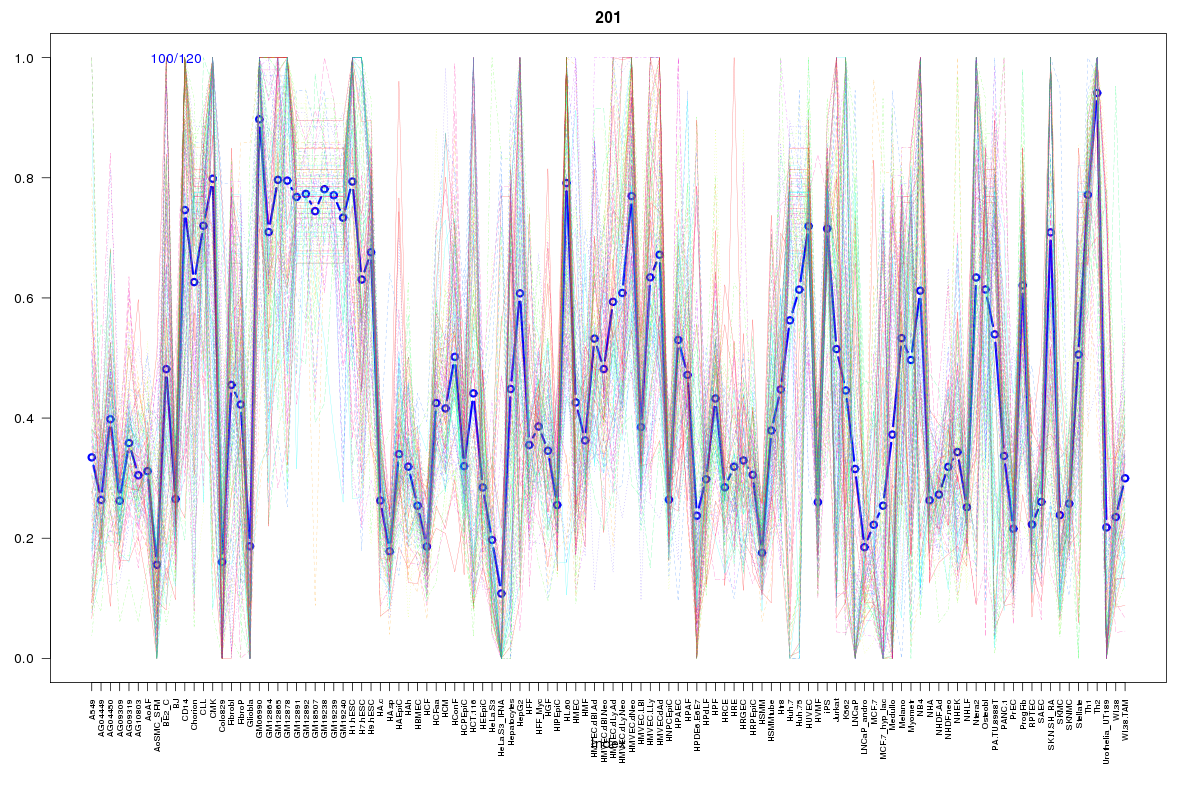 | 201 | 1 |
 | 2122 | 1 |
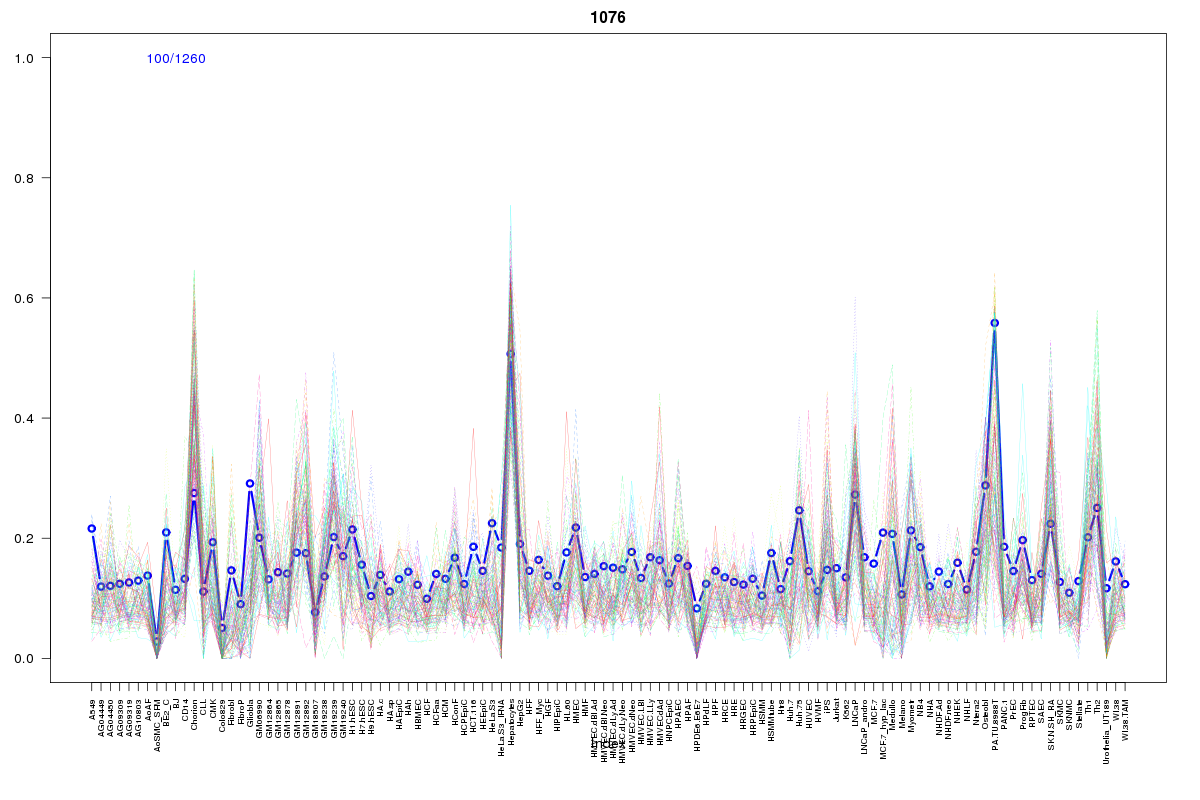 | 1076 | 1 |
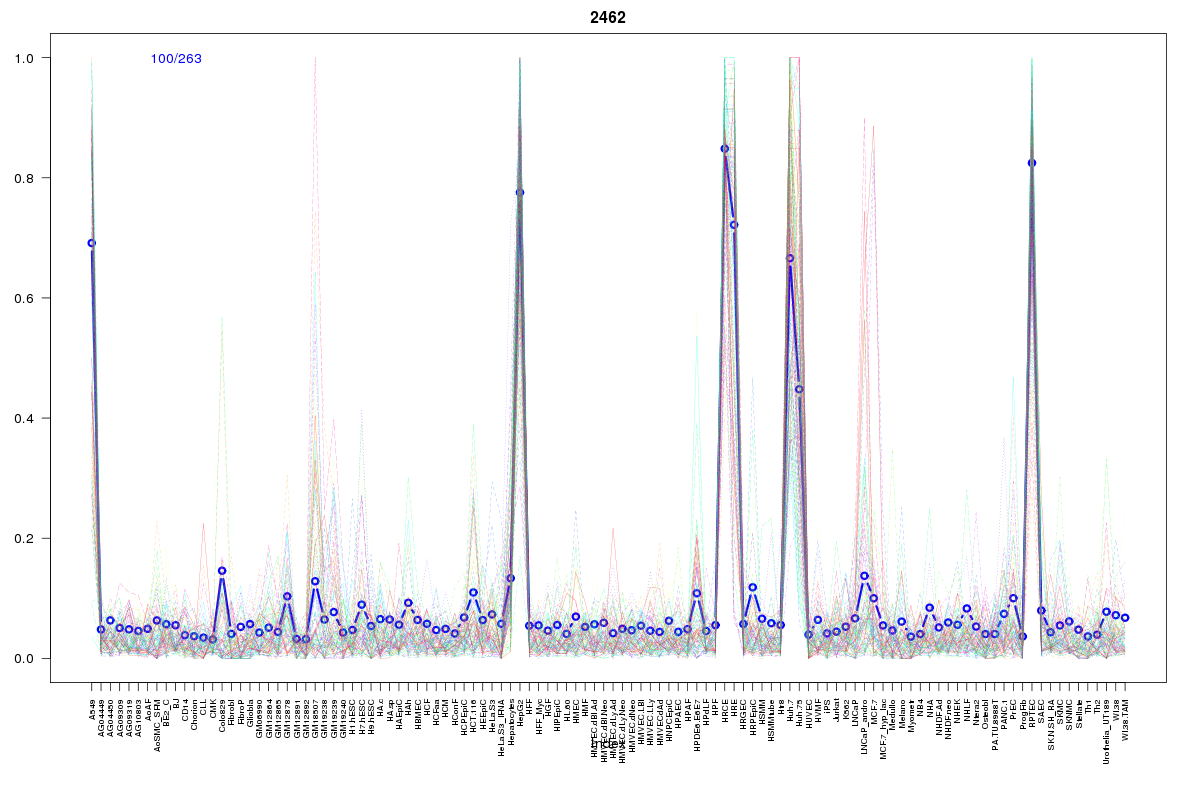 | 2462 | 1 |
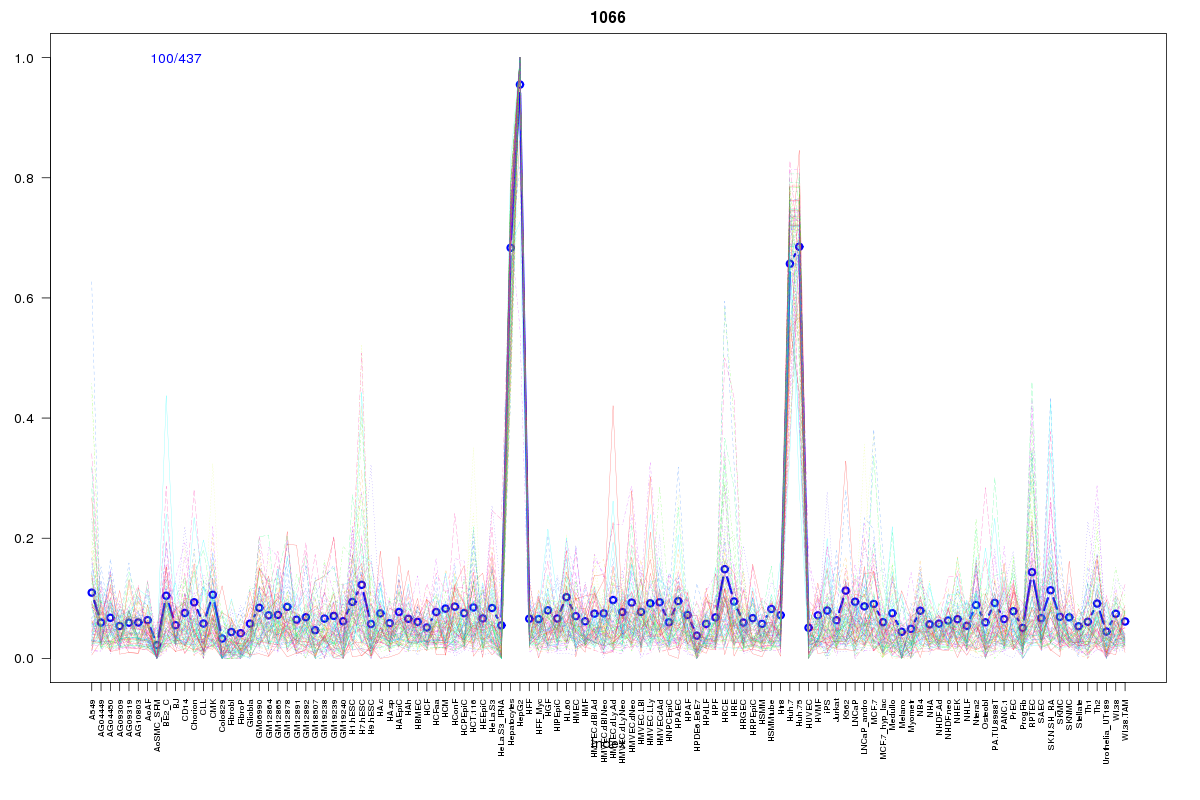 | 1066 | 1 |
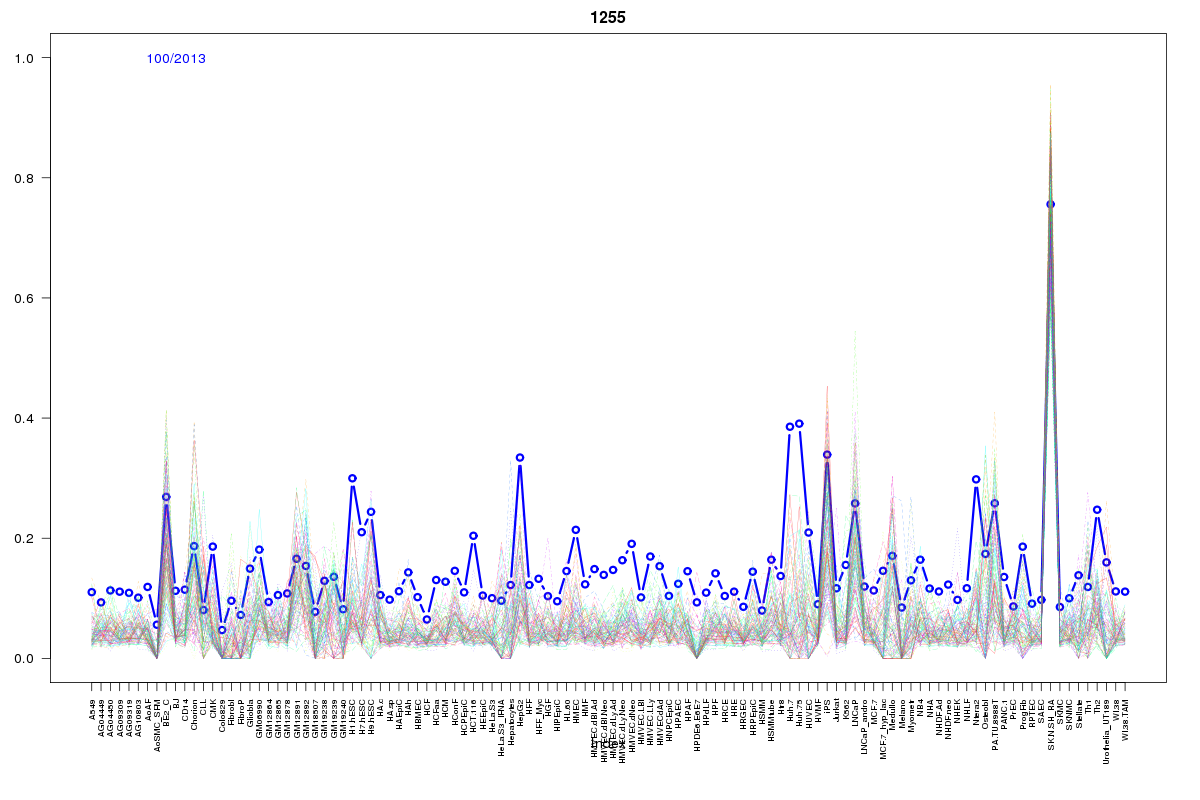 | 1255 | 1 |
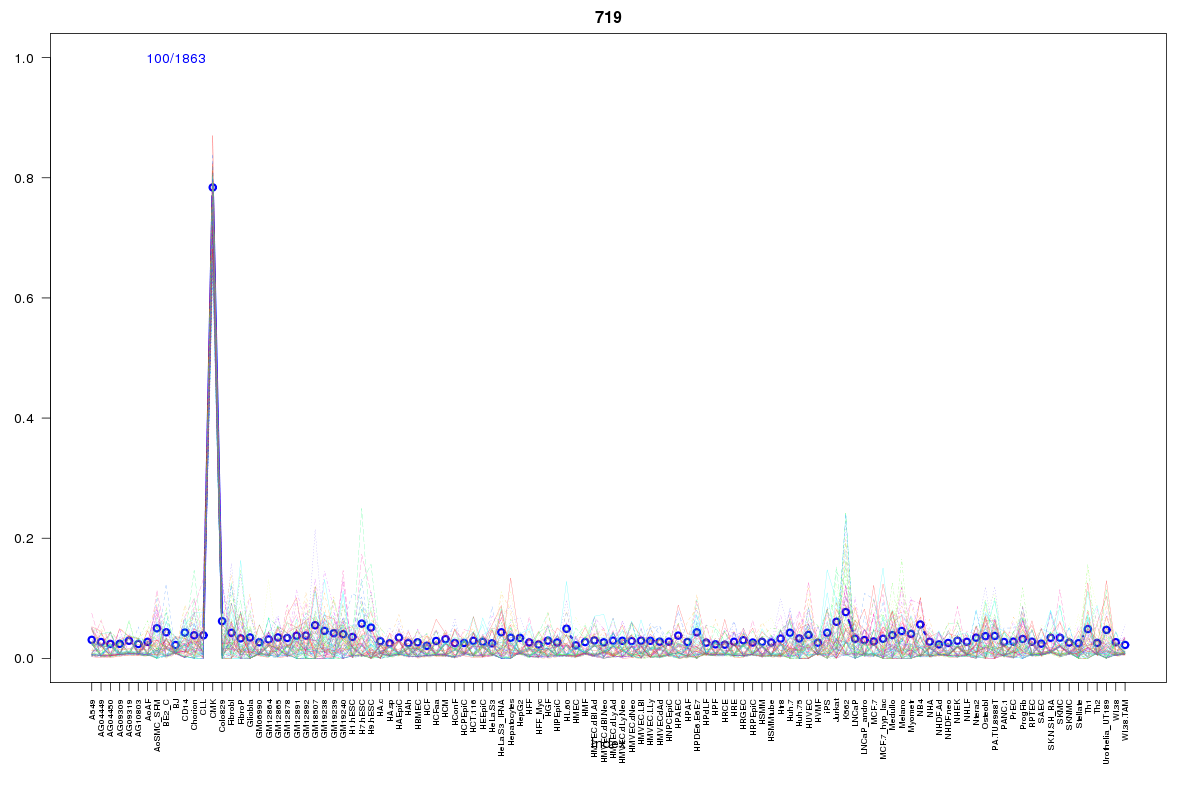 | 719 | 1 |
 | 655 | 1 |
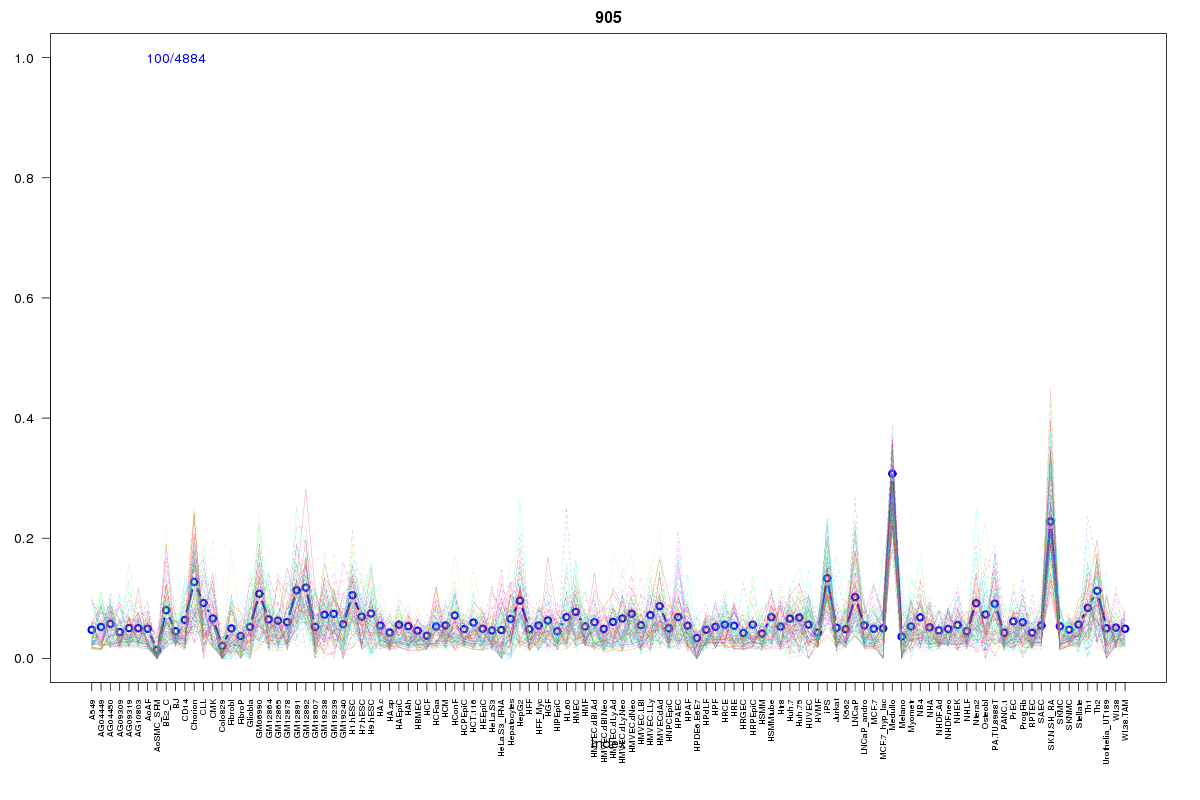 | 905 | 1 |
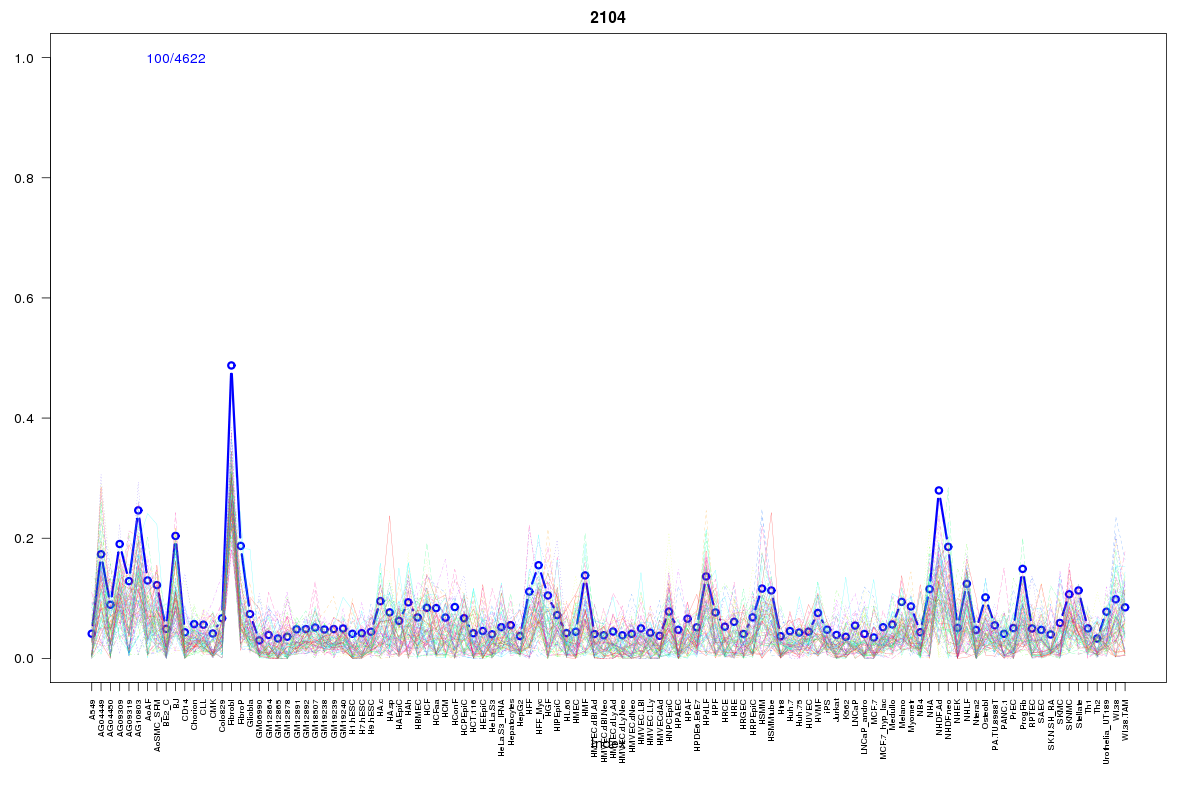 | 2104 | 1 |
 | 568 | 1 |
 | 1008 | 1 |
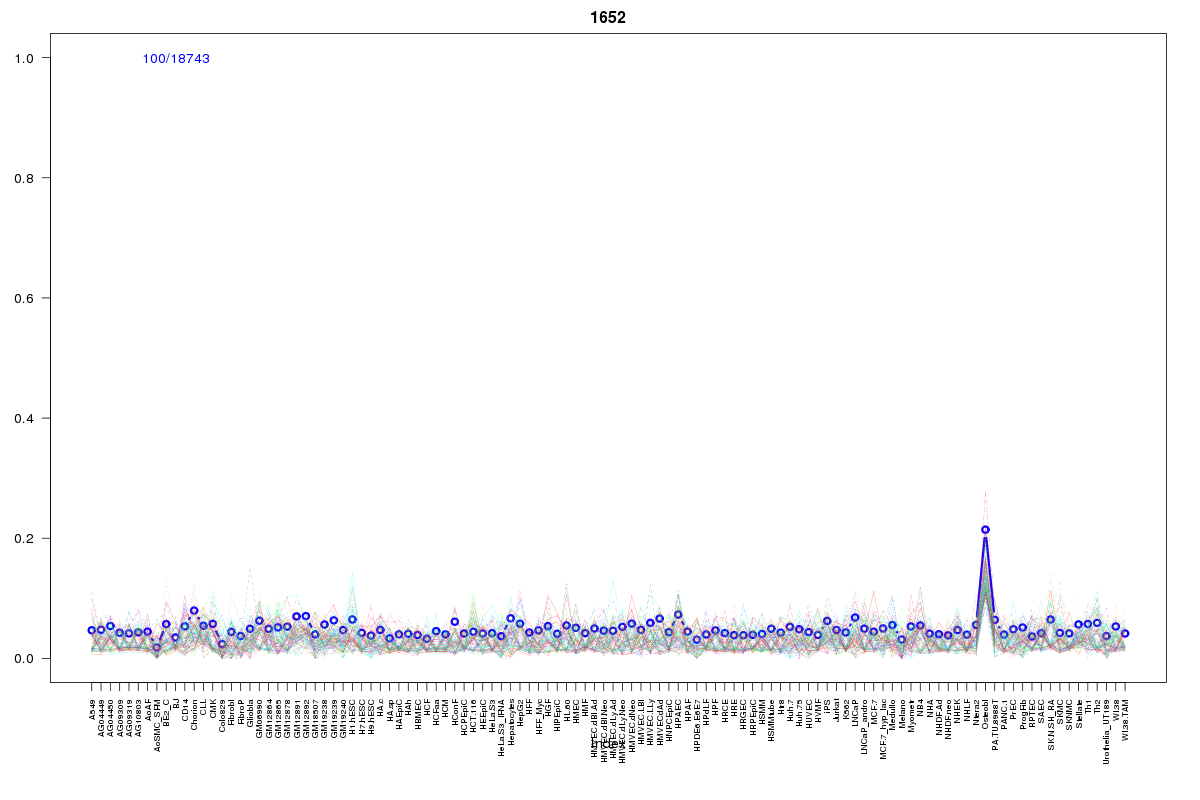 | 1652 | 1 |
Resources
BED file downloads
Connects to 24 DHS sitesTop 10 Correlated DHS Sites
p-values indiciate significant higher or lower correlation| Location | Cluster | P-value |
|---|---|---|
| chr3:52332245-52332395 | 759 | 0 |
| chr3:52428945-52429095 | 1078 | 0.003 |
| chr3:52256440-52256590 | 881 | 0.003 |
| chr3:52256020-52256170 | 1078 | 0.004 |
| chr3:52265925-52266075 | 2122 | 0.009 |
| chr3:52413445-52413595 | 881 | 0.009 |
| chr3:52265620-52265770 | 201 | 0.009 |
| chr3:52280465-52280615 | 1076 | 0.01 |
| chr3:52319360-52319510 | 2462 | 0.012 |
| chr3:52323880-52324030 | 1066 | 0.013 |
| chr3:52364545-52364695 | 1970 | 0.014 |
External Databases
UCSCEnsembl (ENSG00000242797)