Gene: DCTN3
chr9: 34613547-34620477Expression Profile
(log scale)
Graphical Connections
Distribution of linked clusters:
You may find it interesting if many of the connected DHS sites belong to the same cluster.| Cluster Profile | Cluster ID | Number of DHS sites in this cluster |
|---|---|---|
 | 1755 | 4 |
 | 2055 | 2 |
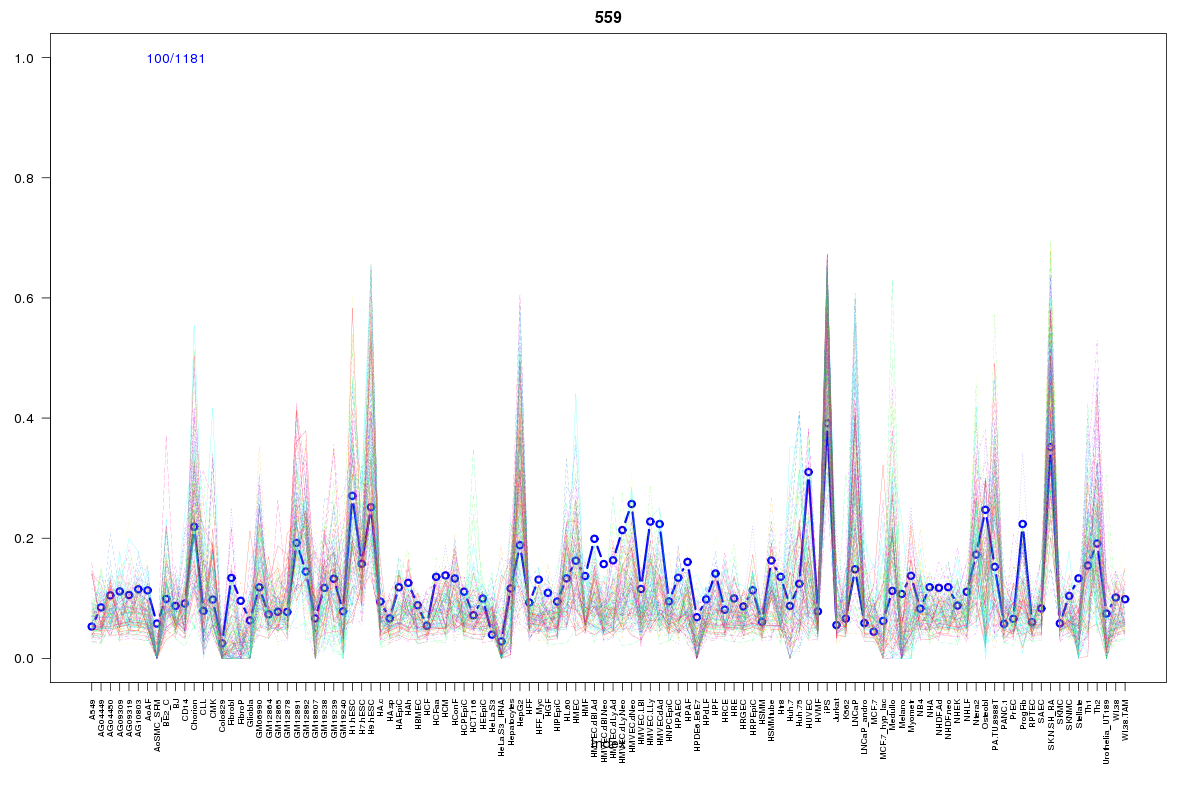 | 559 | 2 |
 | 1970 | 2 |
 | 430 | 2 |
 | 2059 | 2 |
 | 110 | 1 |
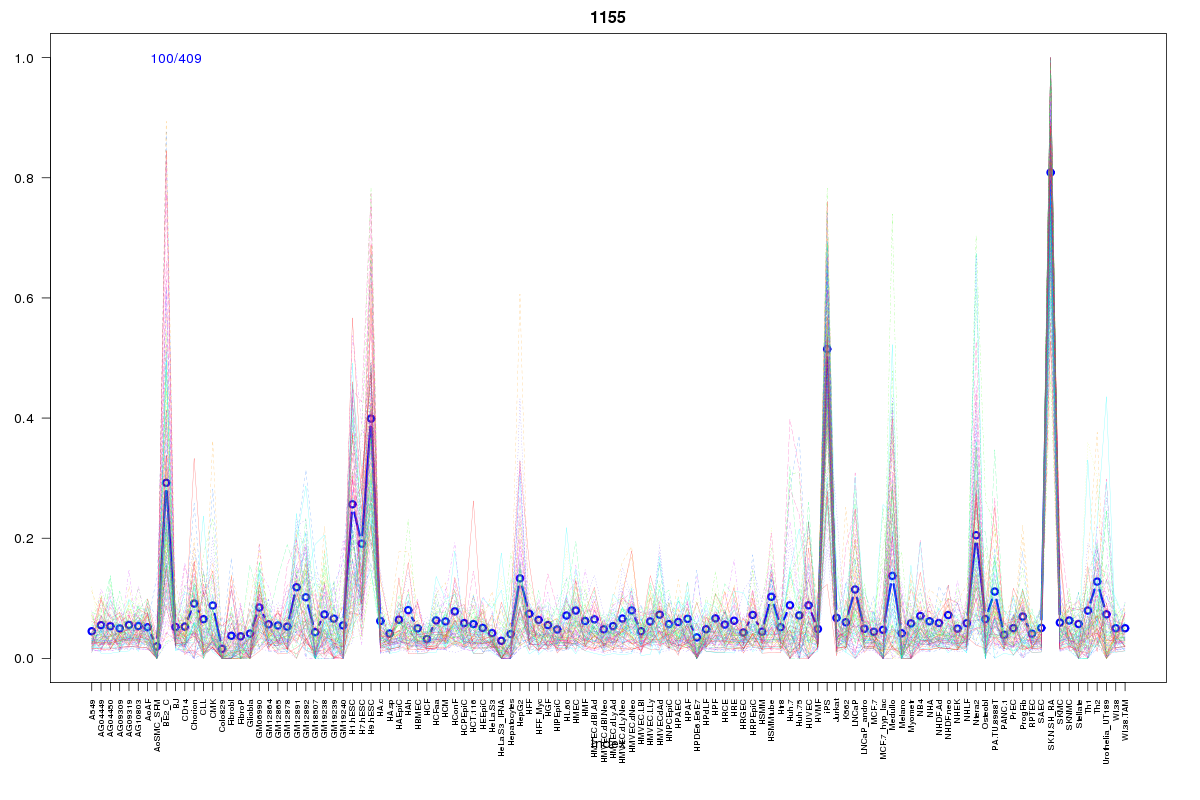 | 1155 | 1 |
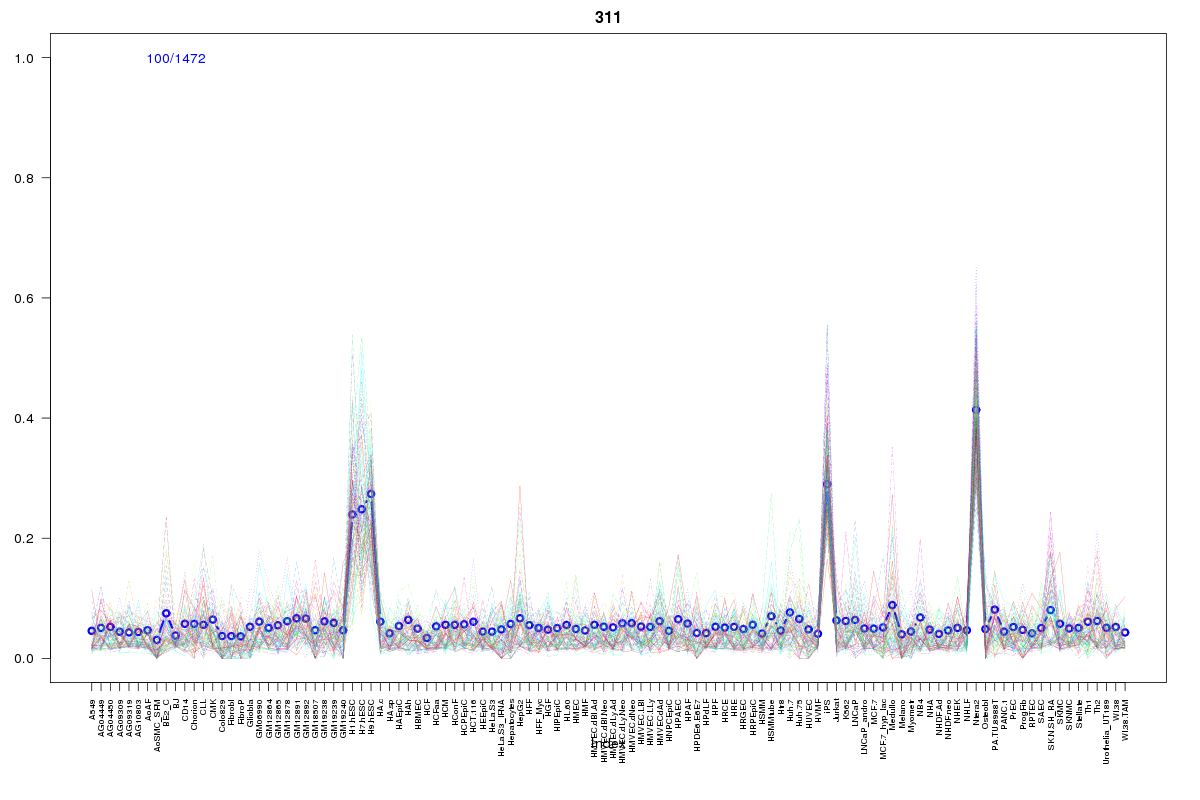 | 311 | 1 |
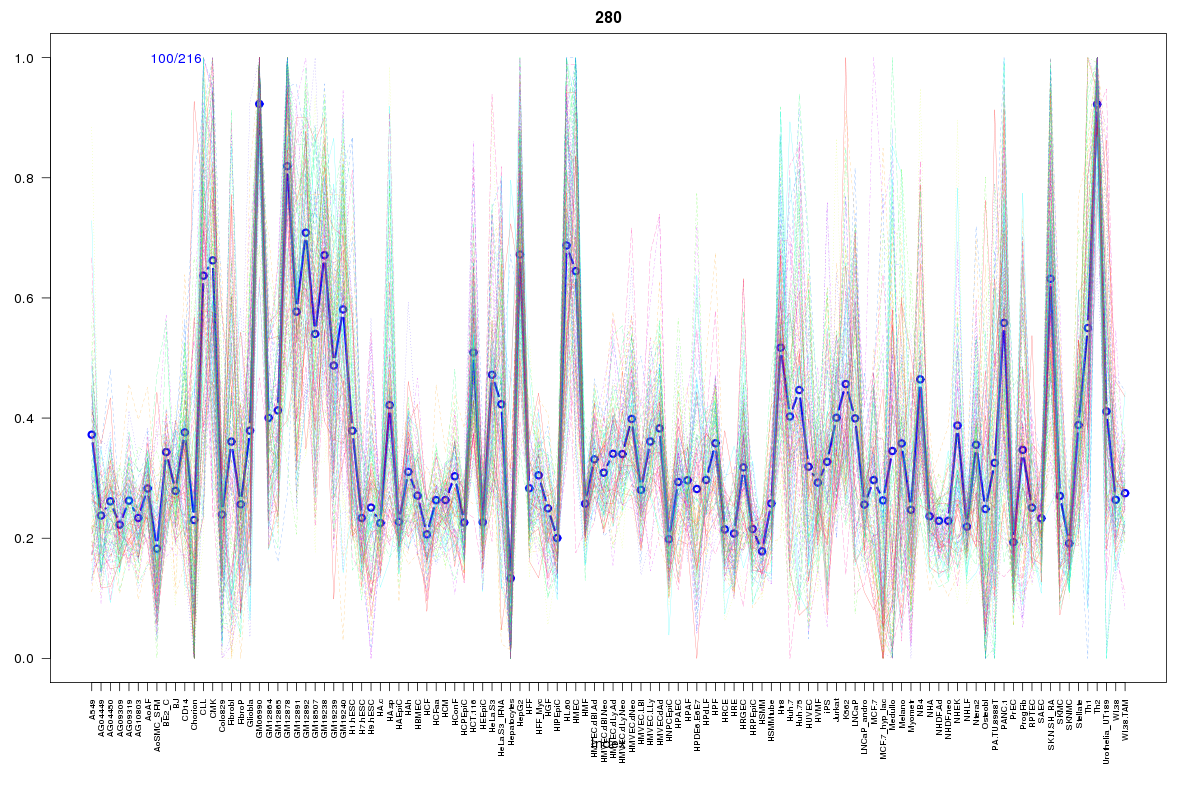 | 280 | 1 |
 | 629 | 1 |
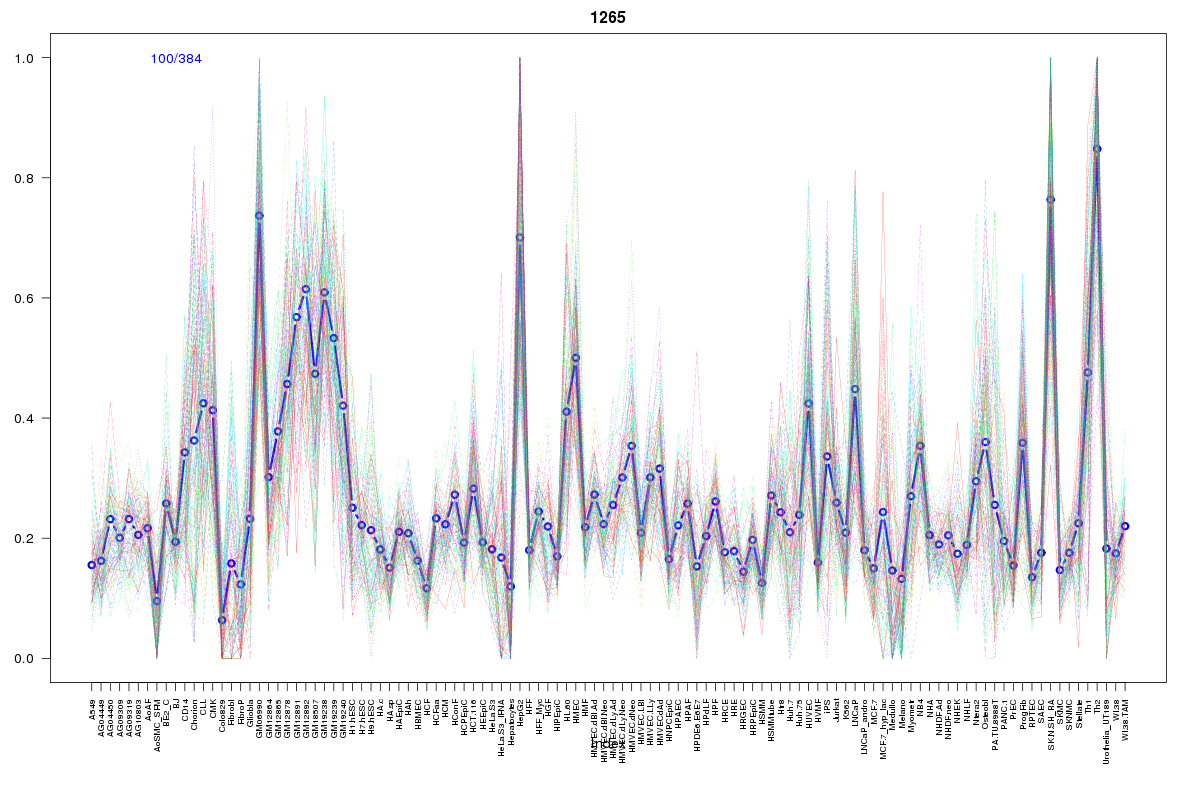 | 1265 | 1 |
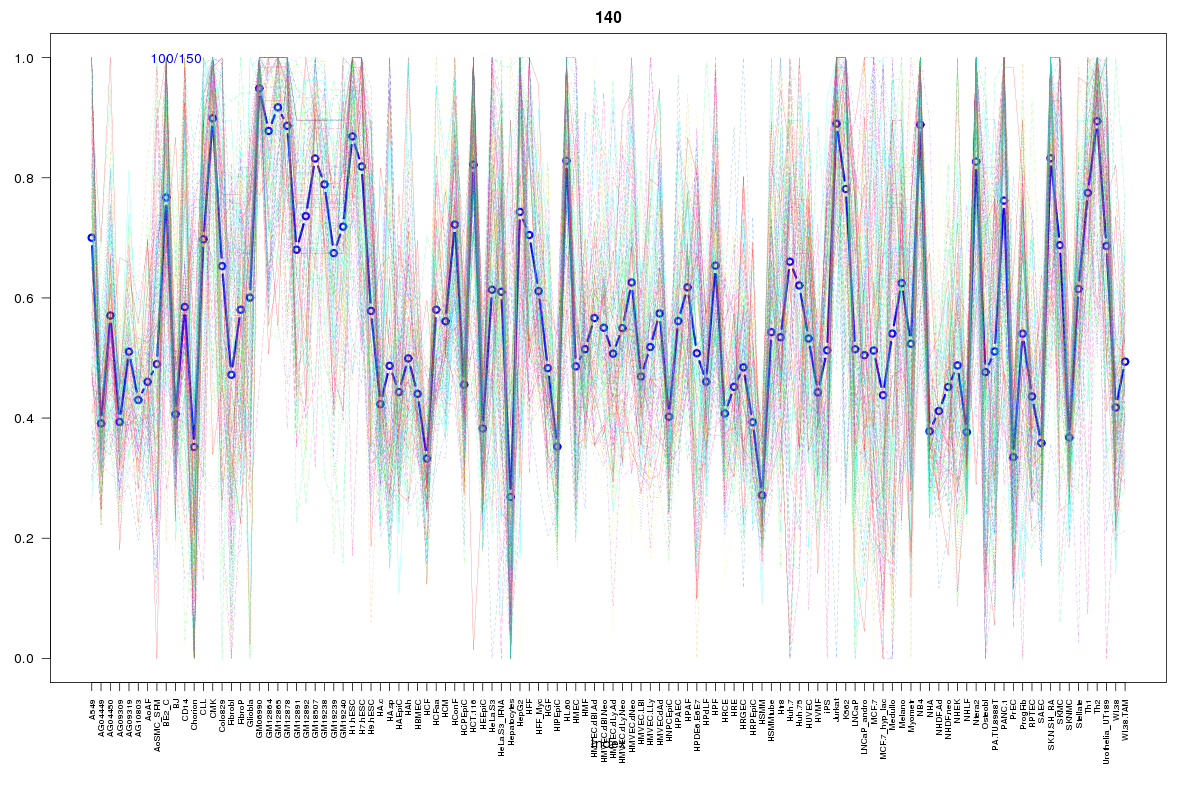 | 140 | 1 |
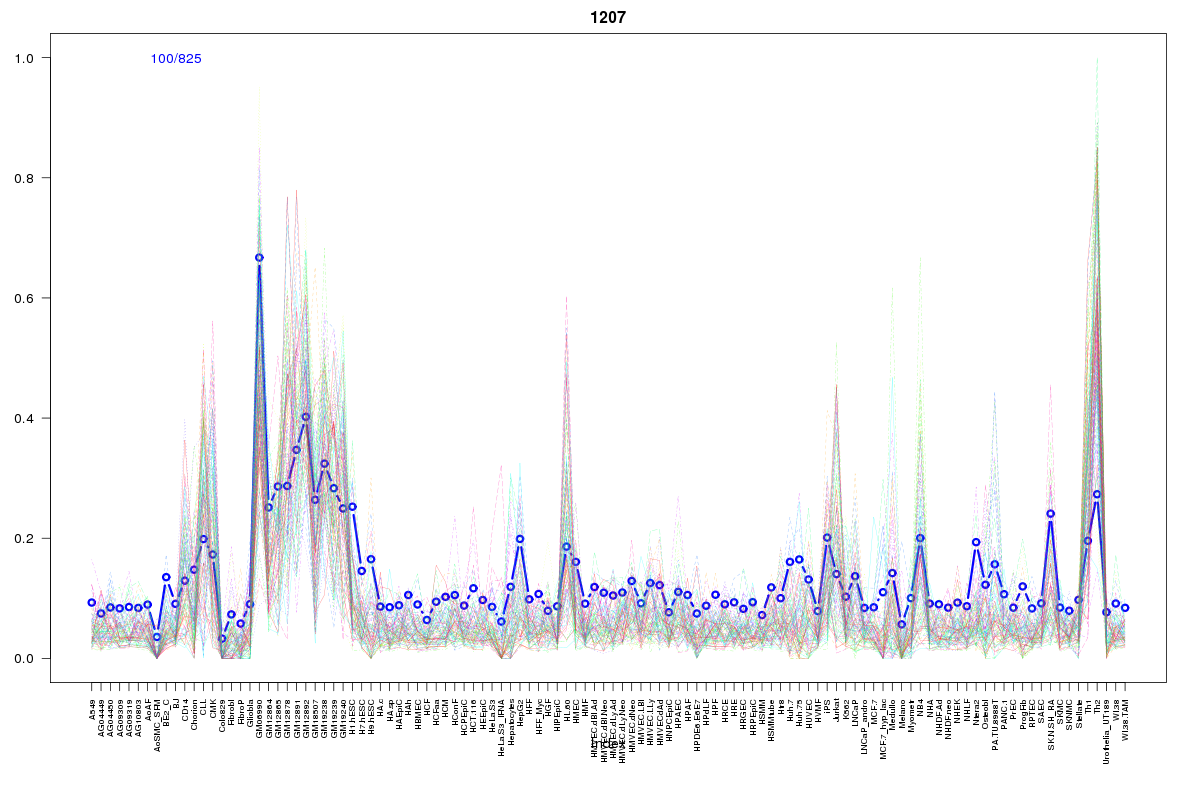 | 1207 | 1 |
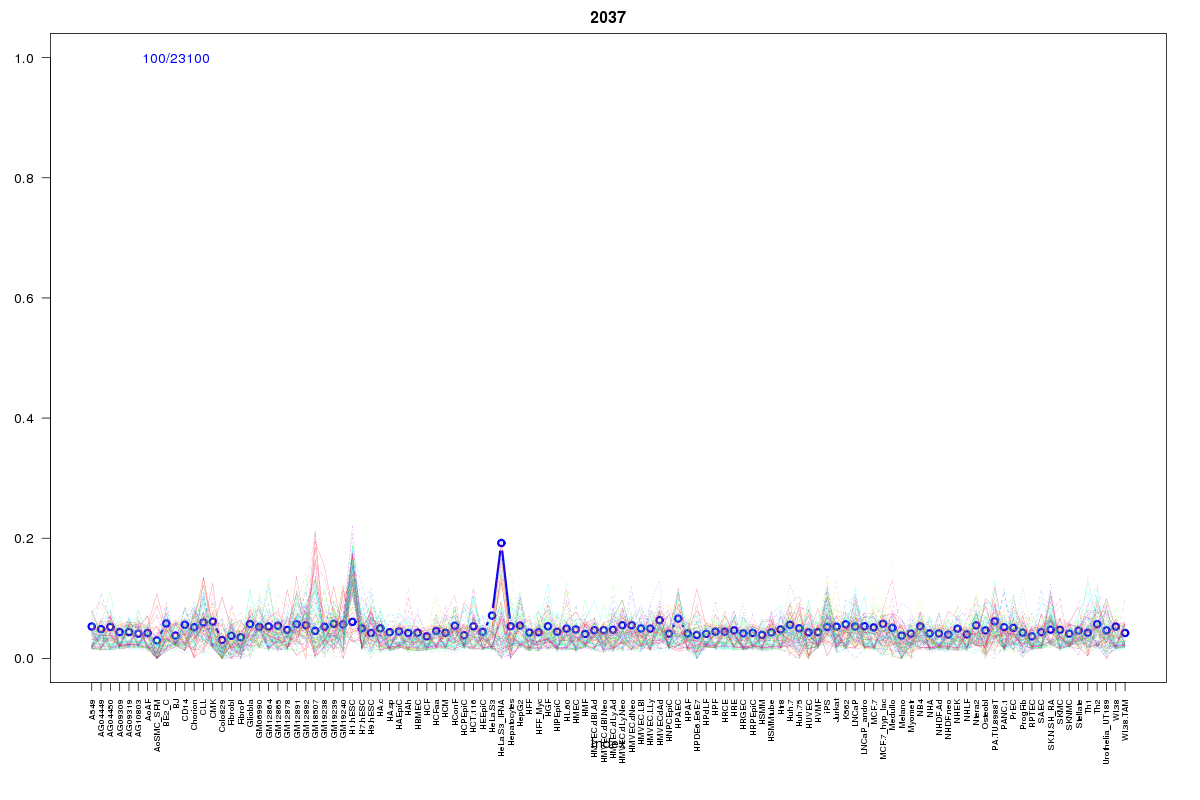 | 2037 | 1 |
Resources
BED file downloads
Connects to 23 DHS sitesTop 10 Correlated DHS Sites
p-values indiciate significant higher or lower correlation| Location | Cluster | P-value |
|---|---|---|
| chr9:34647925-34648075 | 1755 | 0 |
| chr9:34564545-34564695 | 1970 | 0 |
| chr9:34614985-34615135 | 1755 | 0.003 |
| chr9:34612300-34612450 | 280 | 0.003 |
| chr9:34664660-34664810 | 2059 | 0.004 |
| chr9:34708865-34709015 | 1755 | 0.007 |
| chr9:34518045-34518195 | 1755 | 0.008 |
| chr9:34637280-34637430 | 1265 | 0.015 |
| chr9:34638000-34638150 | 140 | 0.016 |
| chr9:34634220-34634370 | 2059 | 0.016 |
| chr9:34636740-34636890 | 629 | 0.016 |
External Databases
UCSCEnsembl (ENSG00000137100)