Gene: PTPLA
chr10: 17631957-17659376Expression Profile
(log scale)
Graphical Connections
Distribution of linked clusters:
You may find it interesting if many of the connected DHS sites belong to the same cluster.| Cluster Profile | Cluster ID | Number of DHS sites in this cluster |
|---|---|---|
 | 1820 | 2 |
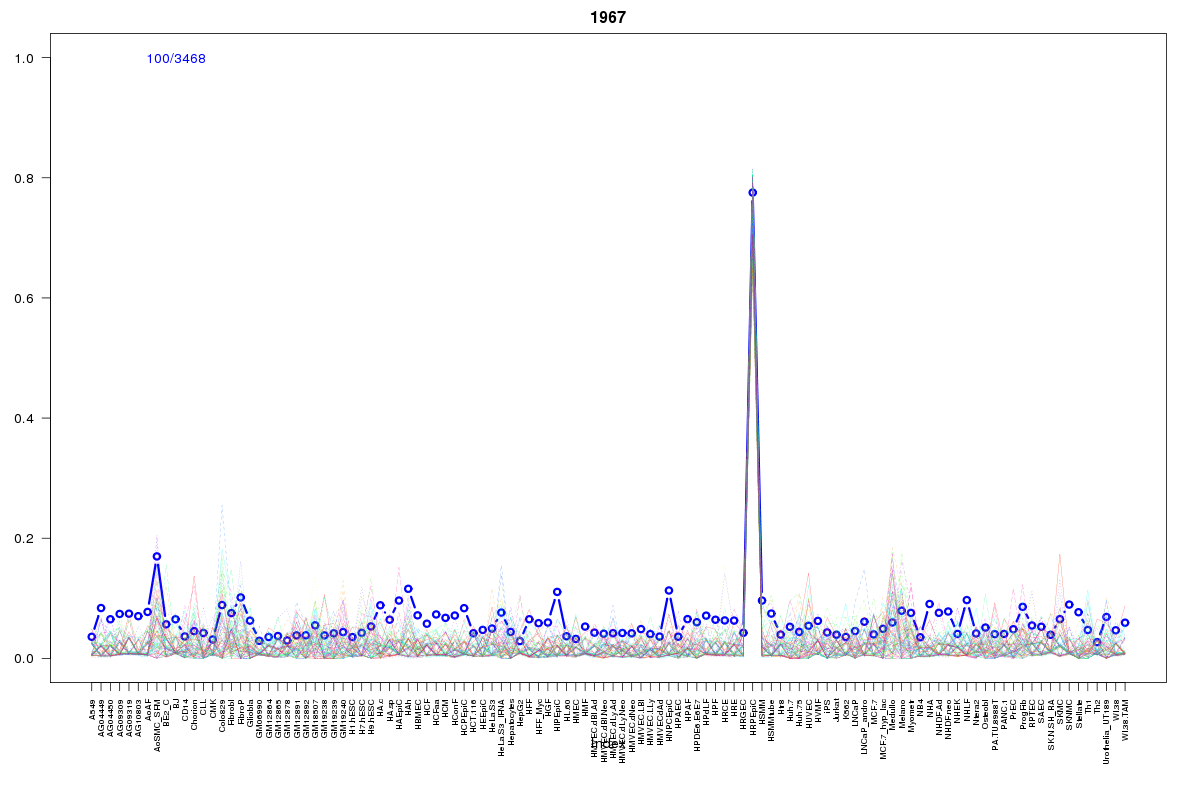 | 1967 | 2 |
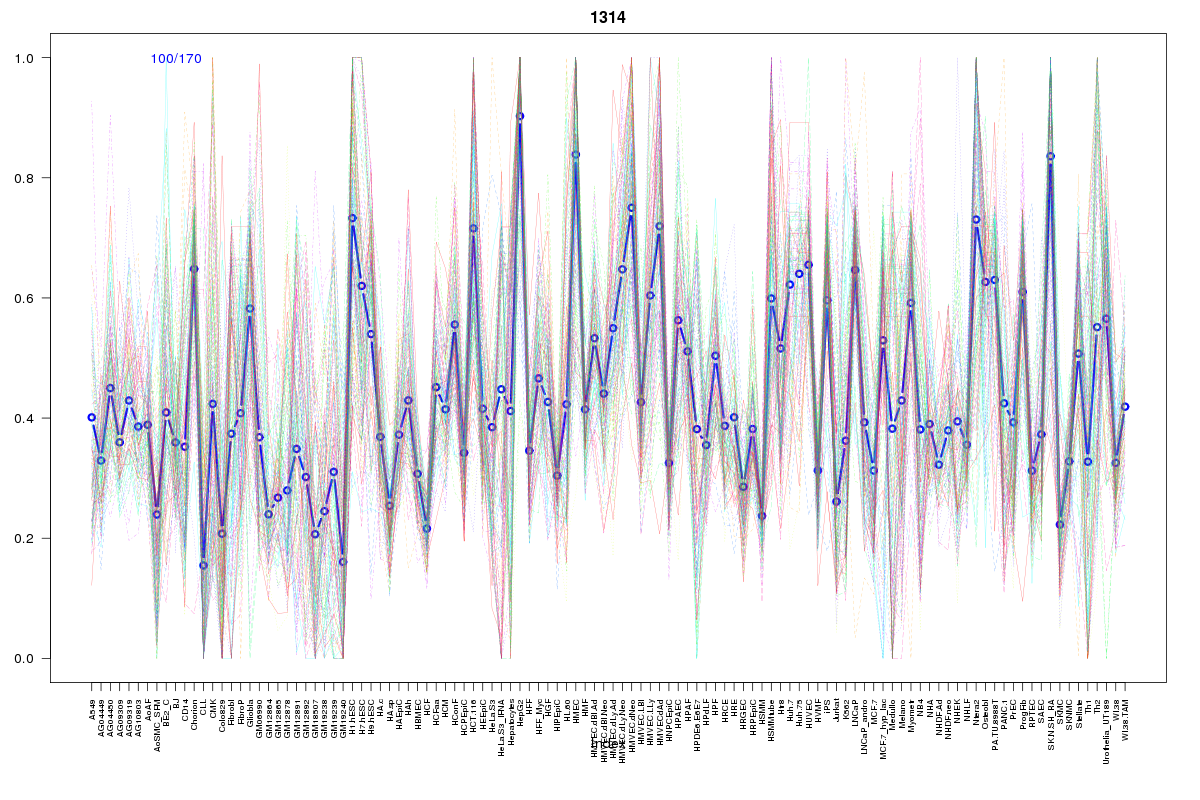 | 1314 | 1 |
 | 1143 | 1 |
 | 2143 | 1 |
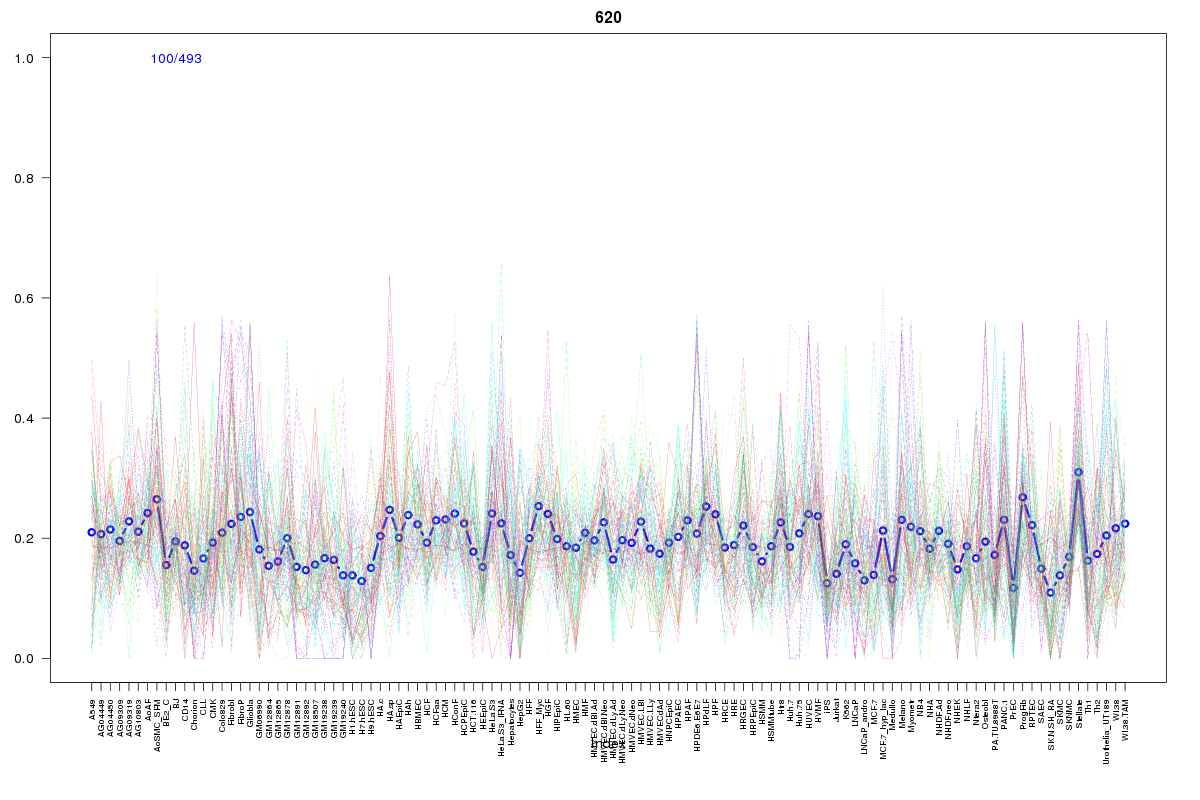 | 620 | 1 |
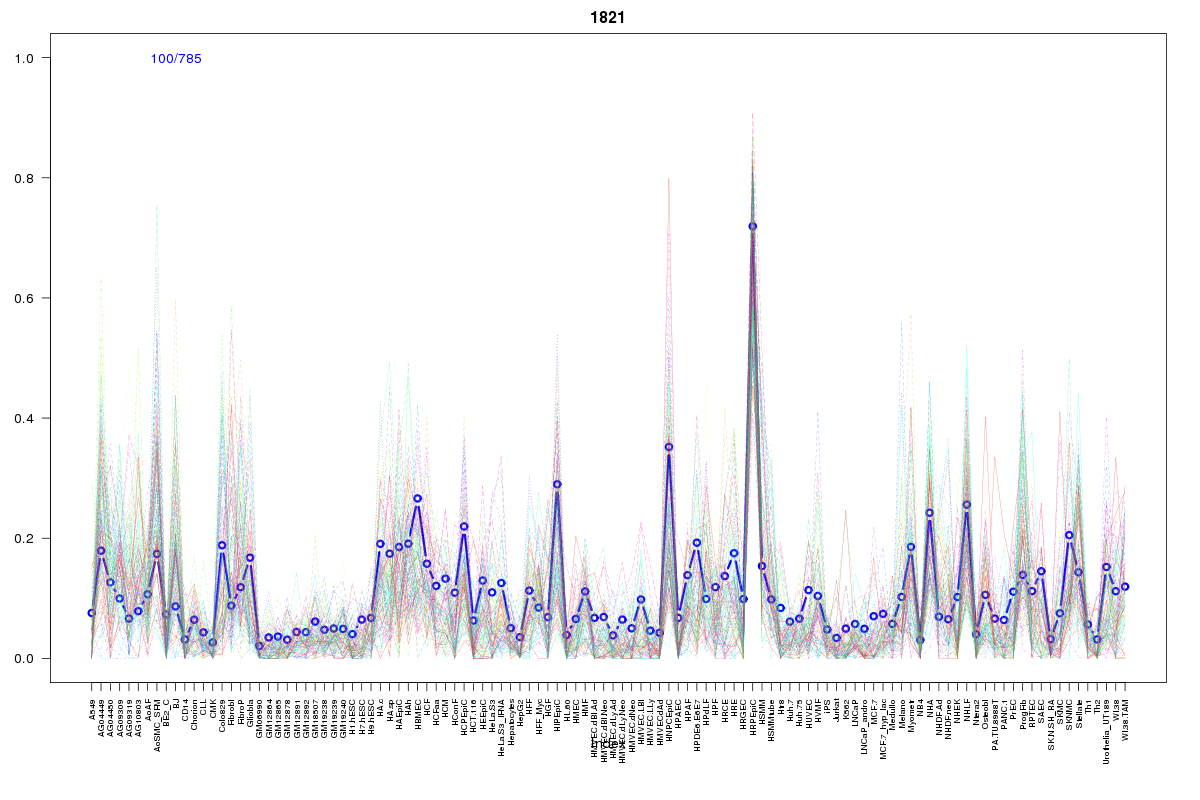 | 1821 | 1 |
 | 2052 | 1 |
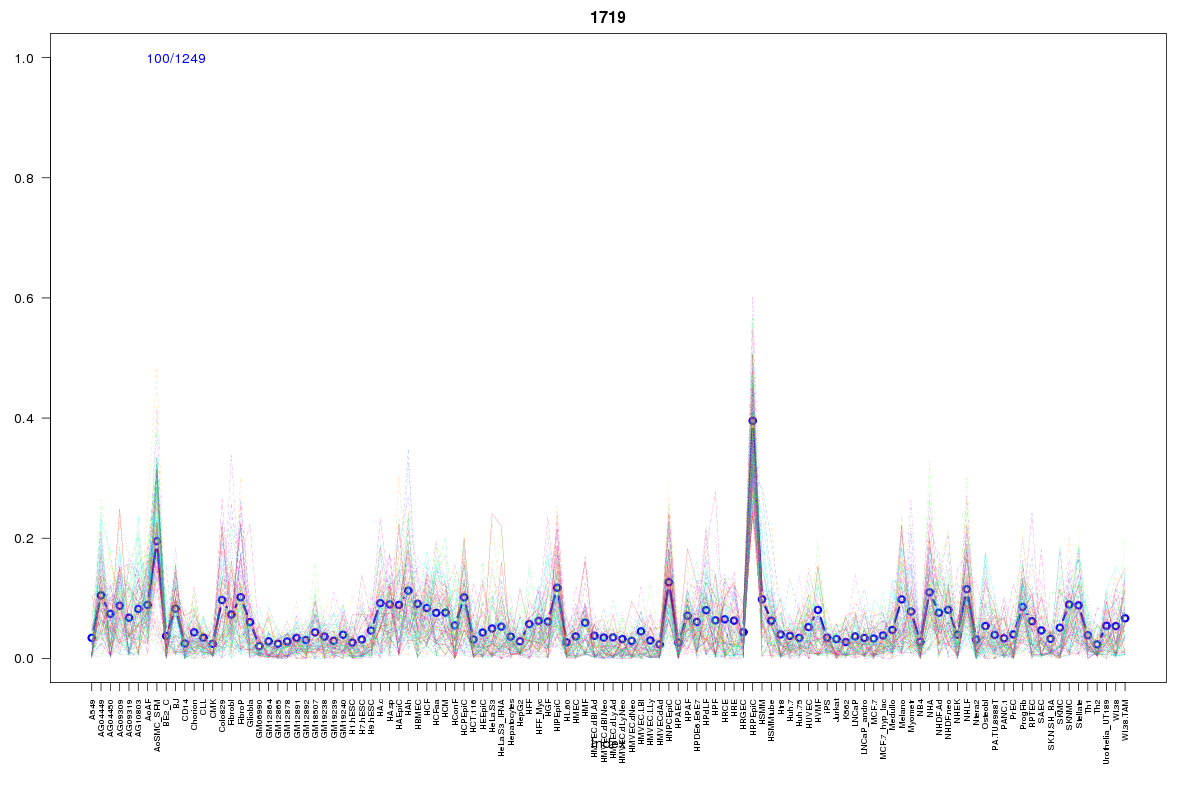 | 1719 | 1 |
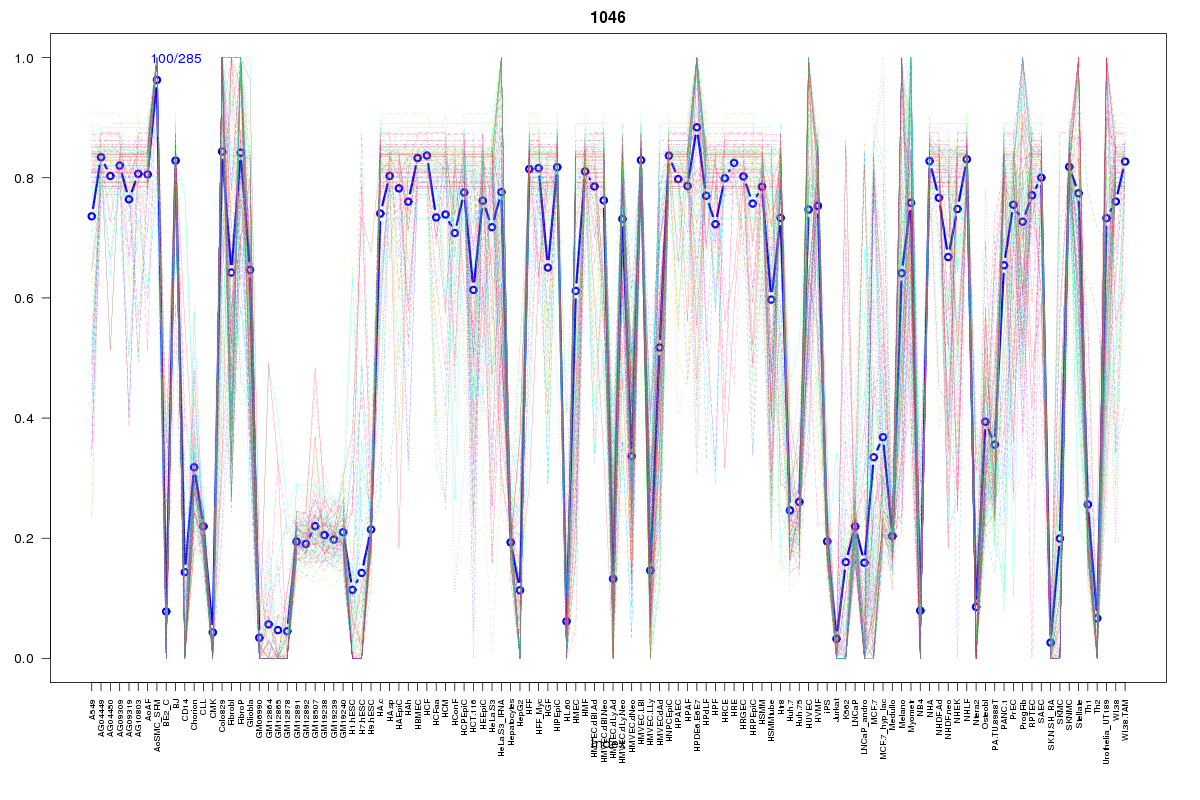 | 1046 | 1 |
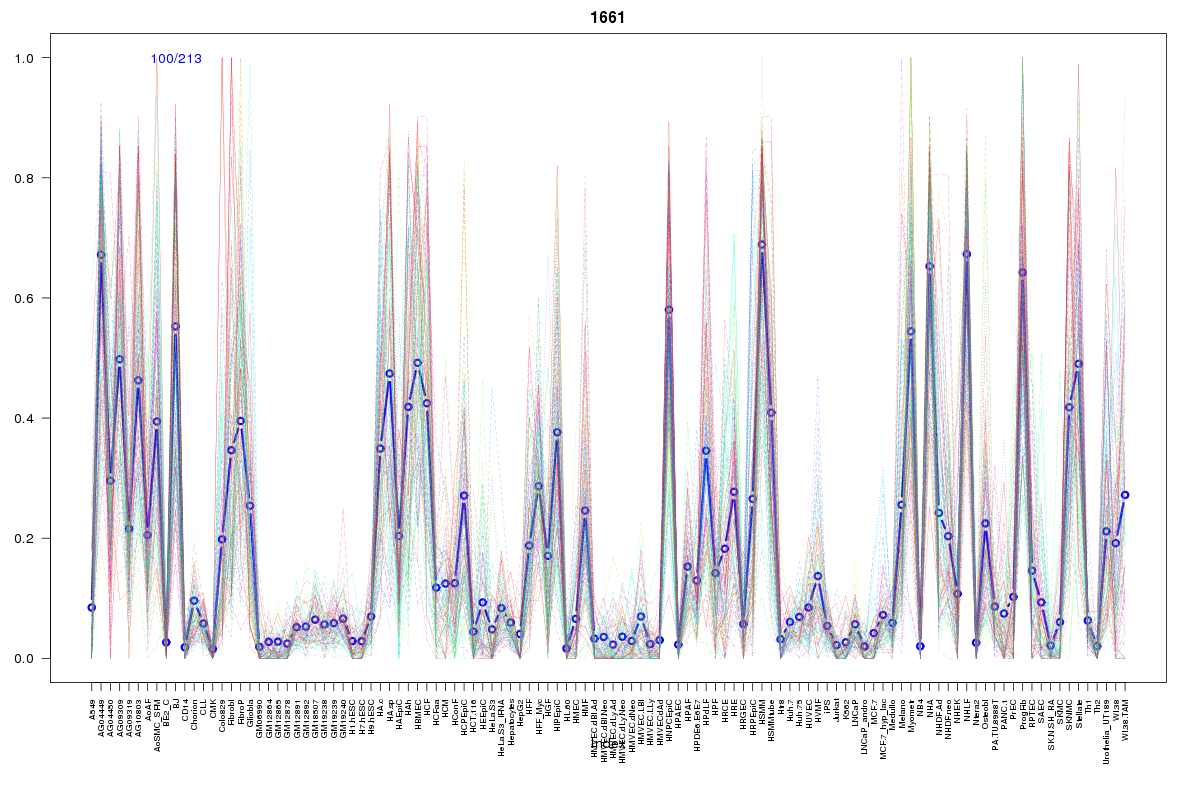 | 1661 | 1 |
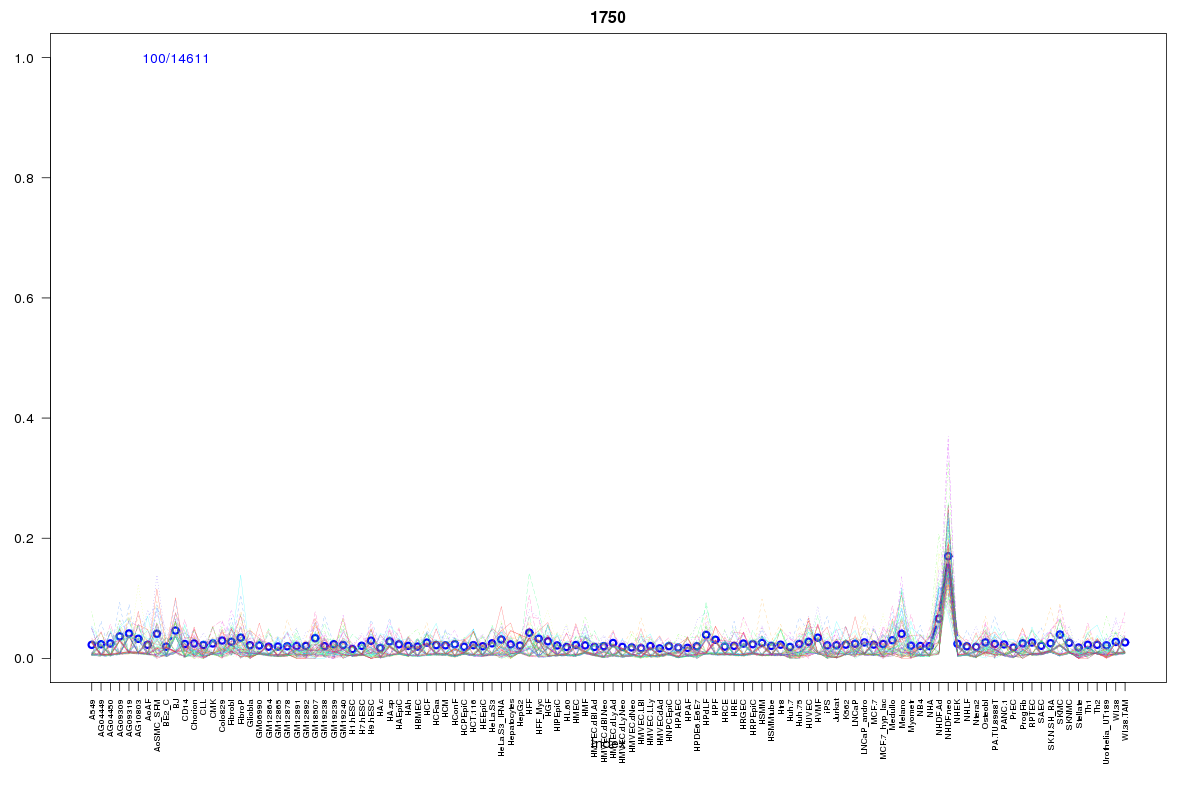 | 1750 | 1 |
 | 1963 | 1 |
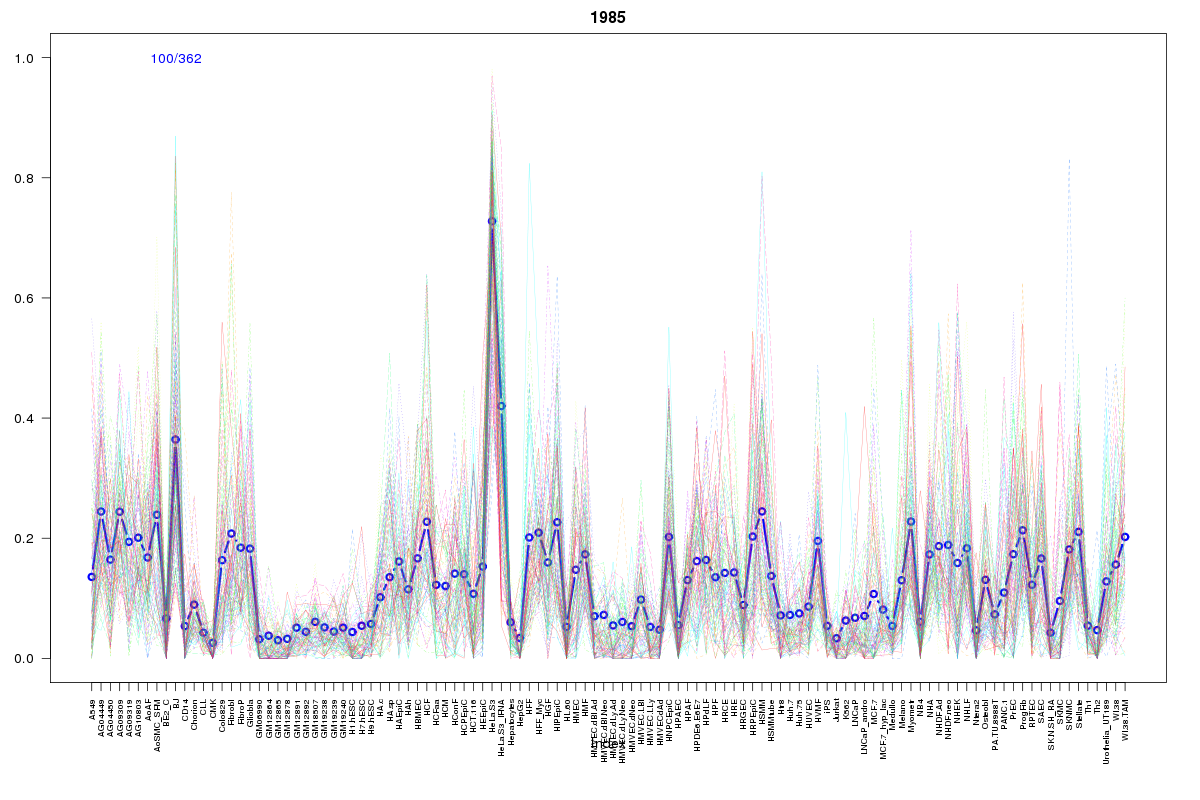 | 1985 | 1 |
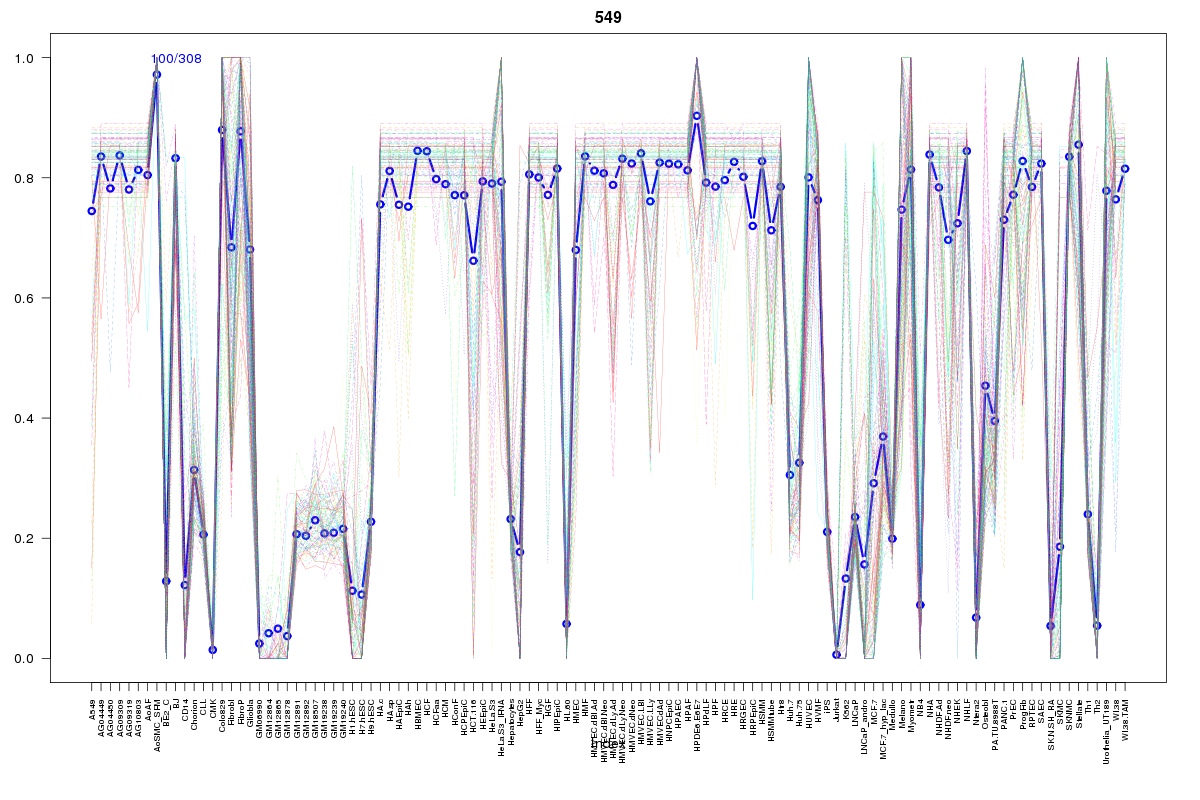 | 549 | 1 |
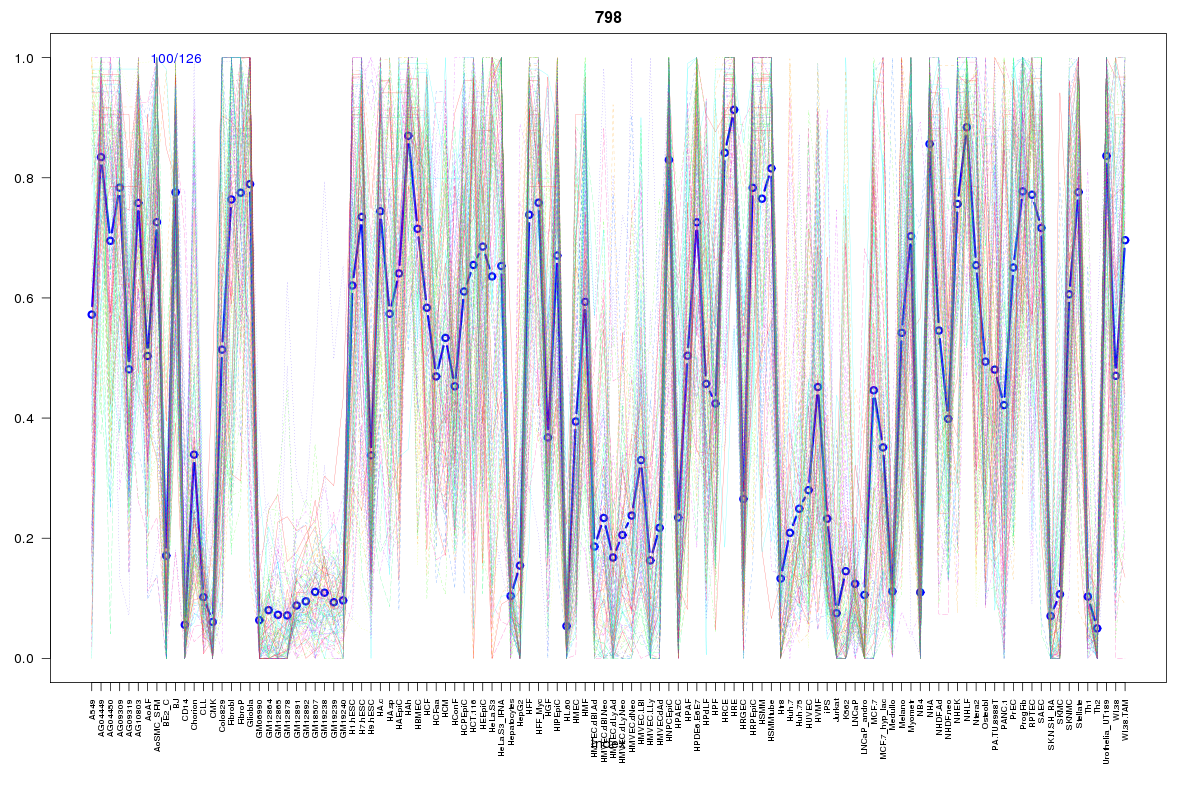 | 798 | 1 |
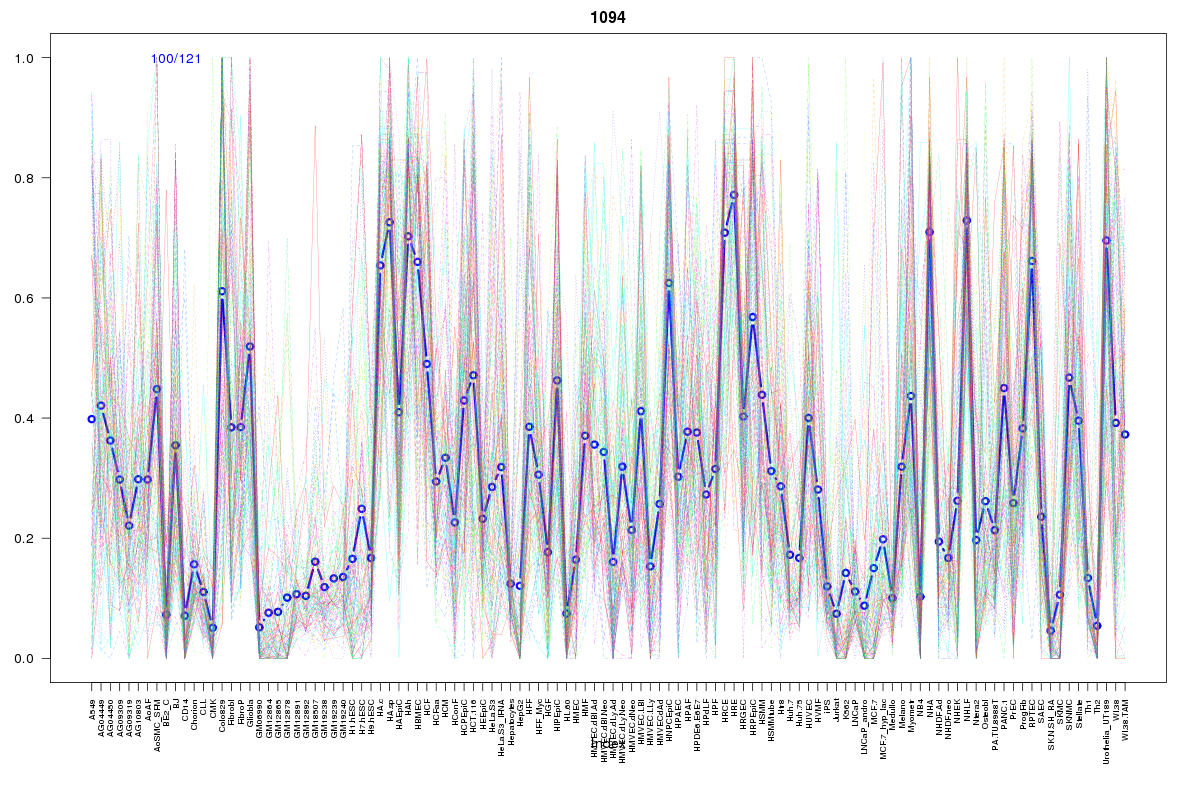 | 1094 | 1 |
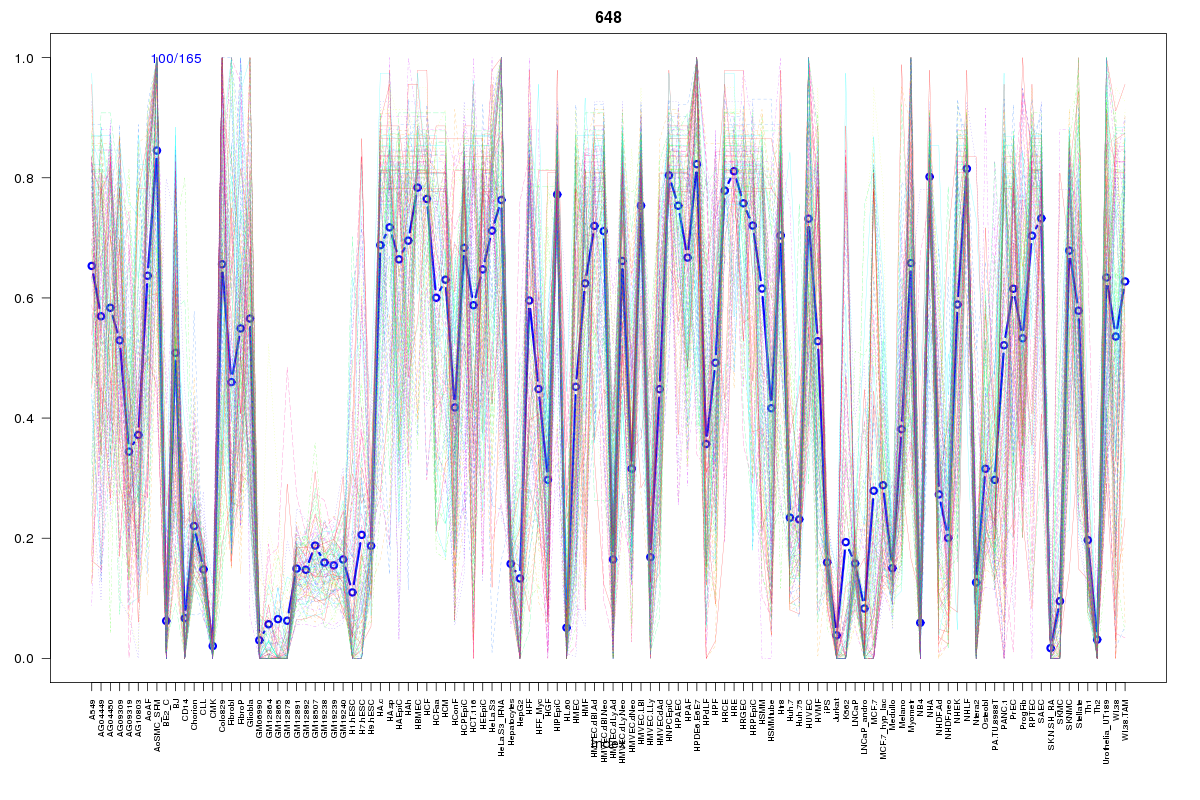 | 648 | 1 |
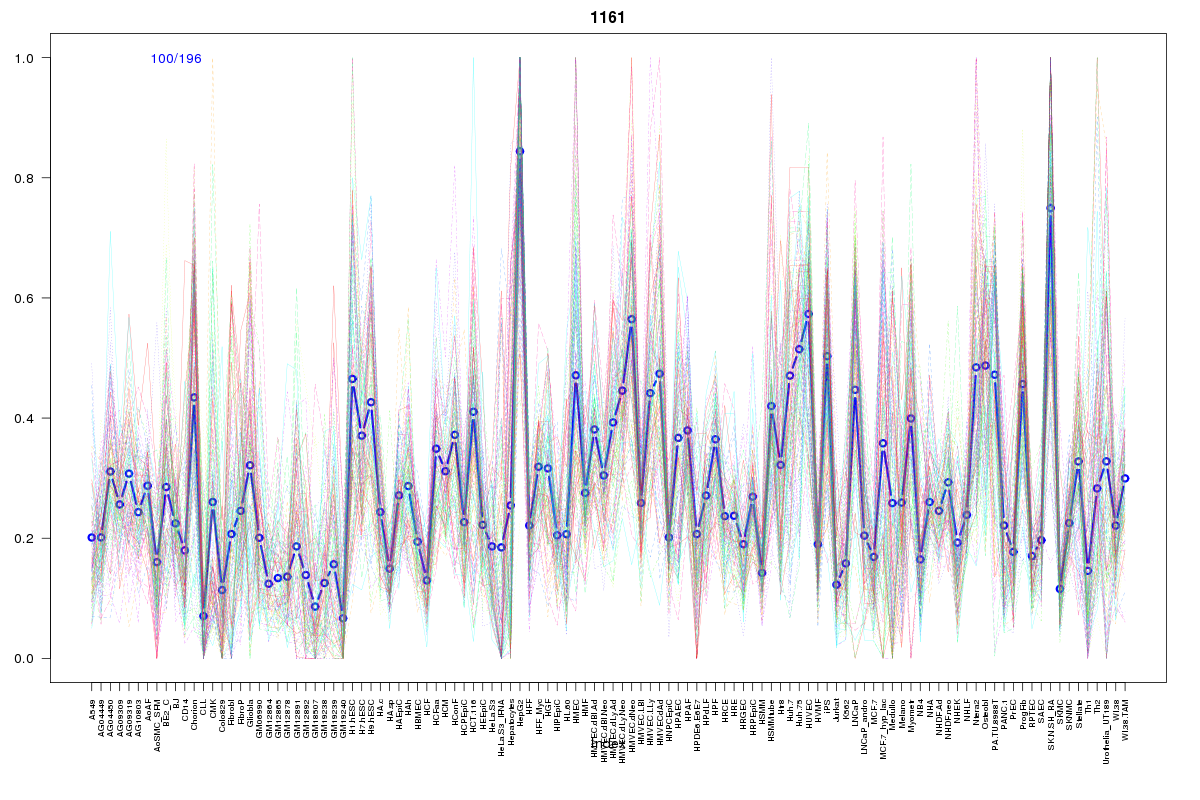 | 1161 | 1 |
Resources
BED file downloads
Connects to 21 DHS sitesTop 10 Correlated DHS Sites
p-values indiciate significant higher or lower correlation| Location | Cluster | P-value |
|---|---|---|
| chr10:17715860-17716010 | 798 | 0.001 |
| chr10:17554540-17554690 | 549 | 0.001 |
| chr10:17707840-17707990 | 1046 | 0.001 |
| chr10:17659400-17659550 | 1143 | 0.003 |
| chr10:17659720-17659870 | 2143 | 0.005 |
| chr10:17547000-17547150 | 1661 | 0.005 |
| chr10:17554820-17554970 | 1094 | 0.006 |
| chr10:17658665-17658815 | 1161 | 0.013 |
| chr10:17664160-17664310 | 1821 | 0.013 |
| chr10:17703080-17703230 | 1967 | 0.014 |
| chr10:17659880-17660030 | 620 | 0.016 |
External Databases
UCSCEnsembl (ENSG00000165996)