Gene: TAF13
chr1: 109605107-109618593Expression Profile
(log scale)
Graphical Connections
Distribution of linked clusters:
You may find it interesting if many of the connected DHS sites belong to the same cluster.| Cluster Profile | Cluster ID | Number of DHS sites in this cluster |
|---|---|---|
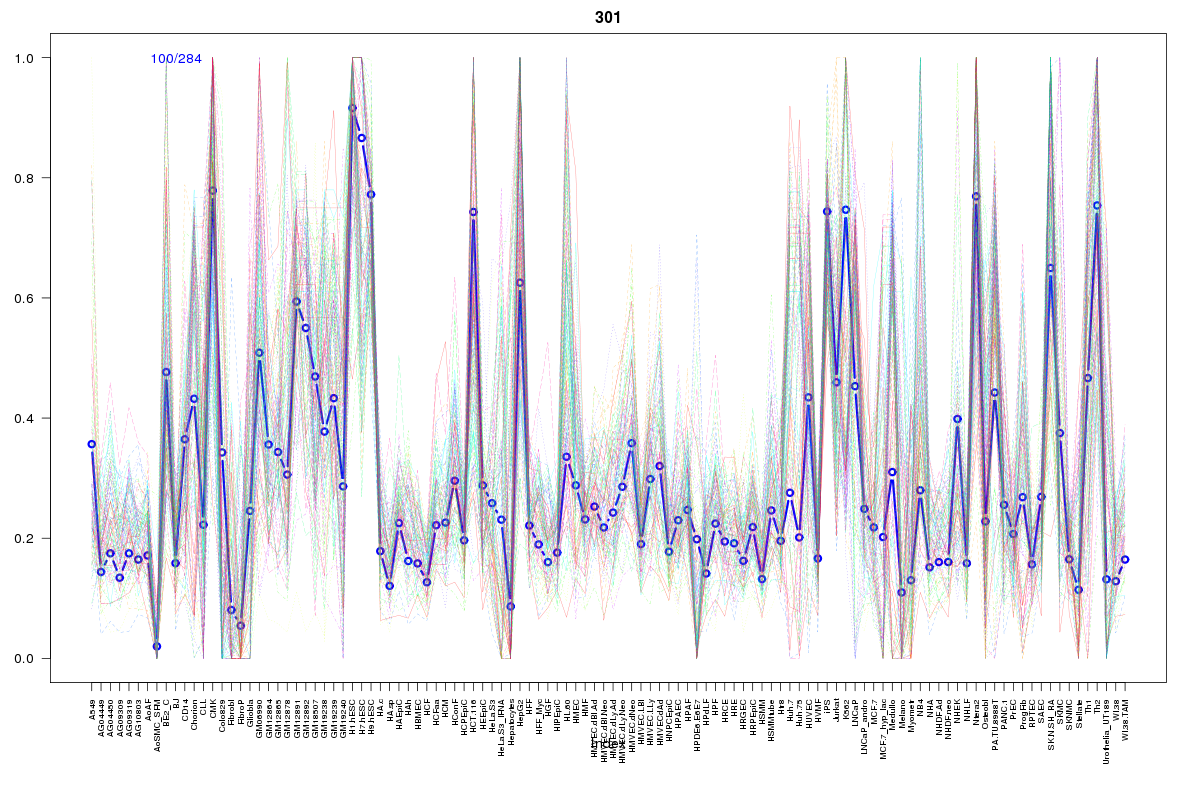 | 301 | 1 |
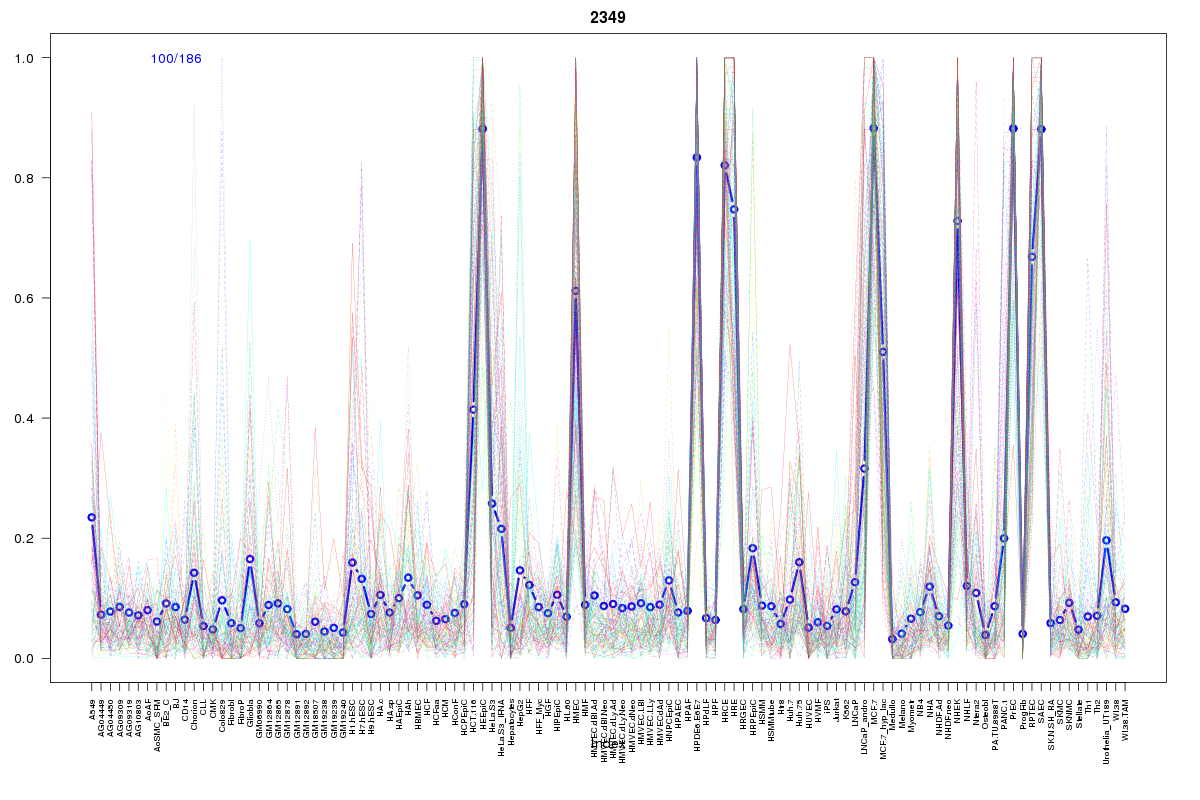 | 2349 | 1 |
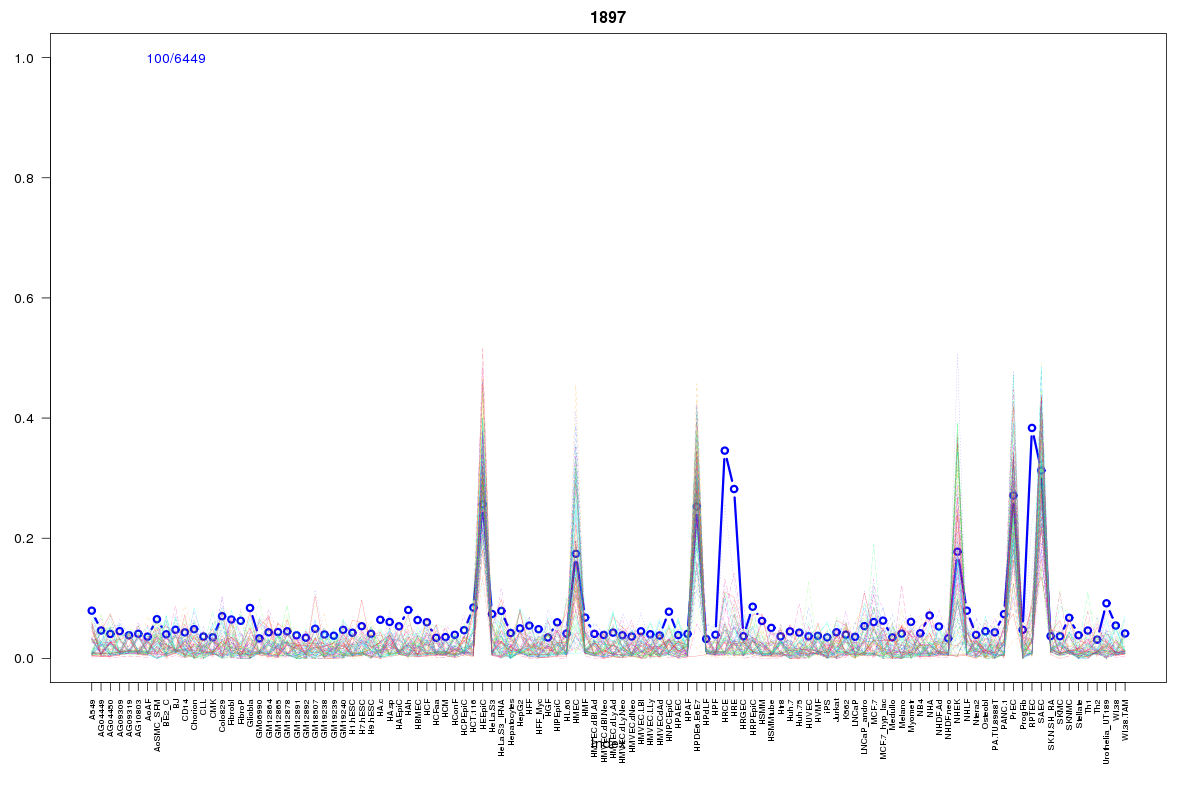 | 1897 | 1 |
 | 928 | 1 |
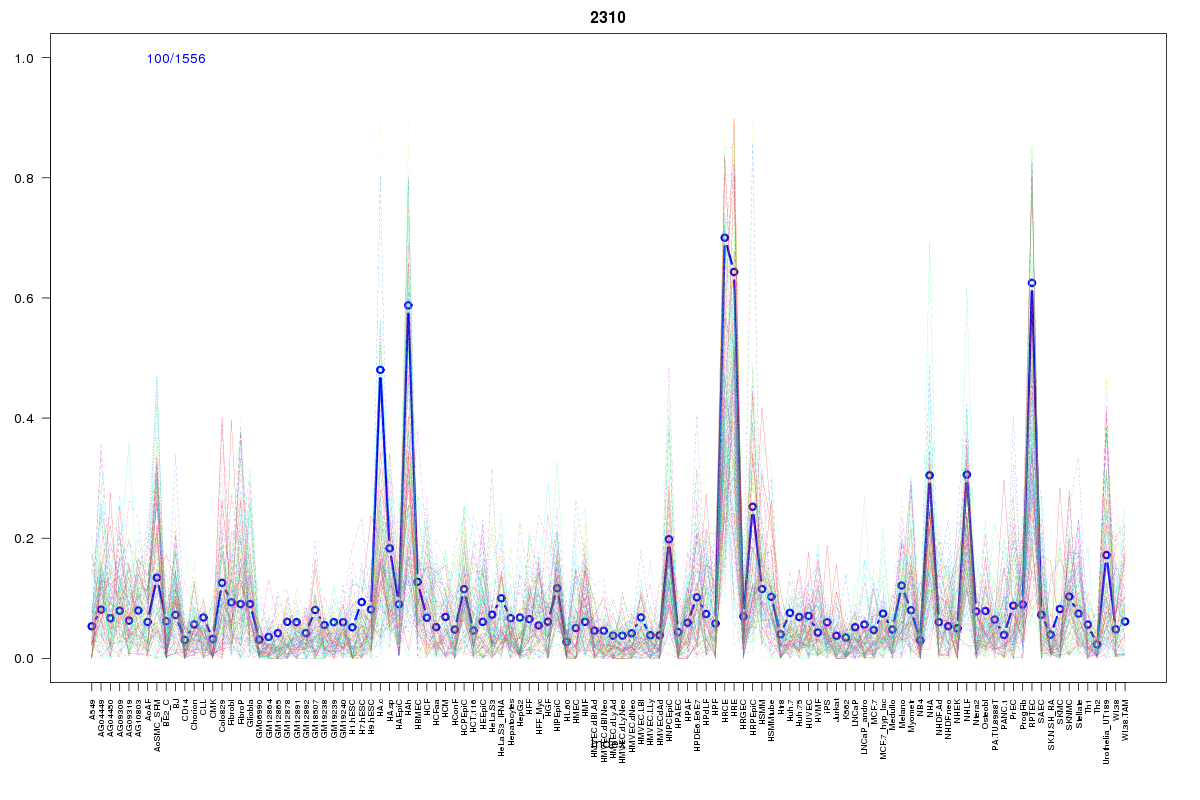 | 2310 | 1 |
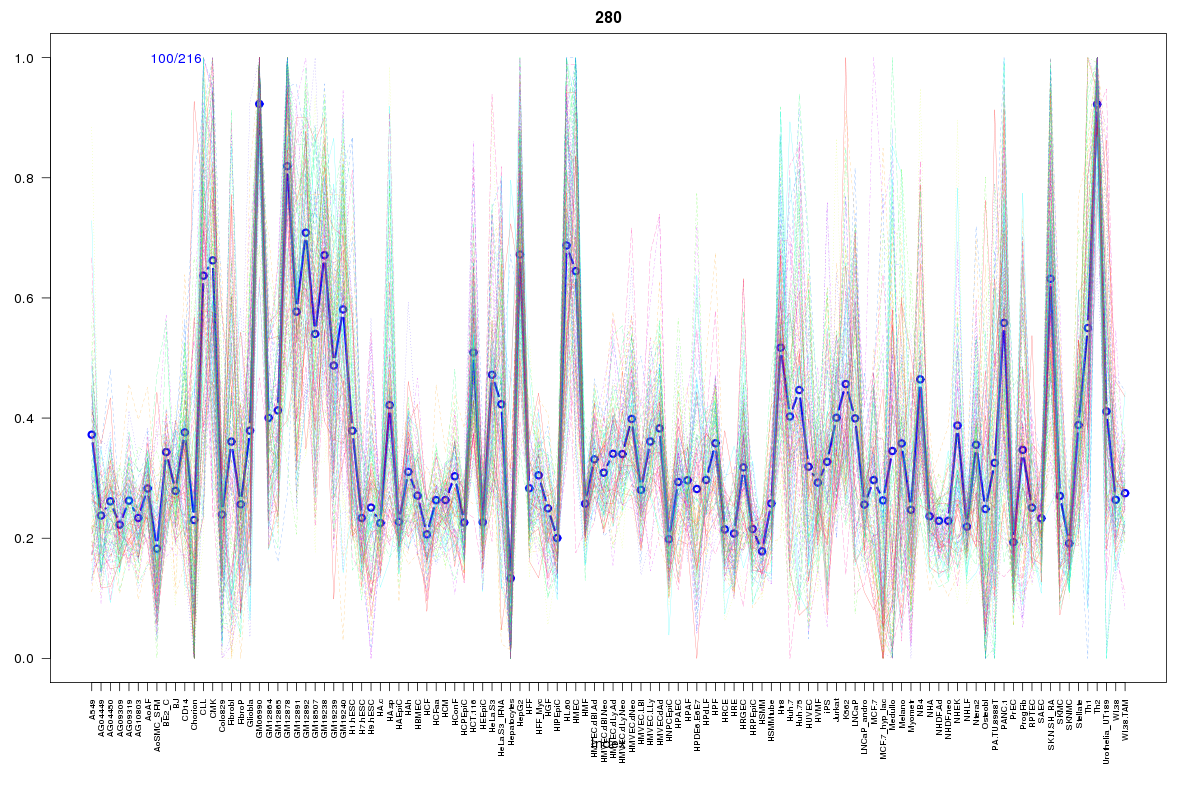 | 280 | 1 |
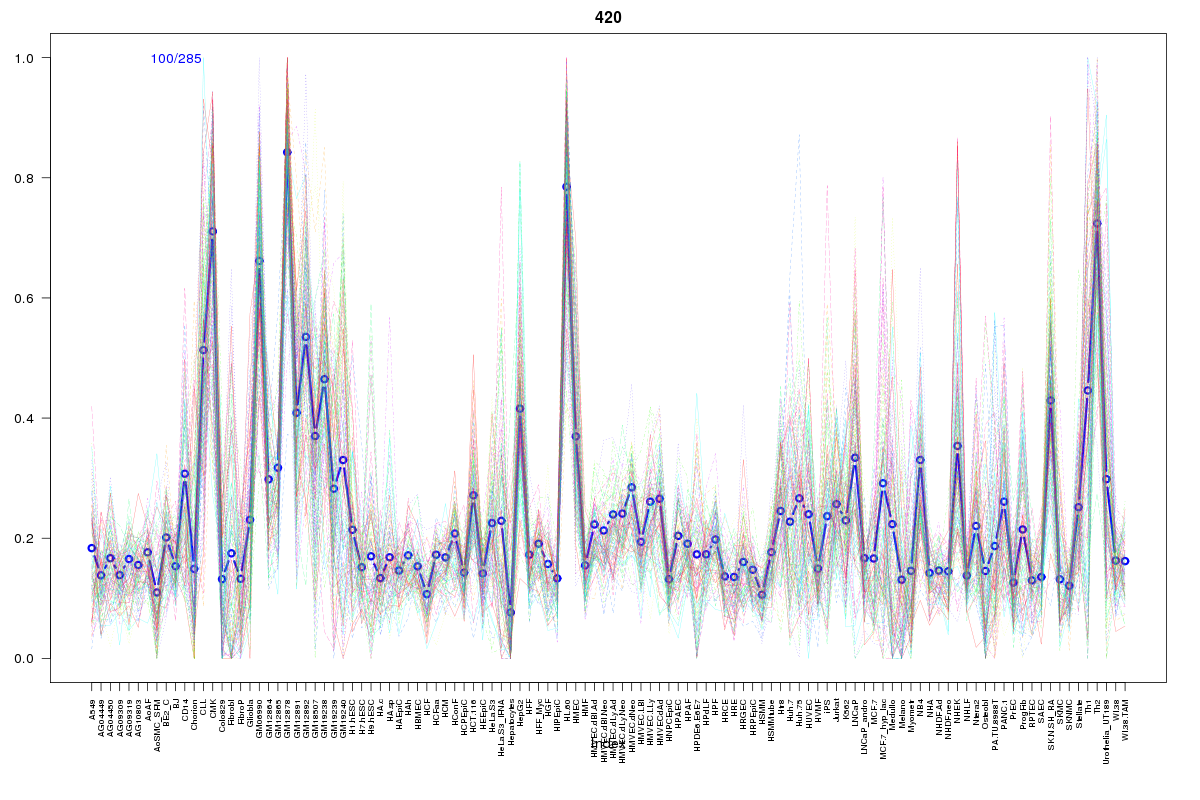 | 420 | 1 |
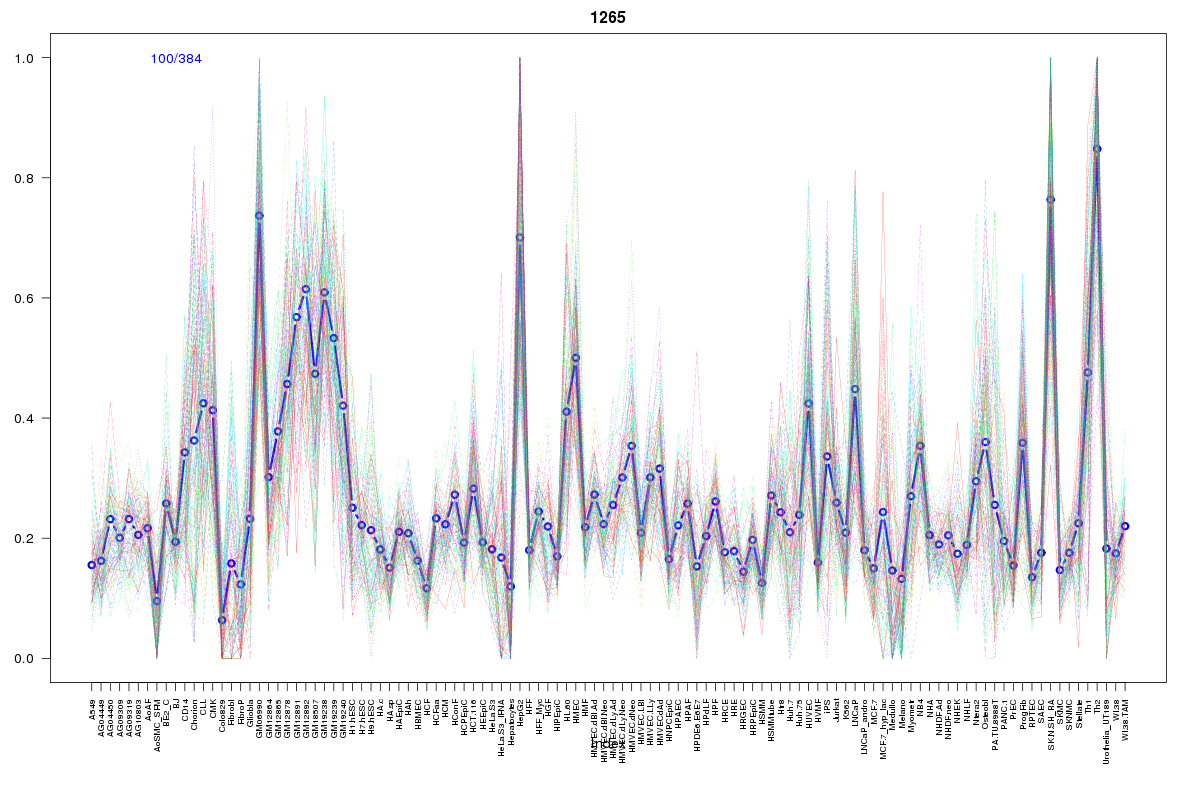 | 1265 | 1 |
 | 629 | 1 |
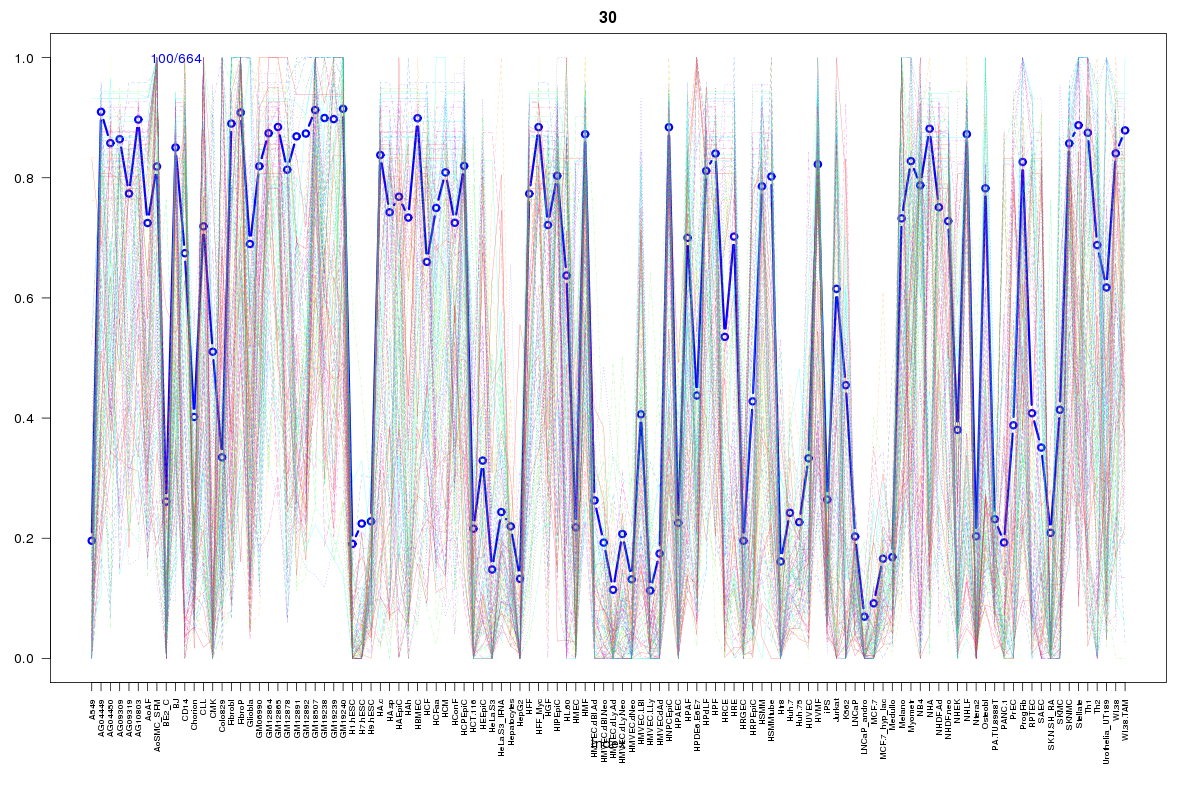 | 30 | 1 |
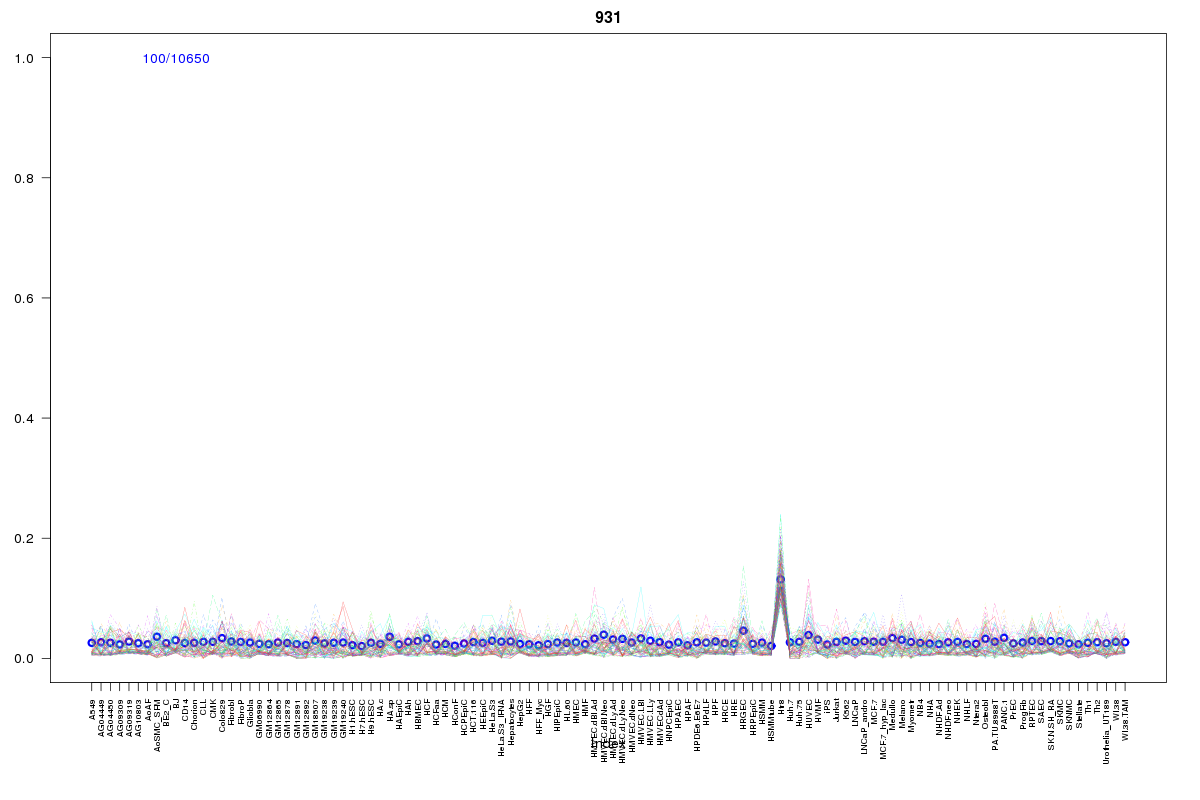 | 931 | 1 |
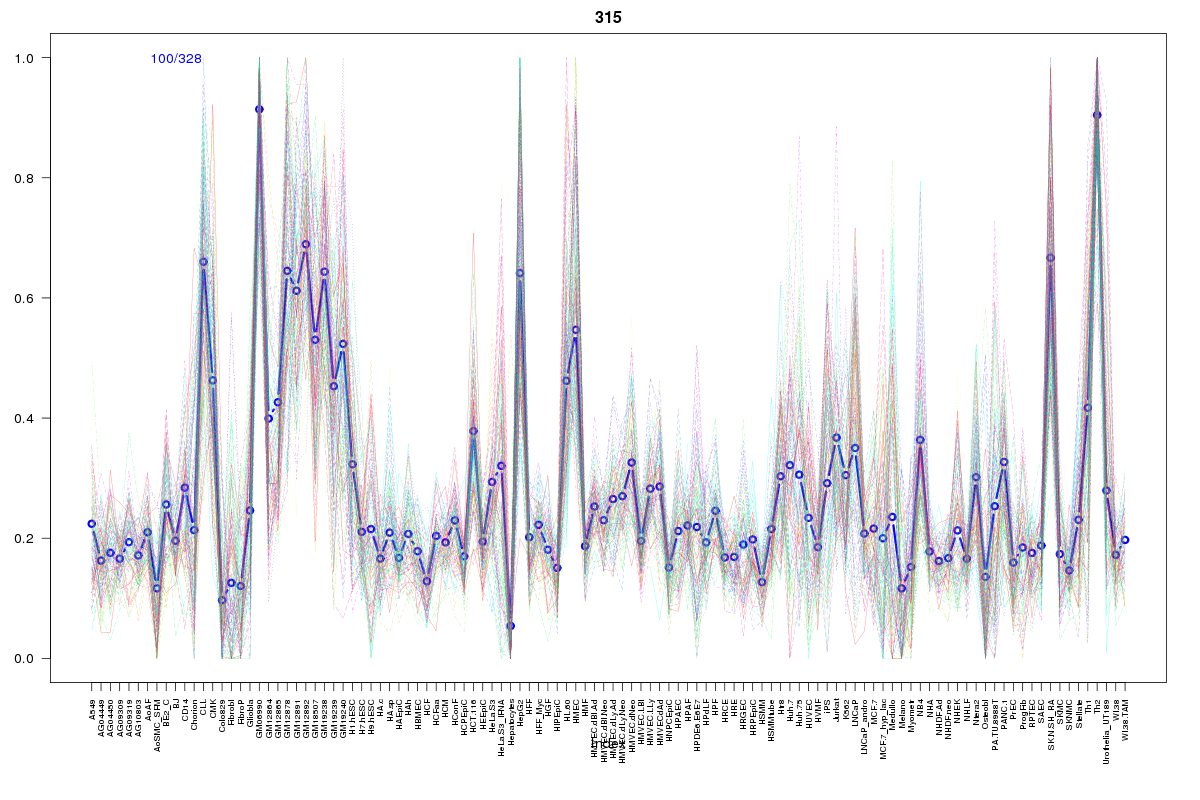 | 315 | 1 |
Resources
BED file downloads
Connects to 12 DHS sitesTop 10 Correlated DHS Sites
p-values indiciate significant higher or lower correlation| Location | Cluster | P-value |
|---|---|---|
| chr1:109705000-109705150 | 30 | 0.003 |
| chr1:109593345-109593495 | 1897 | 0.014 |
| chr1:109627320-109627470 | 2310 | 0.016 |
| chr1:109599720-109599870 | 928 | 0.018 |
| chr1:109593020-109593170 | 2349 | 0.021 |
| chr1:109525865-109526015 | 931 | 0.023 |
| chr1:109584360-109584510 | 315 | 0.017 |
| chr1:109584920-109585070 | 301 | 0.011 |
| chr1:109642980-109643130 | 420 | 0.004 |
| chr1:109643220-109643370 | 1265 | 0.004 |
| chr1:109633500-109633650 | 280 | 0.001 |
External Databases
UCSCEnsembl (ENSG00000197780)