Gene: APOM
chr6: 31620192-31625859Expression Profile
(log scale)
Graphical Connections
Distribution of linked clusters:
You may find it interesting if many of the connected DHS sites belong to the same cluster.| Cluster Profile | Cluster ID | Number of DHS sites in this cluster |
|---|---|---|
 | 1355 | 4 |
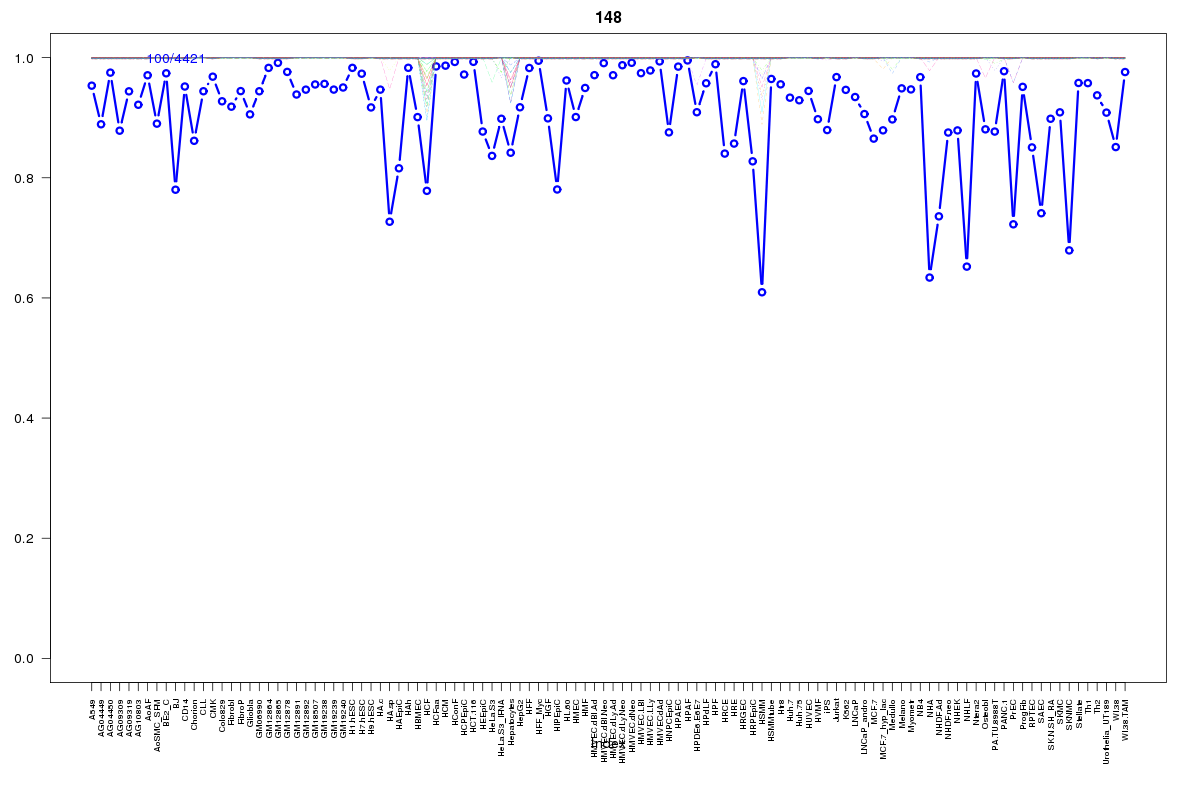 | 148 | 1 |
 | 186 | 1 |
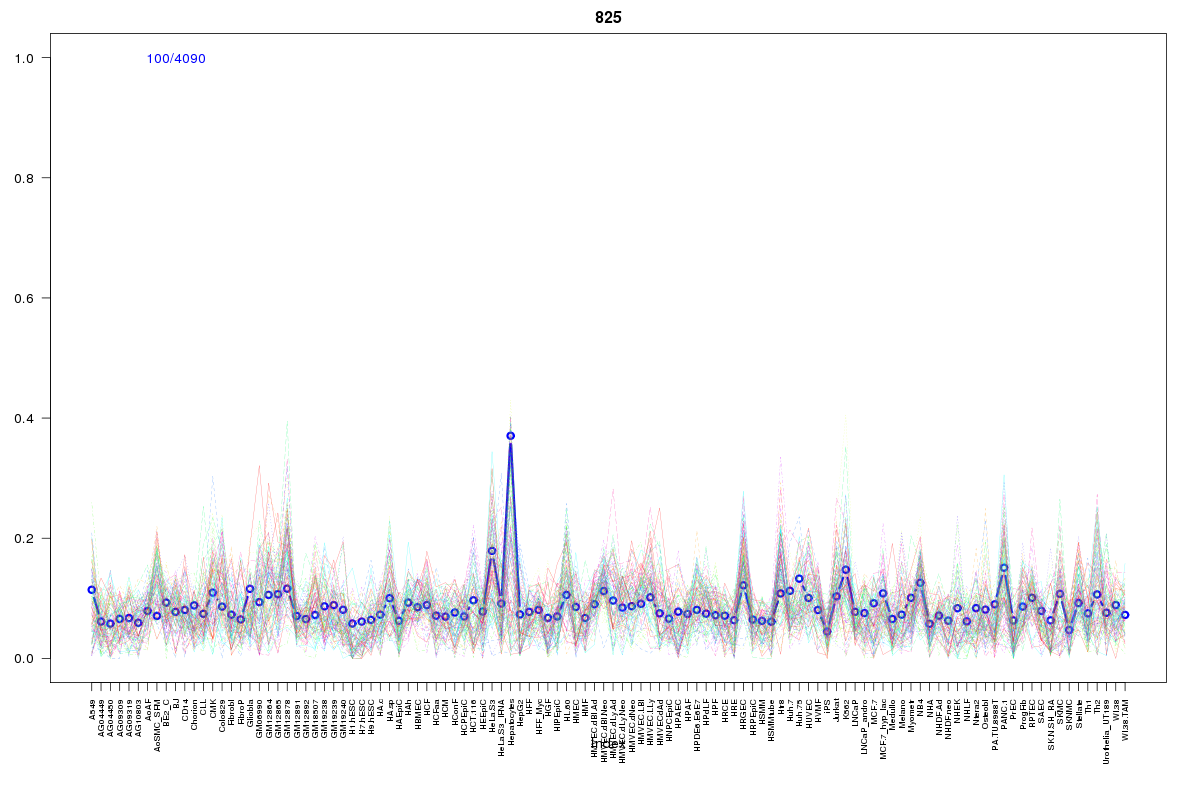 | 825 | 1 |
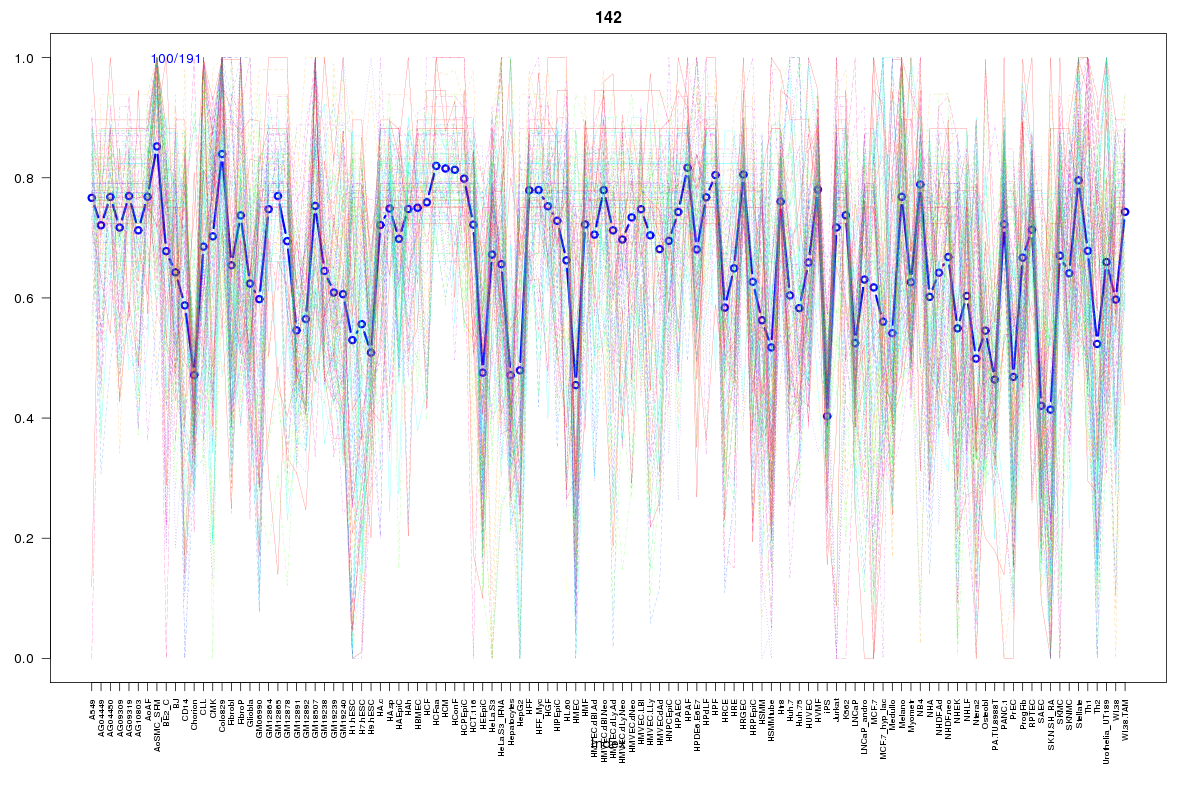 | 142 | 1 |
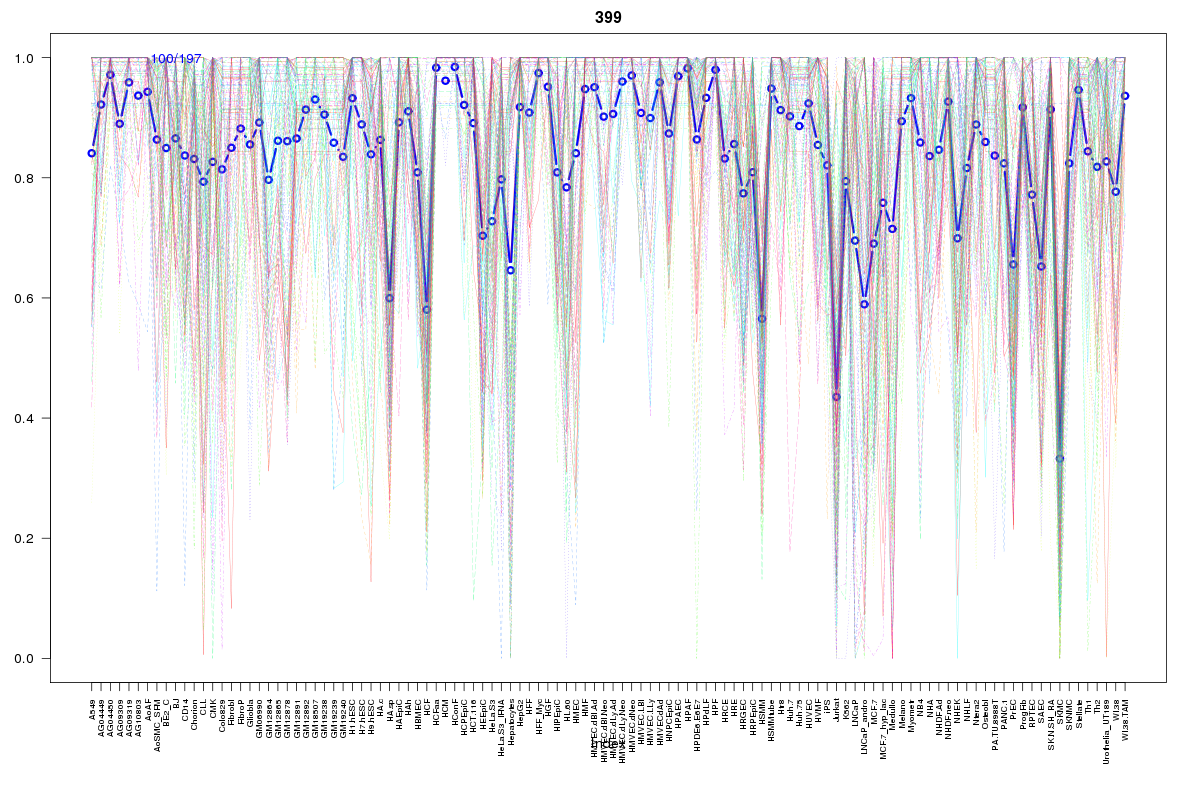 | 399 | 1 |
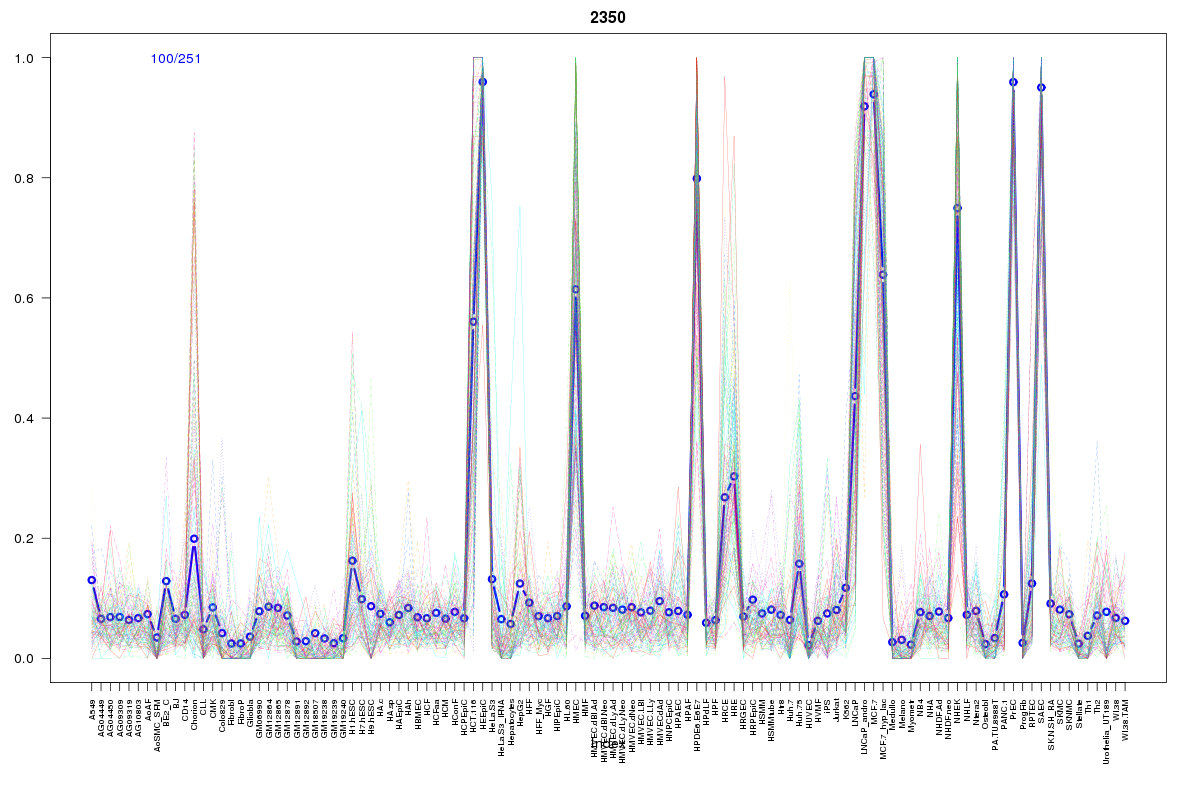 | 2350 | 1 |
 | 860 | 1 |
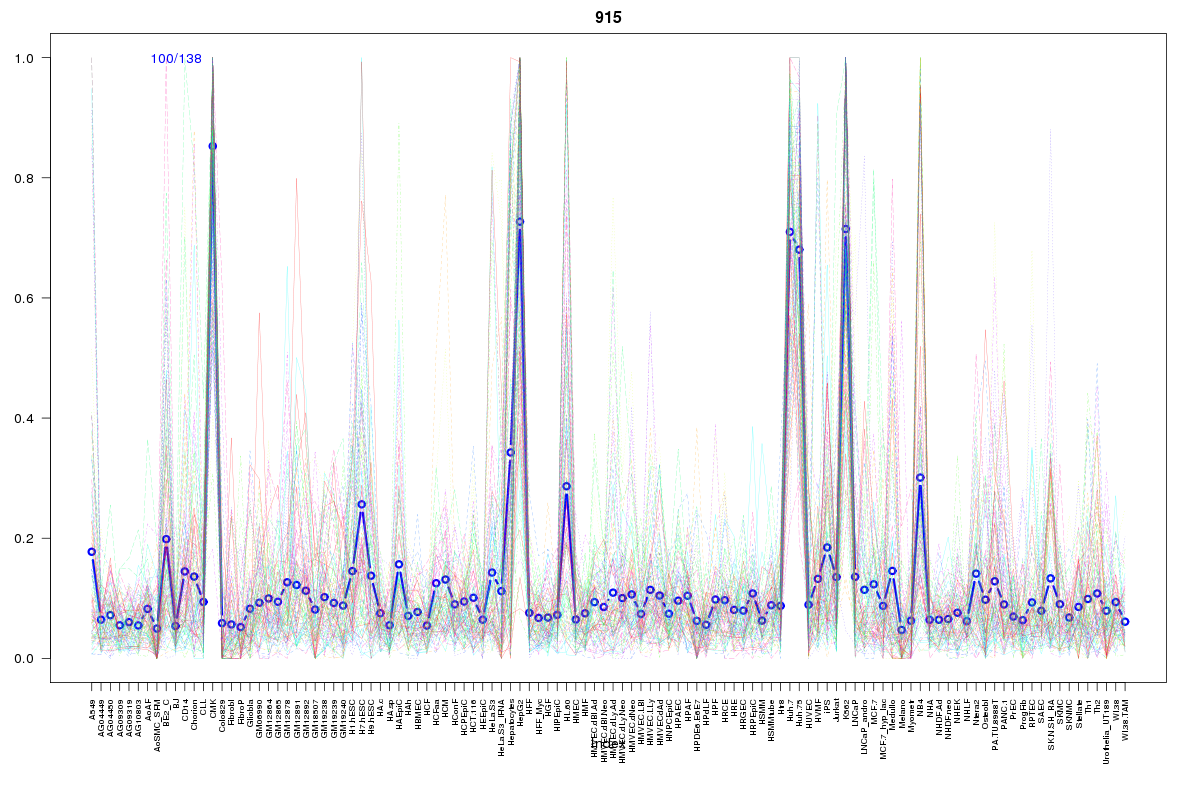 | 915 | 1 |
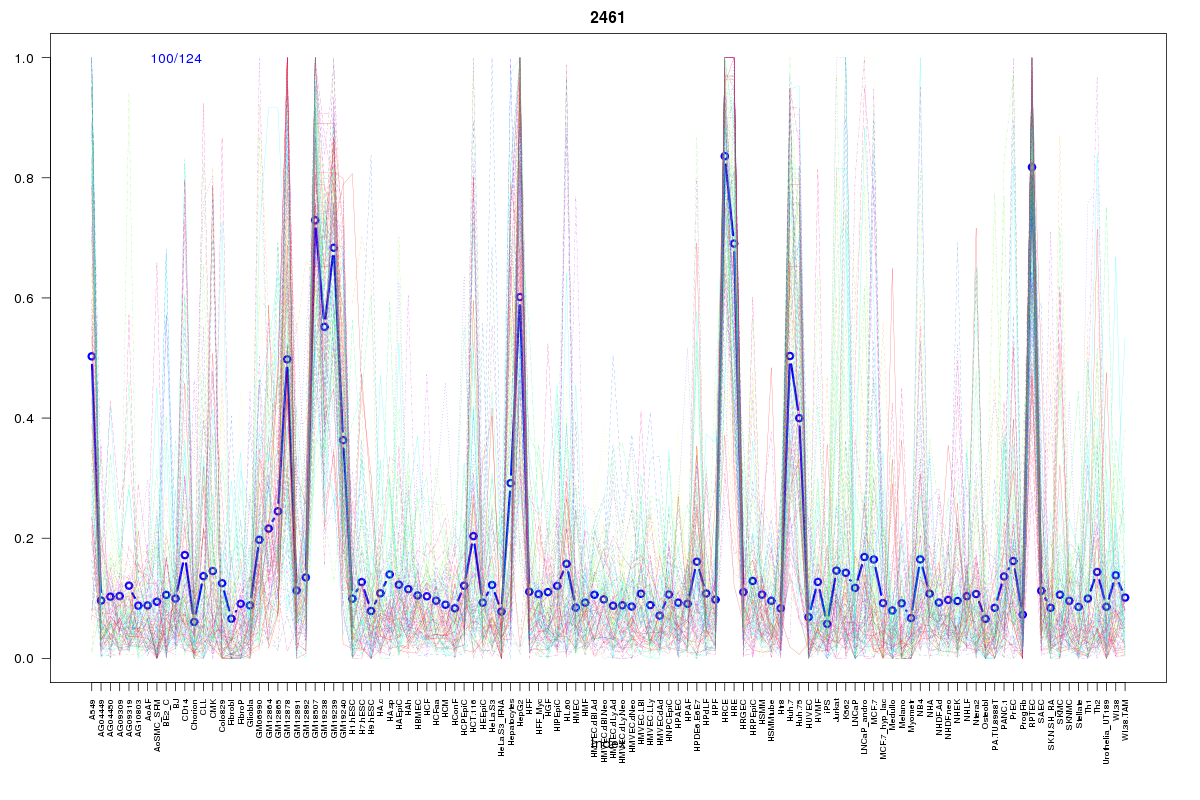 | 2461 | 1 |
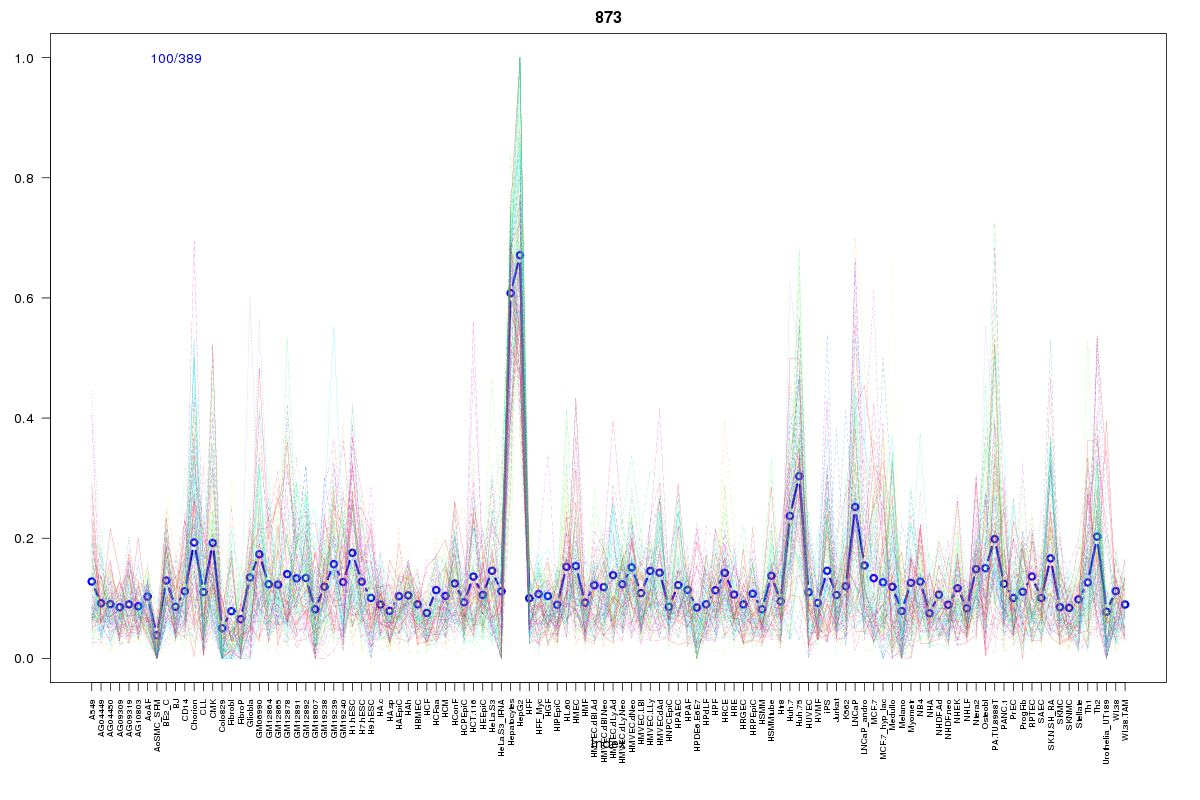 | 873 | 1 |
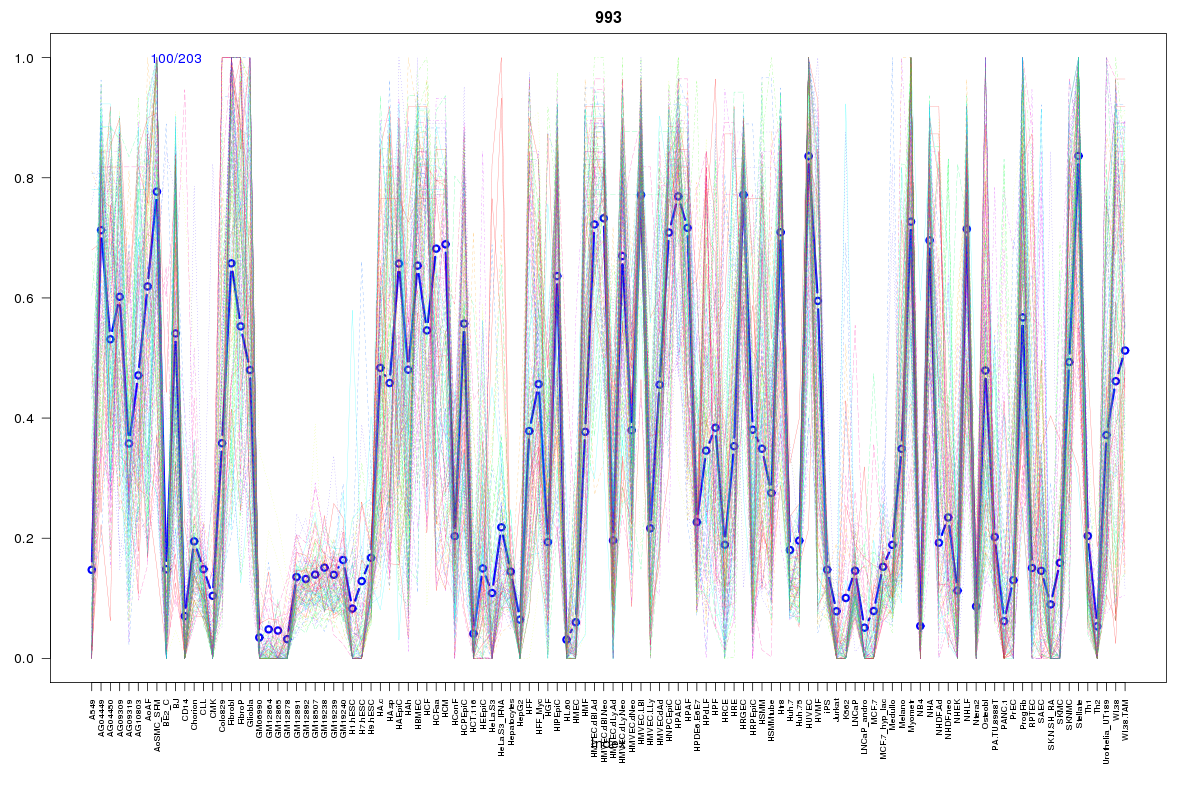 | 993 | 1 |
 | 1535 | 1 |
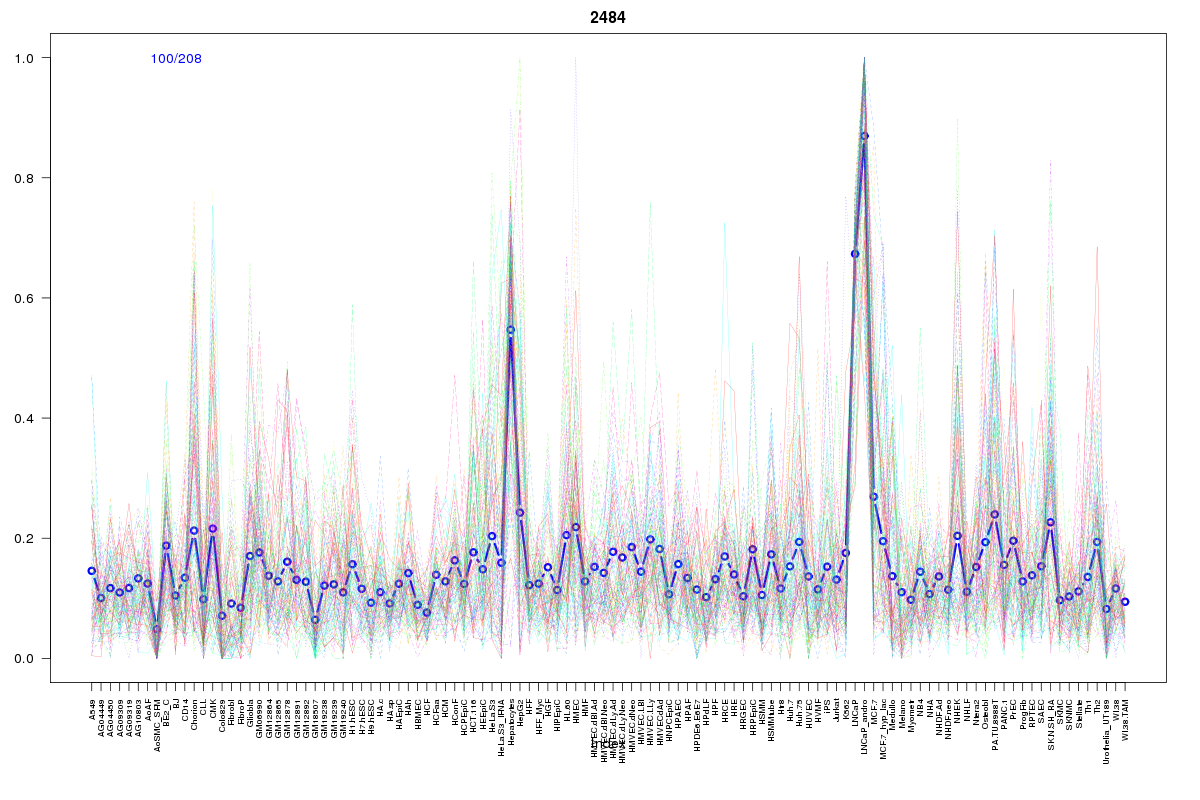 | 2484 | 1 |
 | 2233 | 1 |
 | 2452 | 1 |
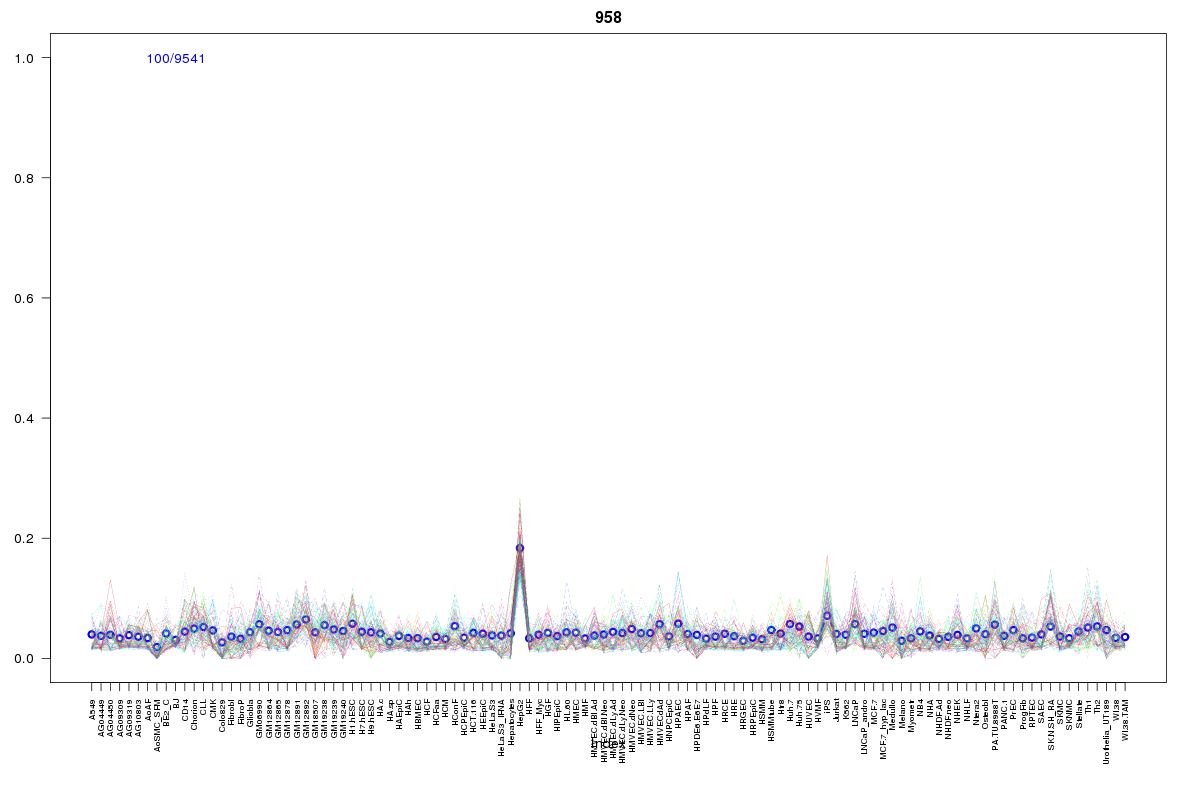 | 958 | 1 |
Resources
BED file downloads
Connects to 20 DHS sitesTop 10 Correlated DHS Sites
p-values indiciate significant higher or lower correlation| Location | Cluster | P-value |
|---|---|---|
| chr6:31632085-31632235 | 825 | 0.001 |
| chr6:31707125-31707275 | 873 | 0.002 |
| chr6:31623360-31623510 | 1355 | 0.002 |
| chr6:31566080-31566230 | 1355 | 0.009 |
| chr6:31689265-31689415 | 860 | 0.009 |
| chr6:31706560-31706710 | 2461 | 0.009 |
| chr6:31706400-31706550 | 915 | 0.009 |
| chr6:31615465-31615615 | 958 | 0.013 |
| chr6:31650585-31650735 | 1355 | 0.013 |
| chr6:31611965-31612115 | 1355 | 0.014 |
| chr6:31590500-31590650 | 2233 | 0.021 |
External Databases
UCSCEnsembl (ENSG00000204444)