Gene: TMEM14E
chr3: 152057483-152058779Expression Profile
(log scale)
Graphical Connections
Distribution of linked clusters:
You may find it interesting if many of the connected DHS sites belong to the same cluster.| Cluster Profile | Cluster ID | Number of DHS sites in this cluster |
|---|---|---|
 | 2072 | 4 |
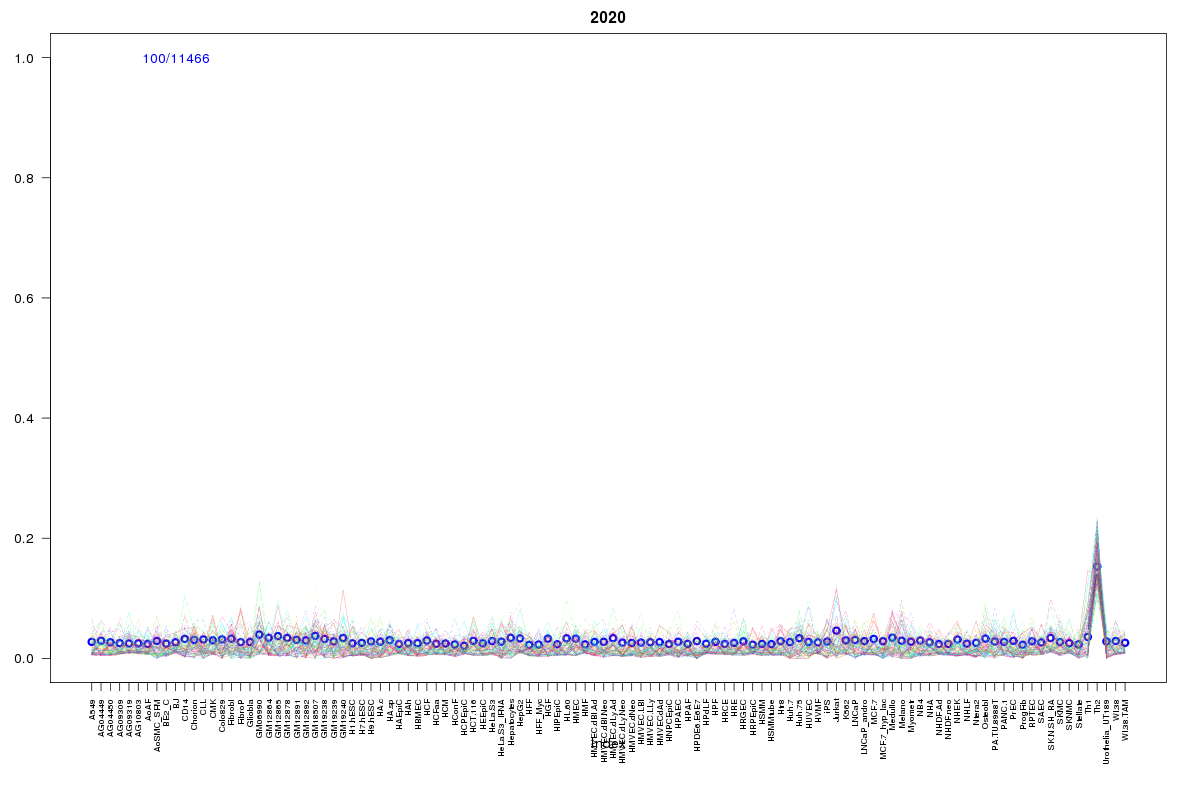 | 2020 | 3 |
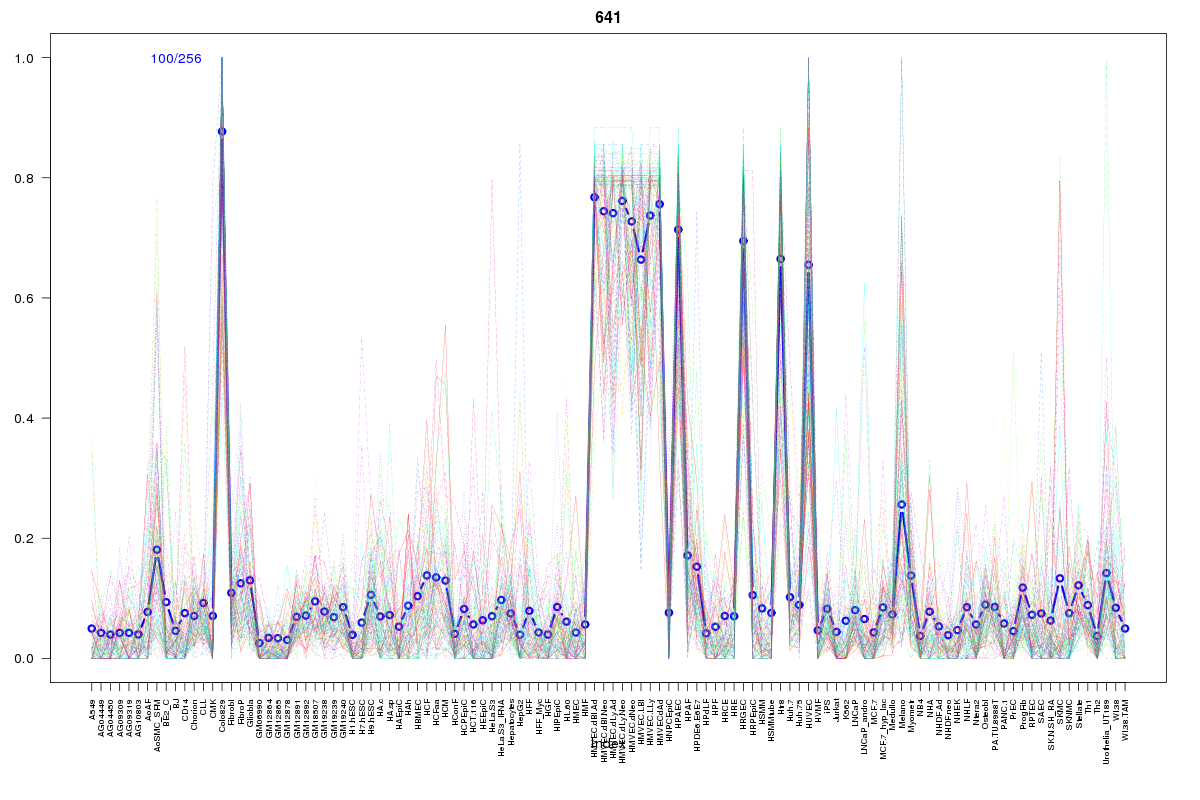 | 641 | 2 |
 | 687 | 2 |
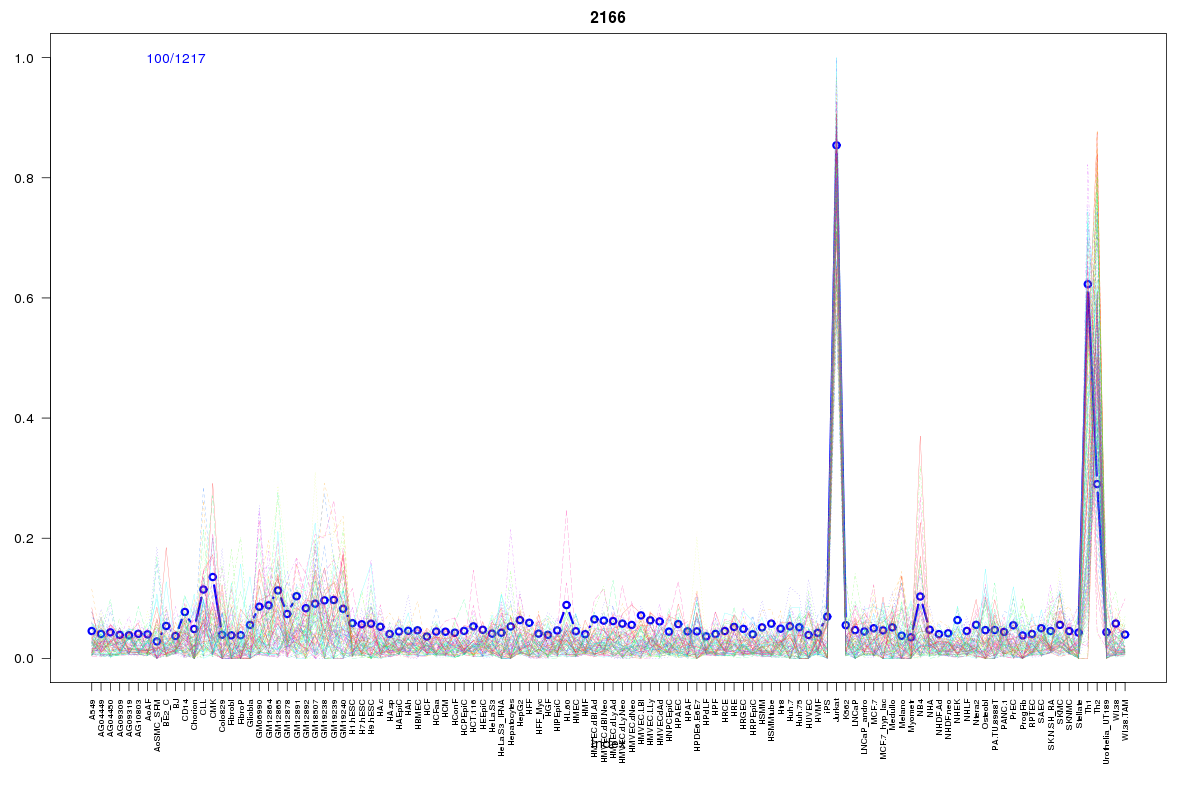 | 2166 | 2 |
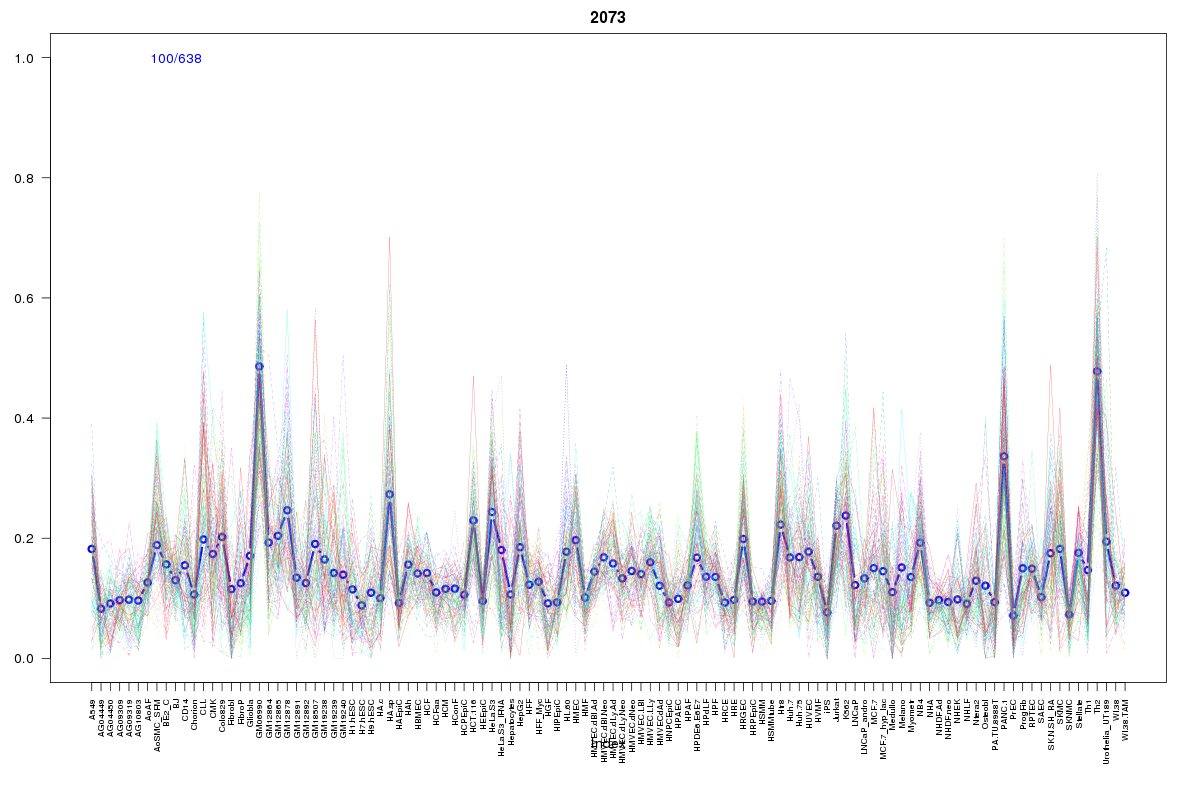 | 2073 | 1 |
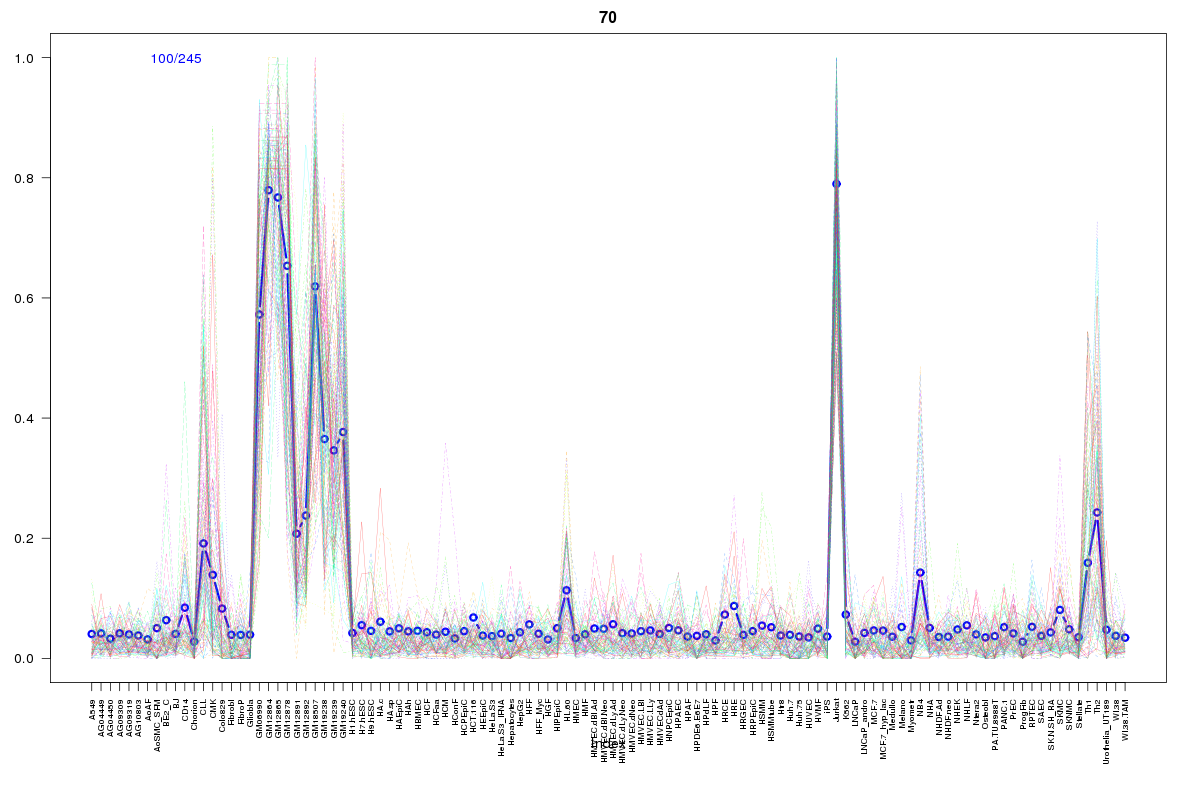 | 70 | 1 |
 | 434 | 1 |
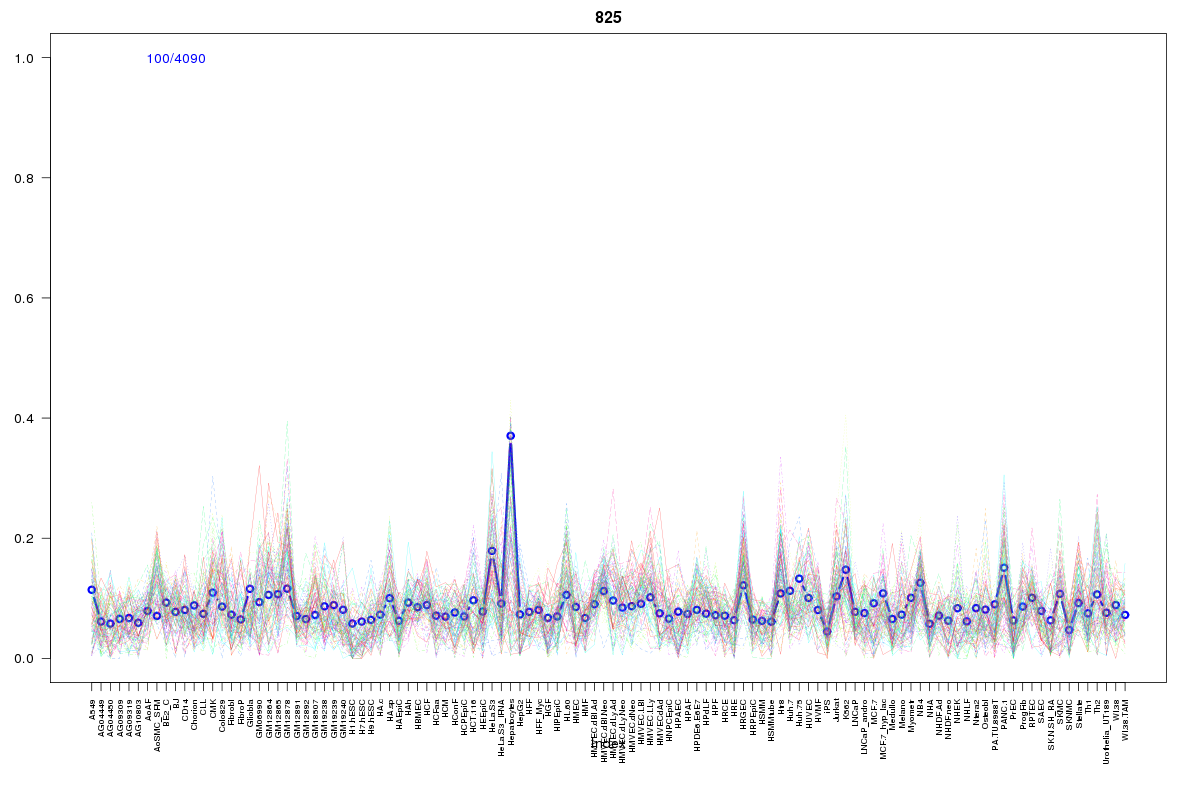 | 825 | 1 |
 | 579 | 1 |
 | 1755 | 1 |
 | 934 | 1 |
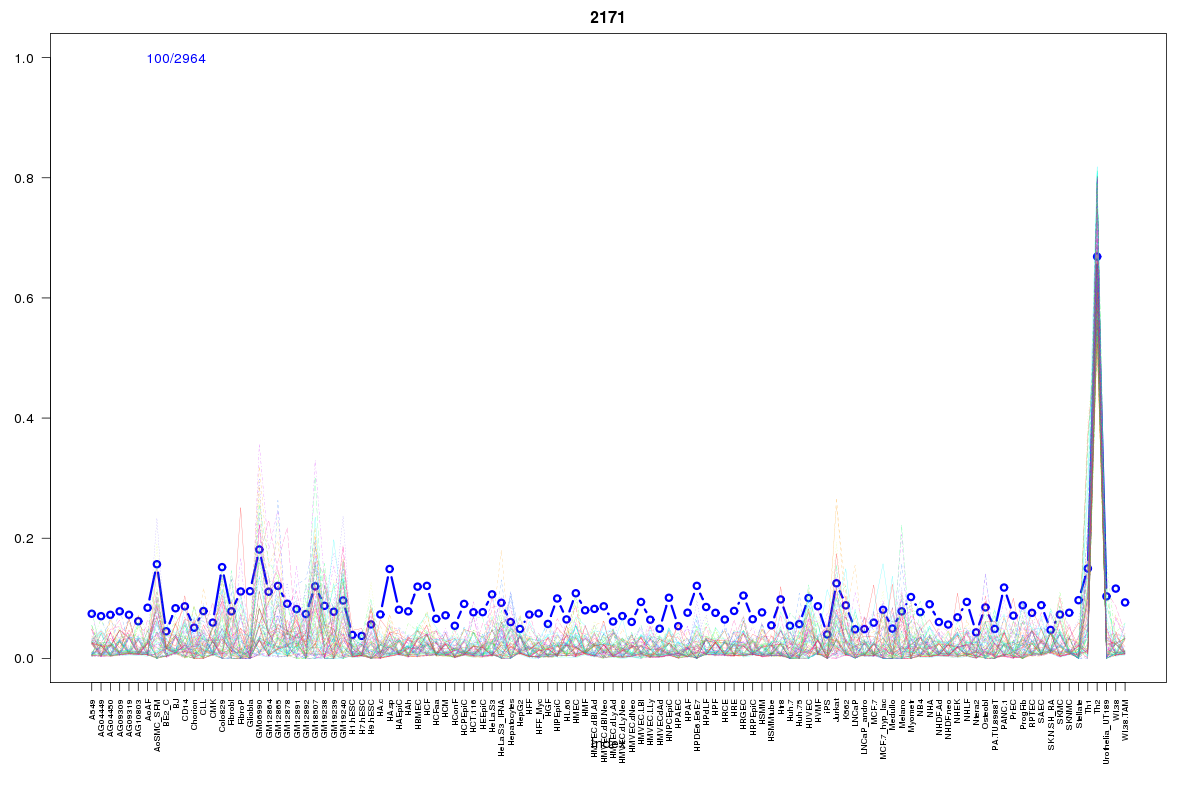 | 2171 | 1 |
 | 935 | 1 |
 | 2062 | 1 |
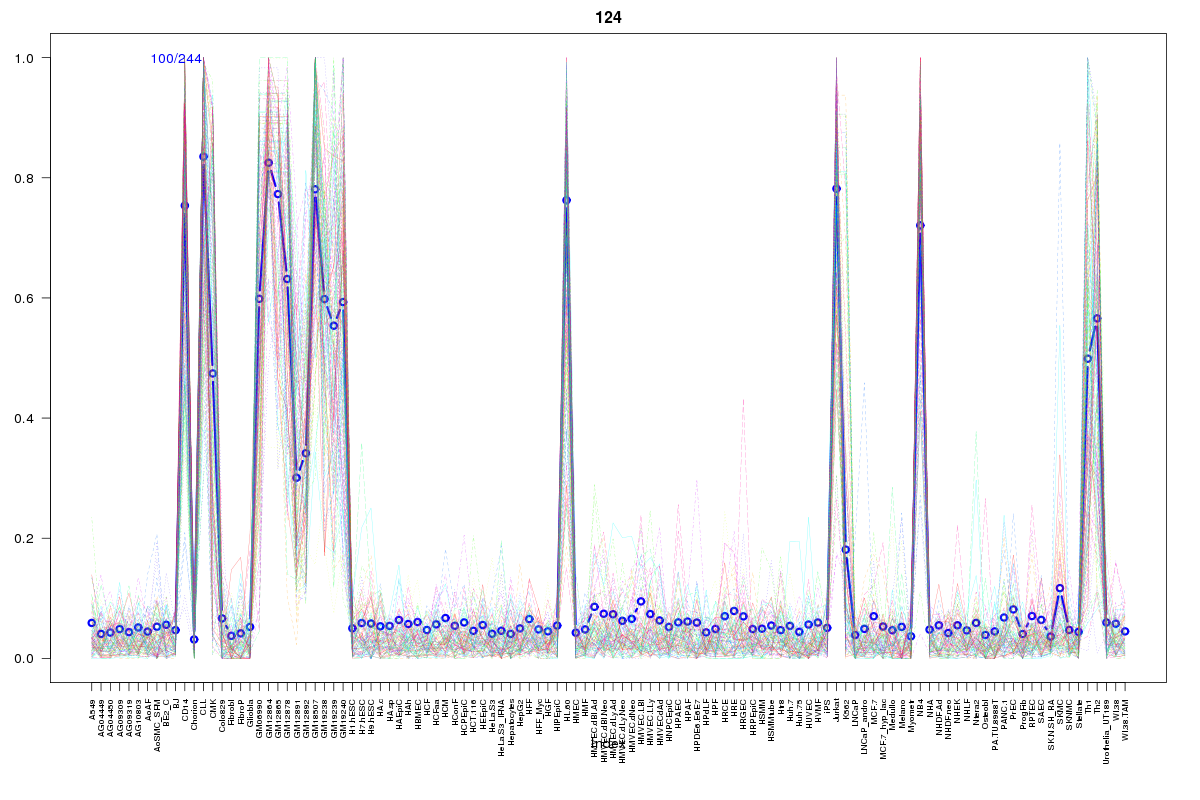 | 124 | 1 |
Resources
BED file downloads
Connects to 24 DHS sitesTop 10 Correlated DHS Sites
p-values indiciate significant higher or lower correlation| Location | Cluster | P-value |
|---|---|---|
| chr3:151975380-151975530 | 2073 | 0.003 |
| chr3:151959440-151959590 | 935 | 0.003 |
| chr3:152137600-152137750 | 1755 | 0.003 |
| chr3:151959200-151959350 | 2171 | 0.006 |
| chr3:151963520-151963670 | 2072 | 0.006 |
| chr3:152072100-152072250 | 2020 | 0.007 |
| chr3:151961880-151962030 | 2062 | 0.008 |
| chr3:152033480-152033630 | 641 | 0.011 |
| chr3:152019780-152019930 | 579 | 0.012 |
| chr3:152037600-152037750 | 687 | 0.013 |
| chr3:152038160-152038310 | 641 | 0.013 |
External Databases
UCSCEnsembl (ENSG00000221962)