Gene: PGCP1
chr1: 111925481-111934441Expression Profile
(log scale)
Graphical Connections
Distribution of linked clusters:
You may find it interesting if many of the connected DHS sites belong to the same cluster.| Cluster Profile | Cluster ID | Number of DHS sites in this cluster |
|---|---|---|
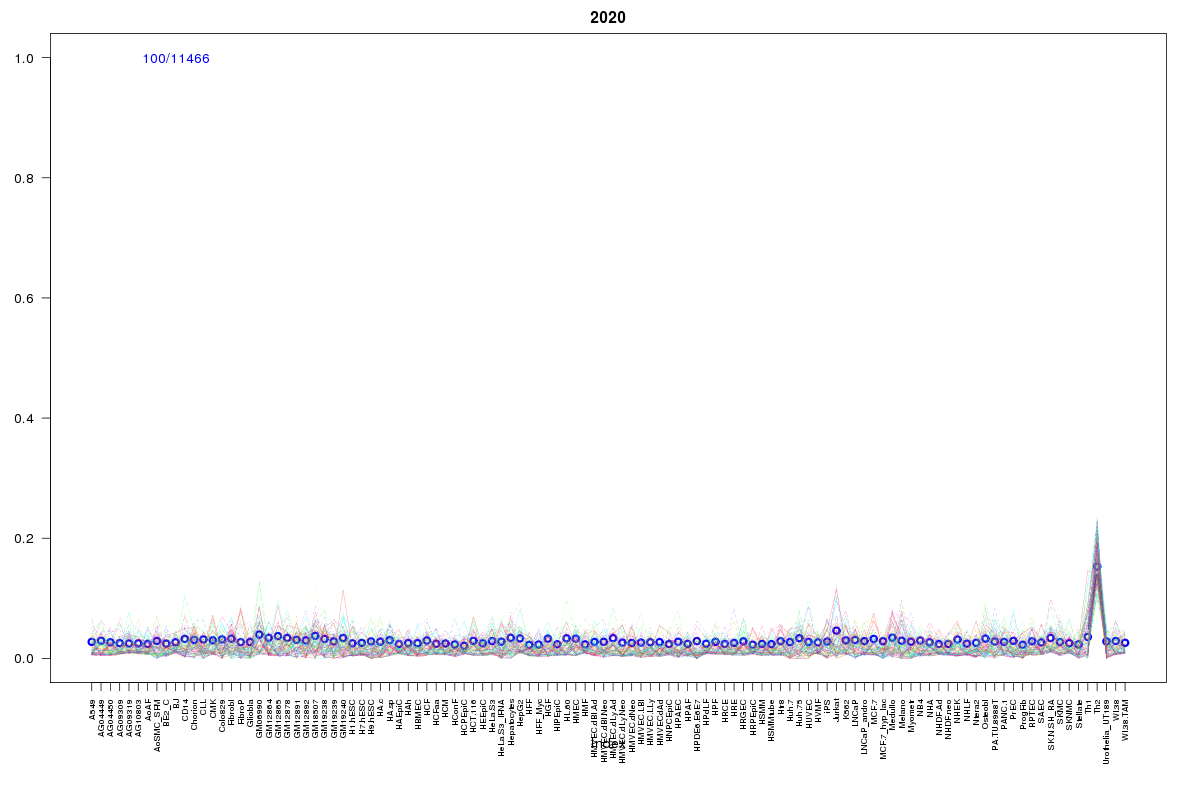 | 2020 | 3 |
 | 860 | 2 |
 | 2072 | 2 |
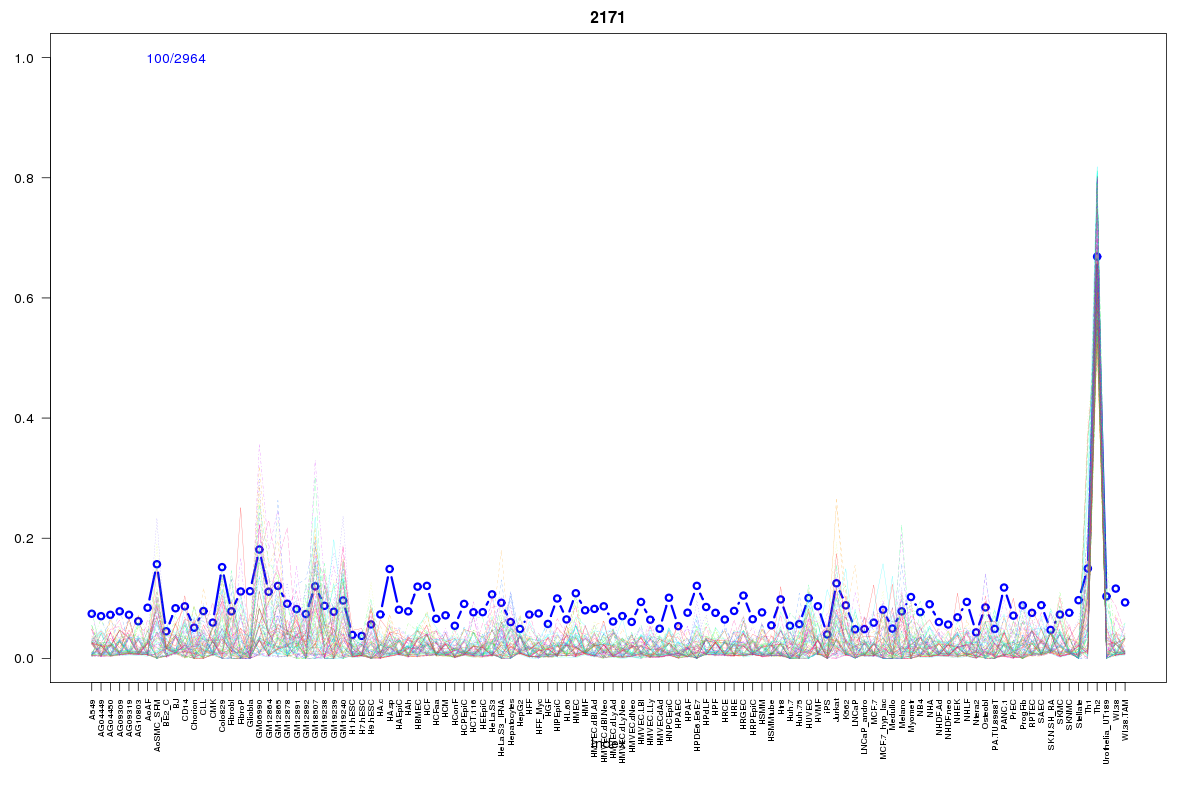 | 2171 | 2 |
 | 1605 | 2 |
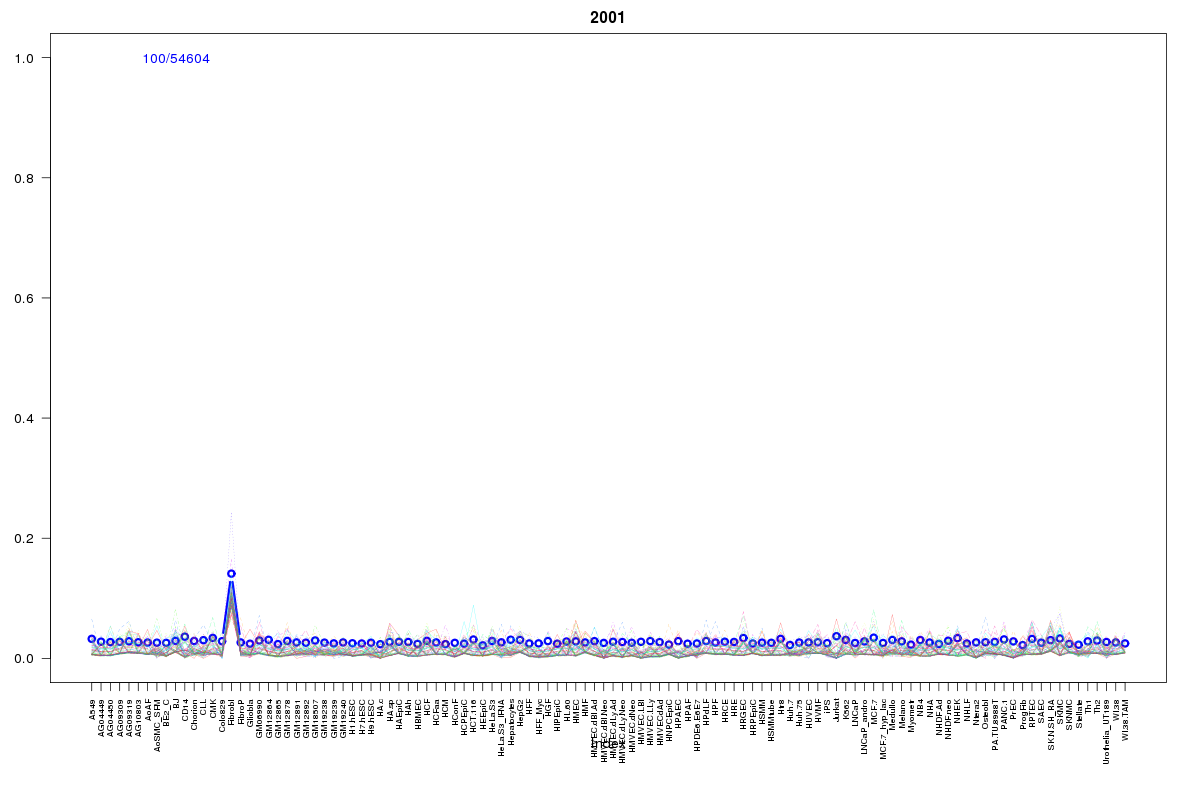 | 2001 | 1 |
 | 430 | 1 |
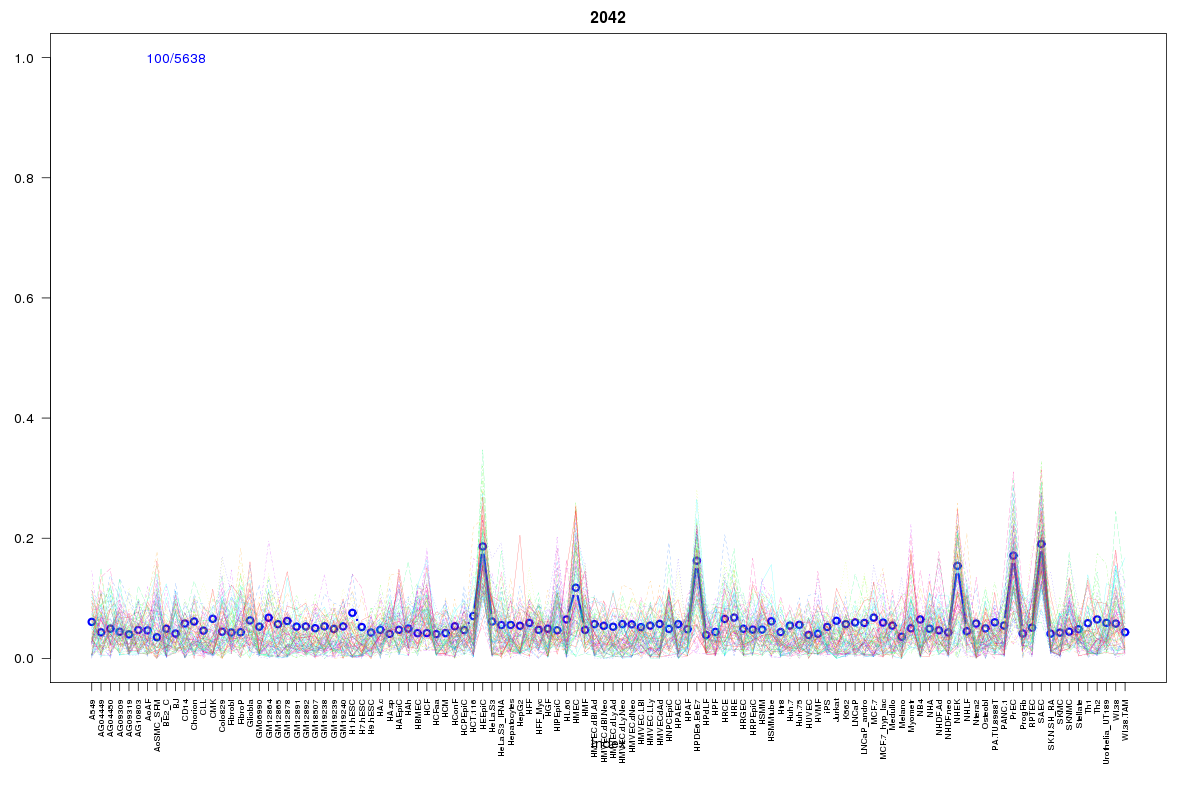 | 2042 | 1 |
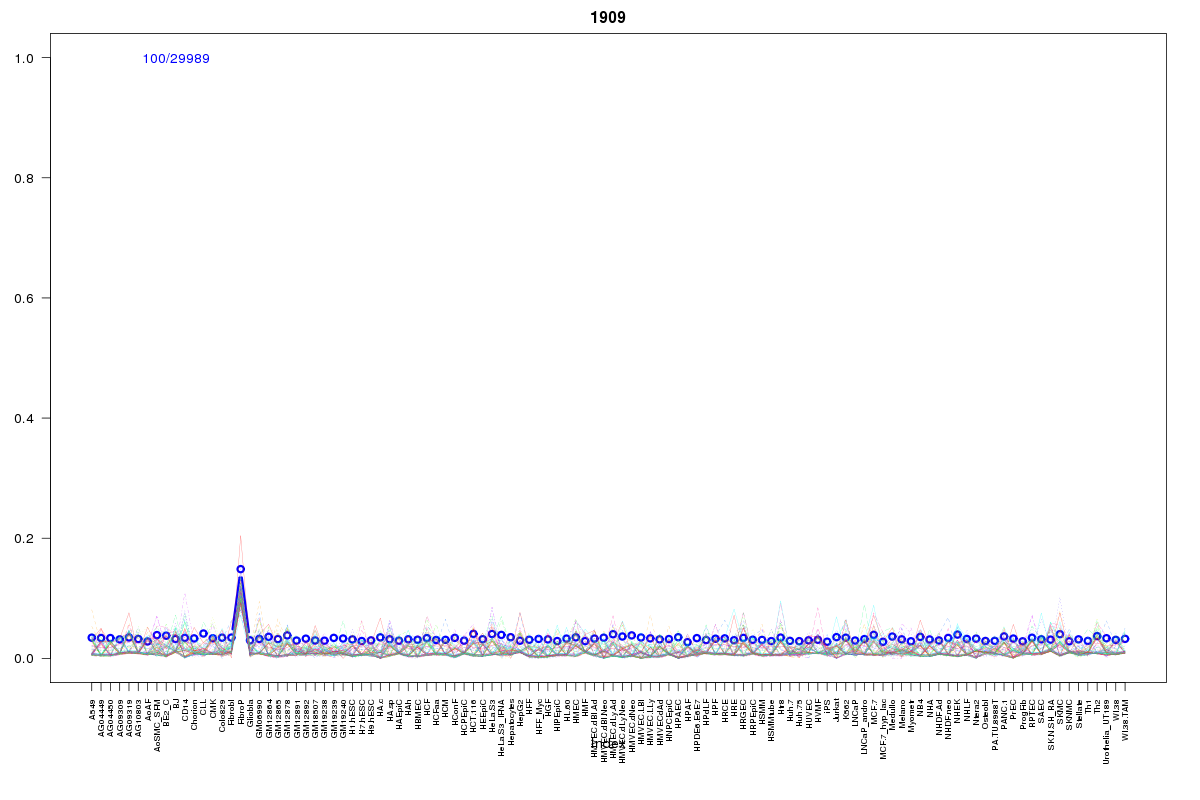 | 1909 | 1 |
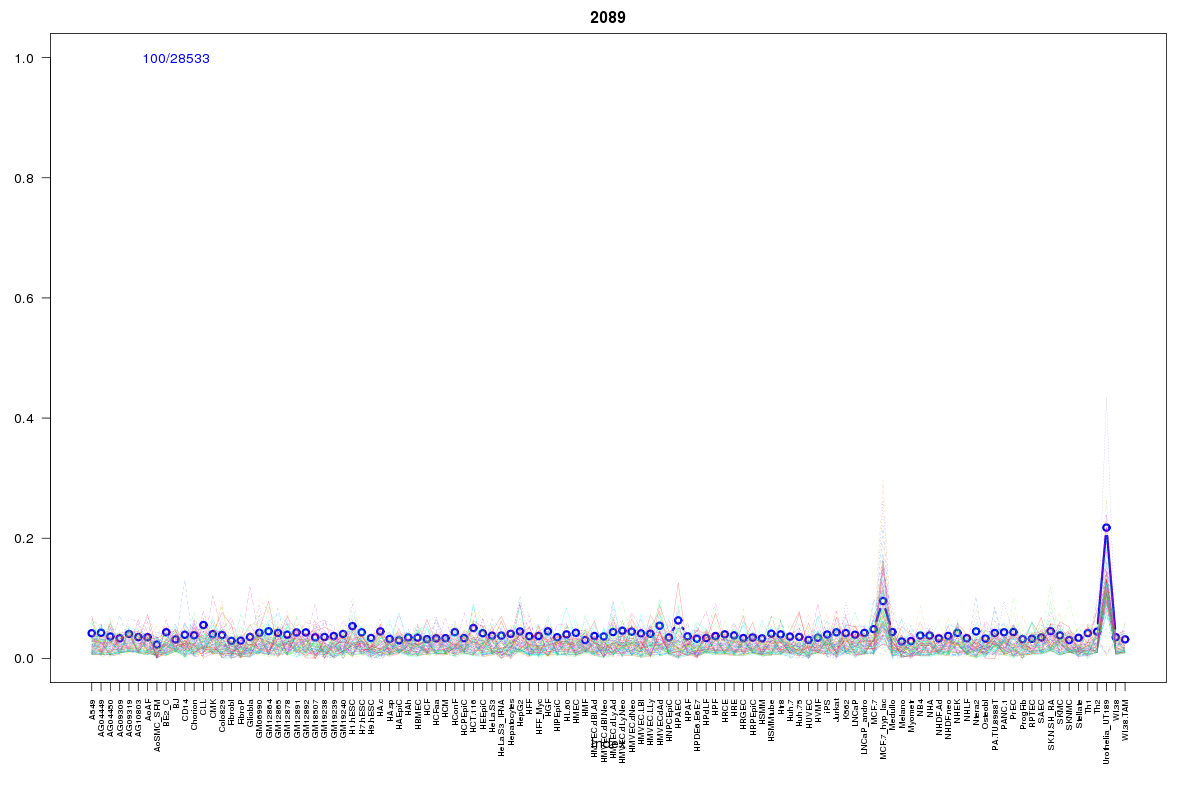 | 2089 | 1 |
 | 2122 | 1 |
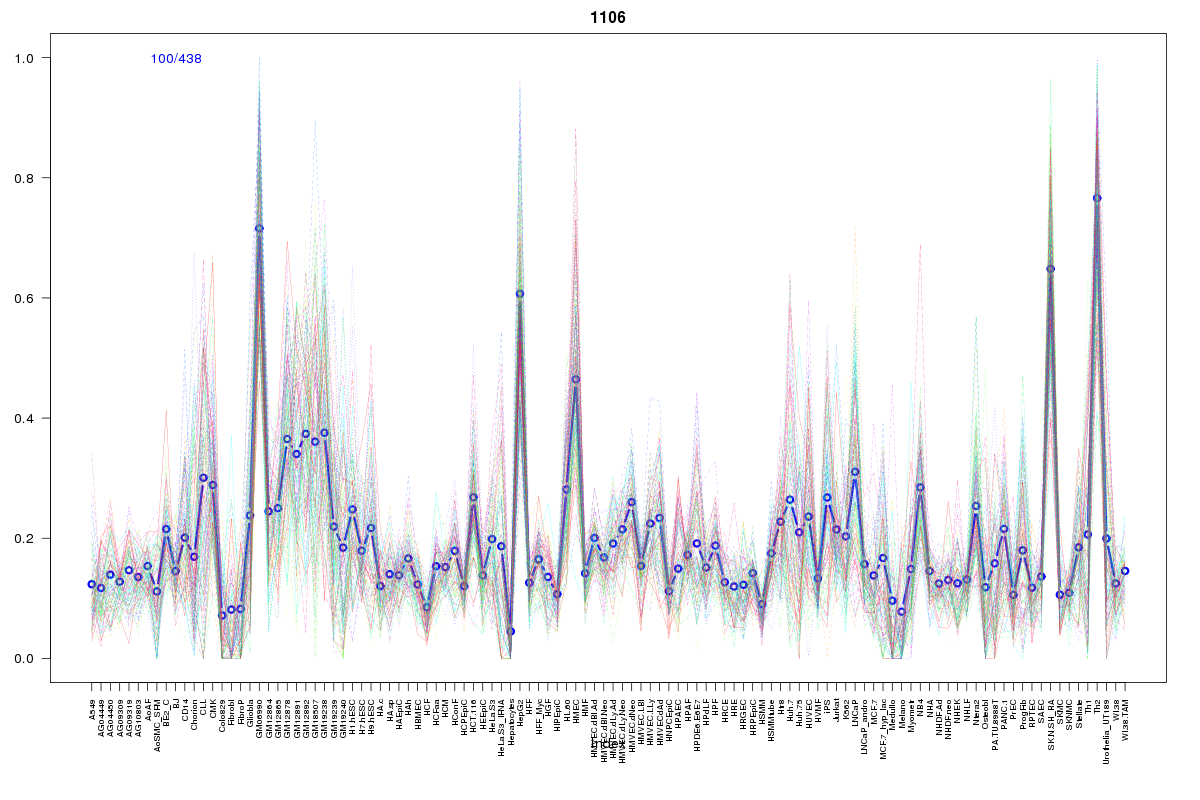 | 1106 | 1 |
 | 1509 | 1 |
 | 629 | 1 |
 | 568 | 1 |
 | 2068 | 1 |
 | 15 | 1 |
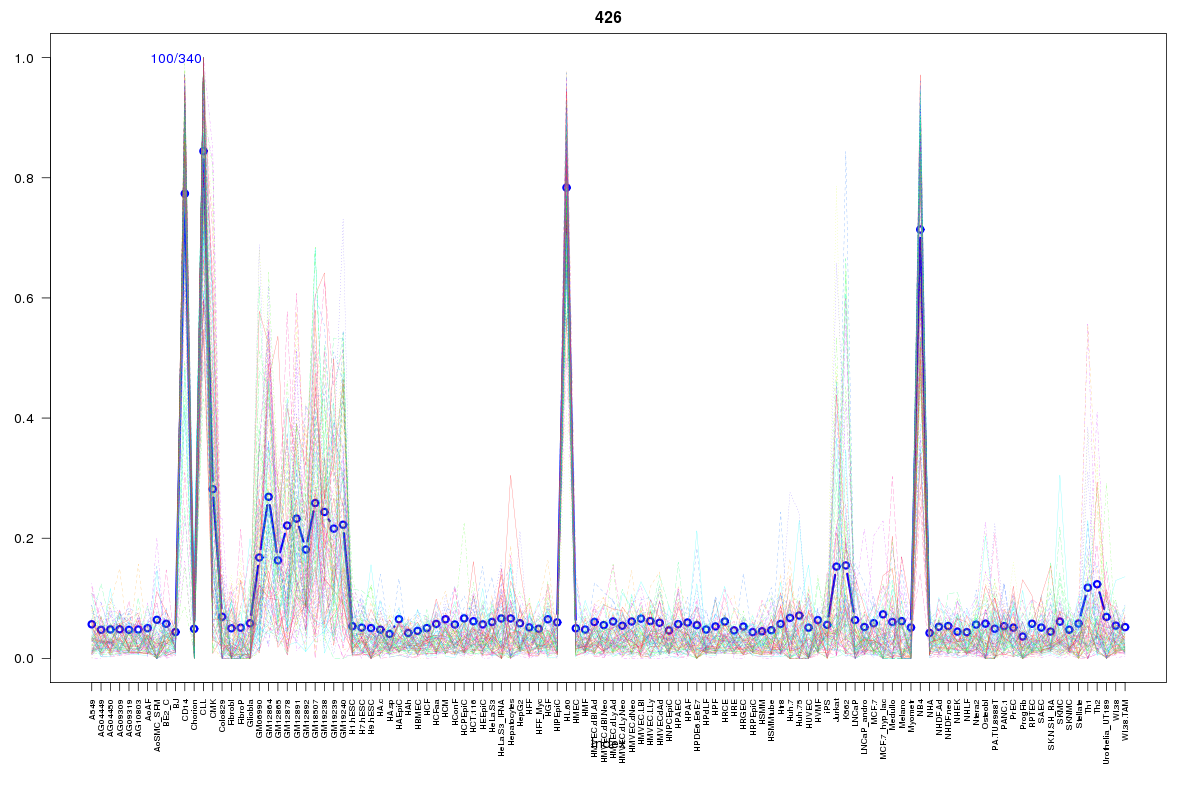 | 426 | 1 |
 | 934 | 1 |
Resources
BED file downloads
Connects to 25 DHS sitesTop 10 Correlated DHS Sites
p-values indiciate significant higher or lower correlation| Location | Cluster | P-value |
|---|---|---|
| chr1:111991520-111991670 | 1106 | 0.002 |
| chr1:111896105-111896255 | 2020 | 0.002 |
| chr1:111977845-111977995 | 2020 | 0.003 |
| chr1:112017980-112018130 | 2072 | 0.003 |
| chr1:111997960-111998110 | 2072 | 0.003 |
| chr1:112020480-112020630 | 2020 | 0.003 |
| chr1:112018300-112018450 | 2171 | 0.005 |
| chr1:111997400-111997550 | 568 | 0.006 |
| chr1:112016640-112016790 | 934 | 0.006 |
| chr1:111951725-111951875 | 1605 | 0.009 |
| chr1:112014080-112014230 | 2171 | 0.009 |
External Databases
UCSCEnsembl (ENSG00000227179)