Gene: CTB-33G10.1
chr19: 50222754-50223338Expression Profile
(log scale)
Graphical Connections
Distribution of linked clusters:
You may find it interesting if many of the connected DHS sites belong to the same cluster.| Cluster Profile | Cluster ID | Number of DHS sites in this cluster |
|---|---|---|
 | 1008 | 3 |
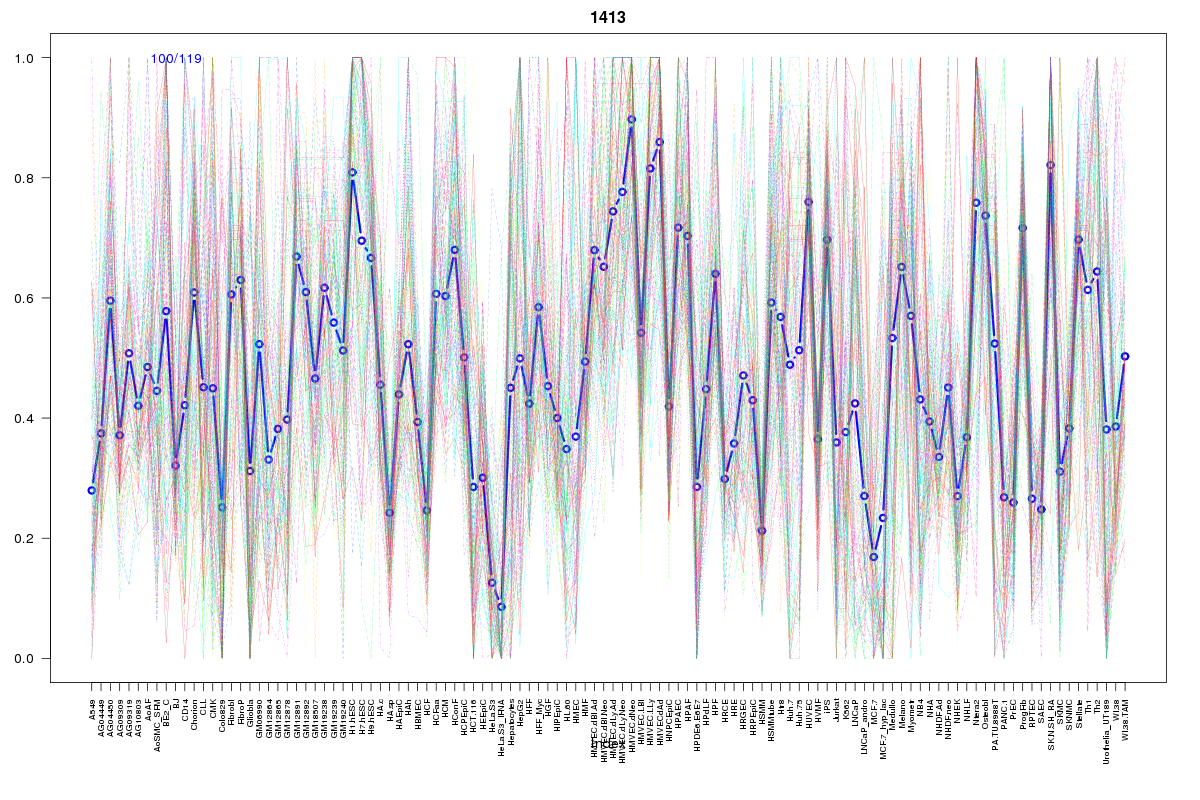 | 1413 | 2 |
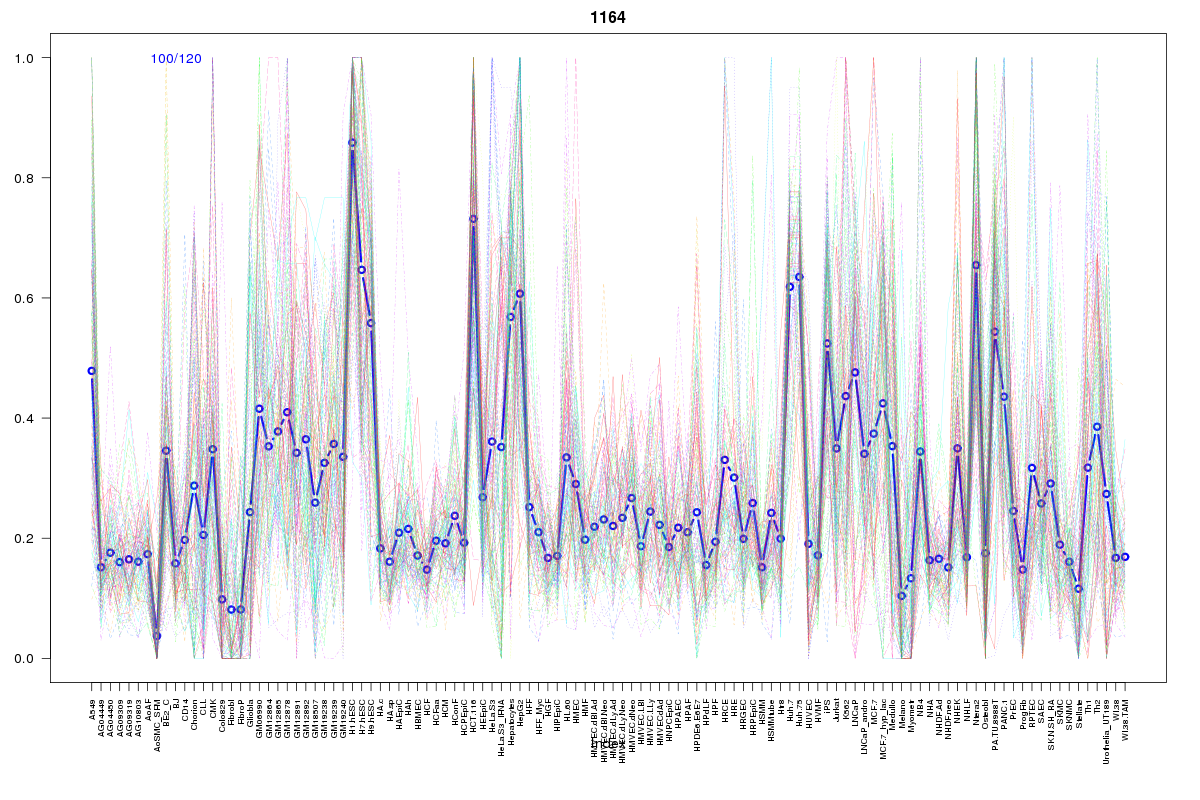 | 1164 | 1 |
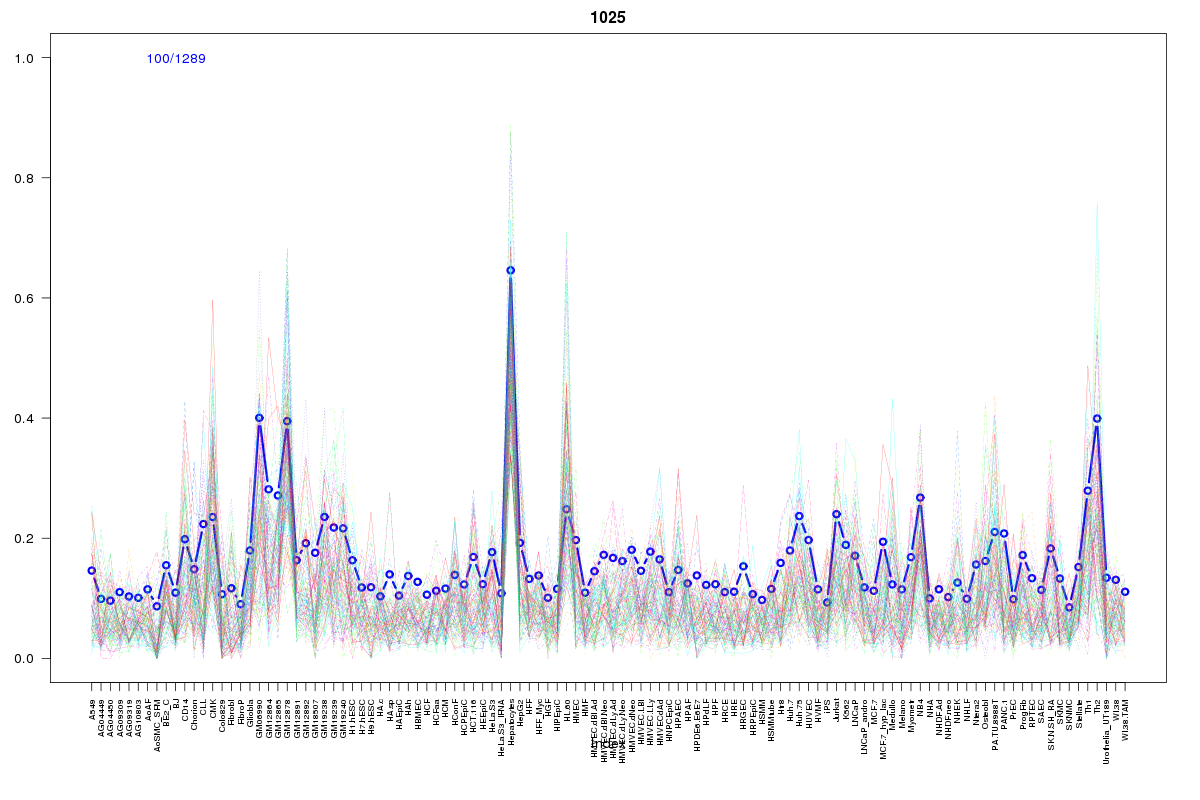 | 1025 | 1 |
 | 1056 | 1 |
 | 416 | 1 |
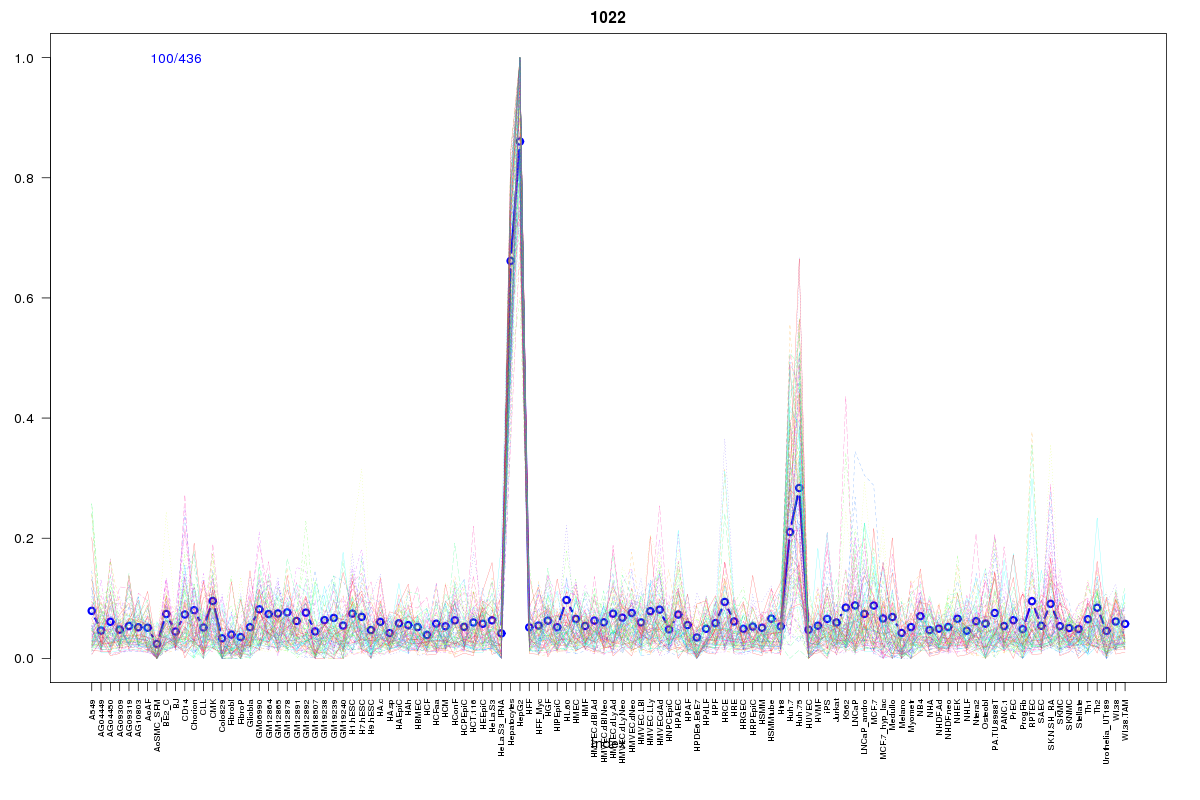 | 1022 | 1 |
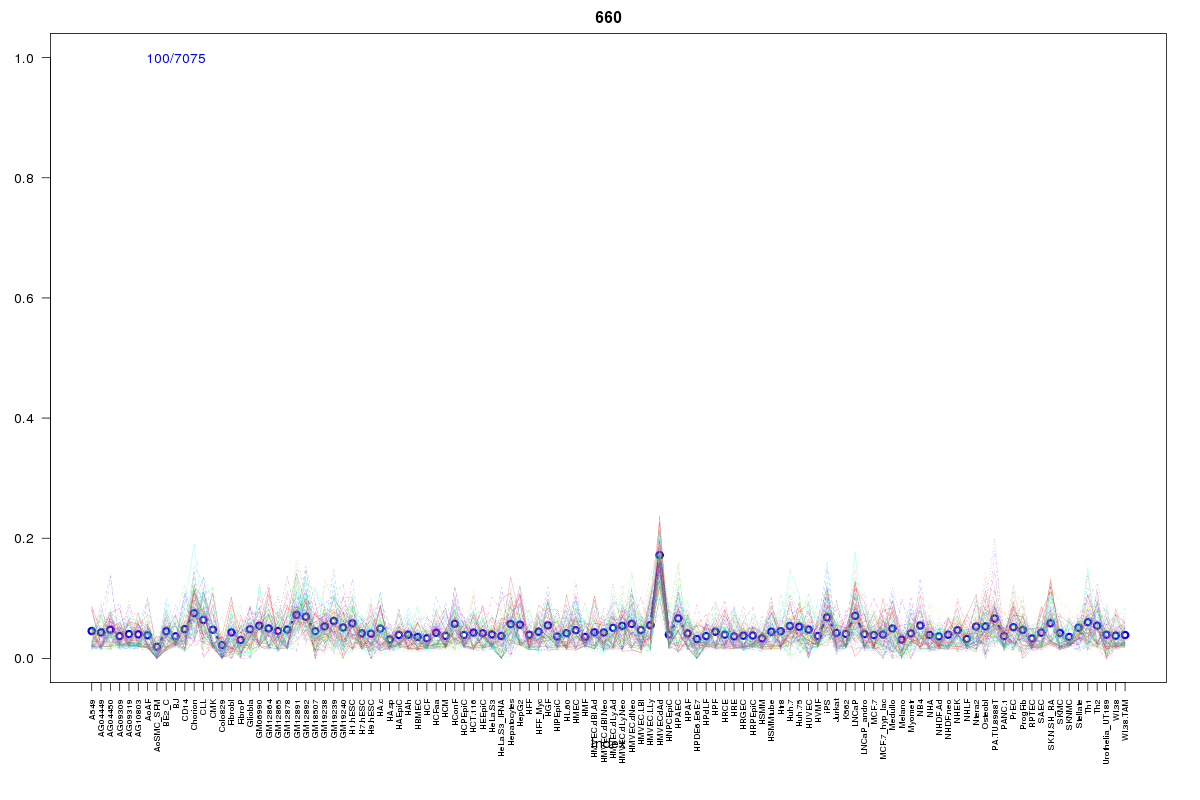 | 660 | 1 |
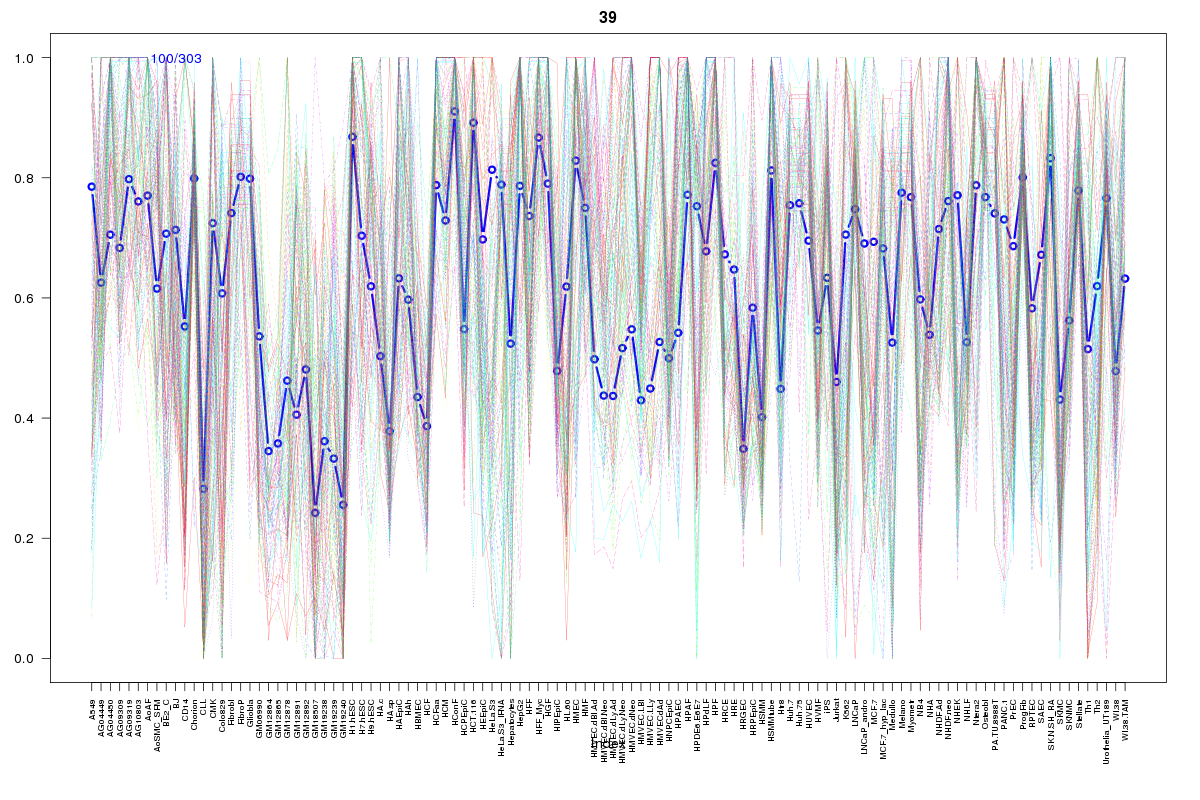 | 39 | 1 |
 | 881 | 1 |
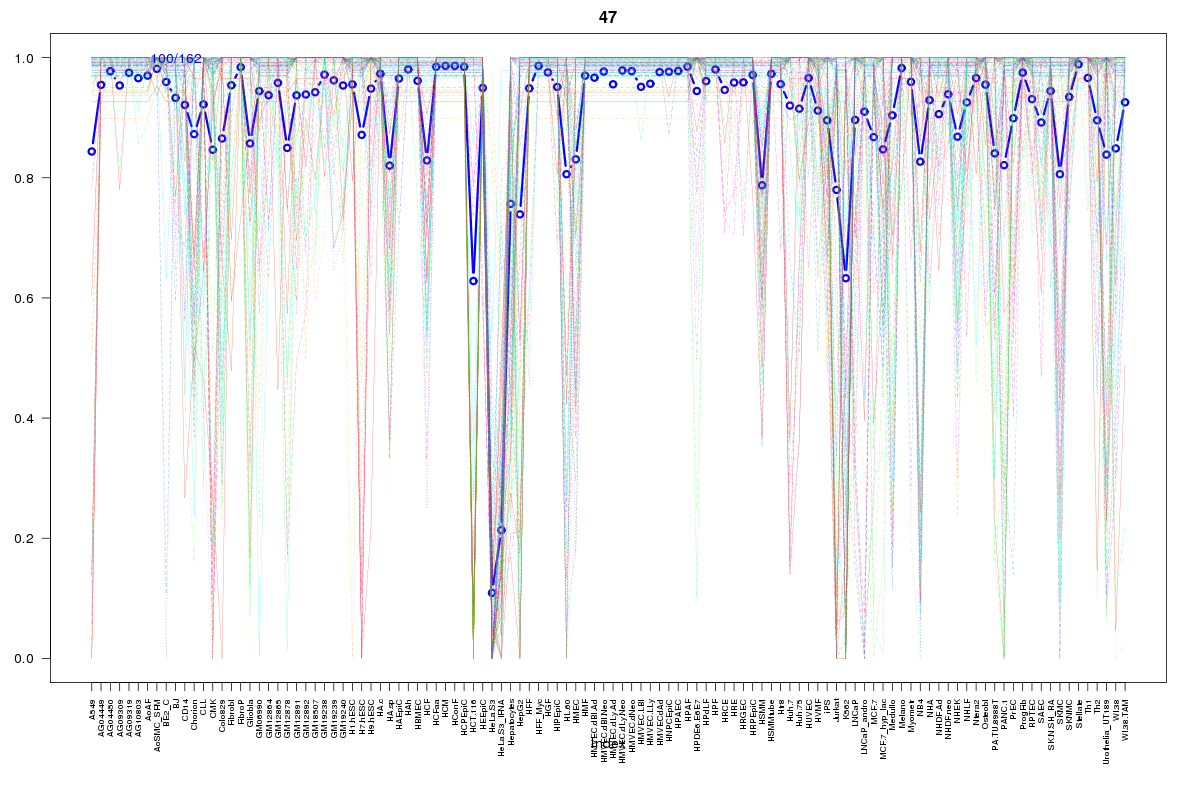 | 47 | 1 |
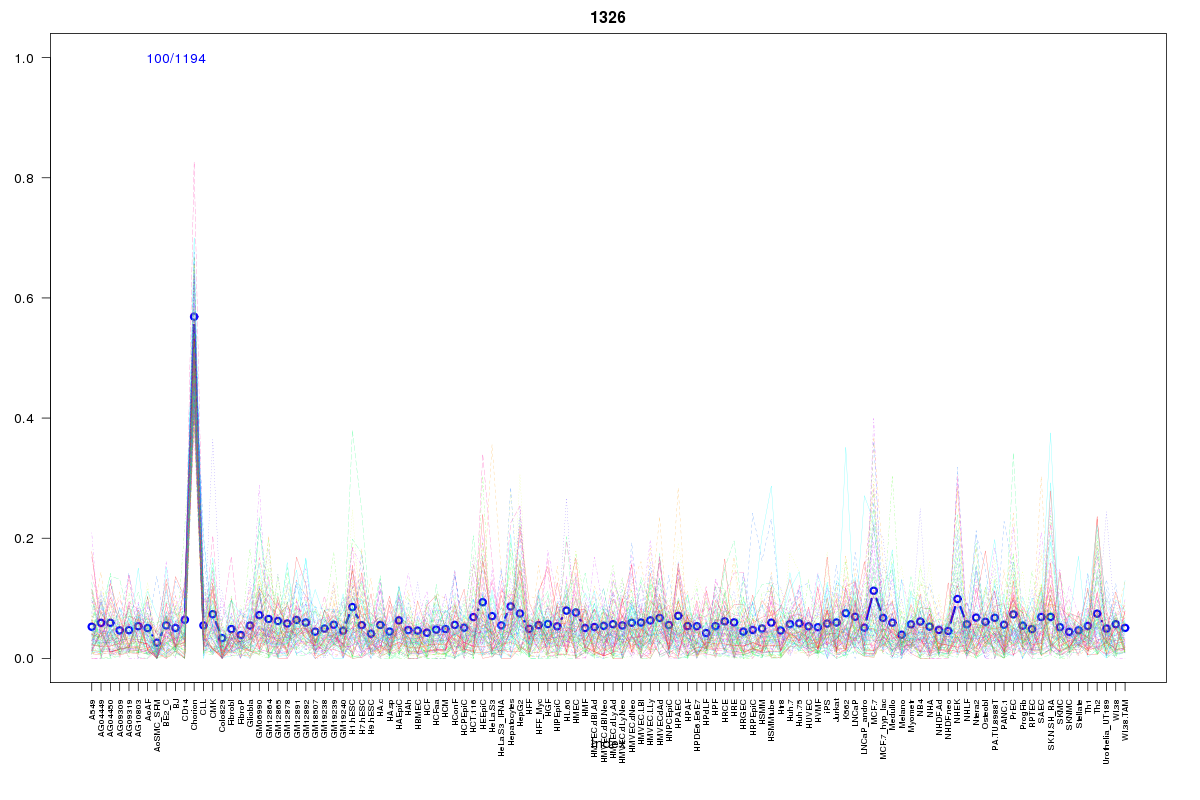 | 1326 | 1 |
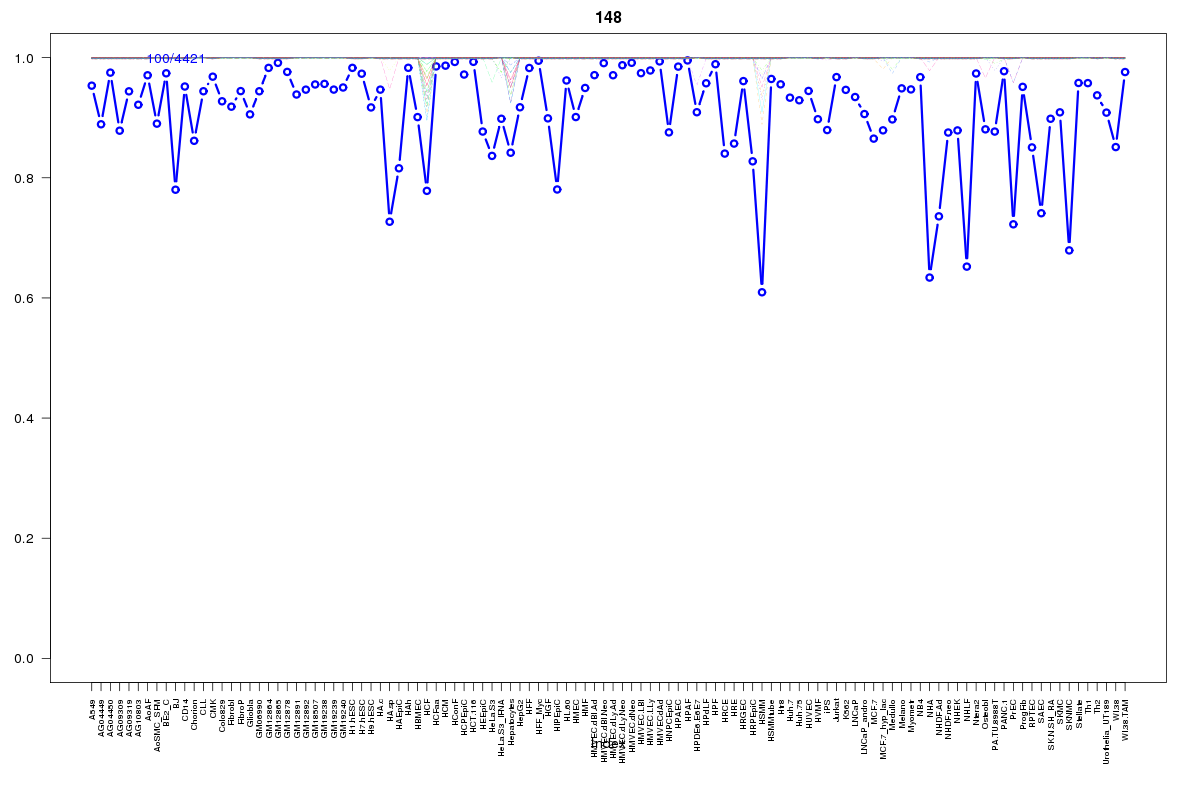 | 148 | 1 |
 | 309 | 1 |
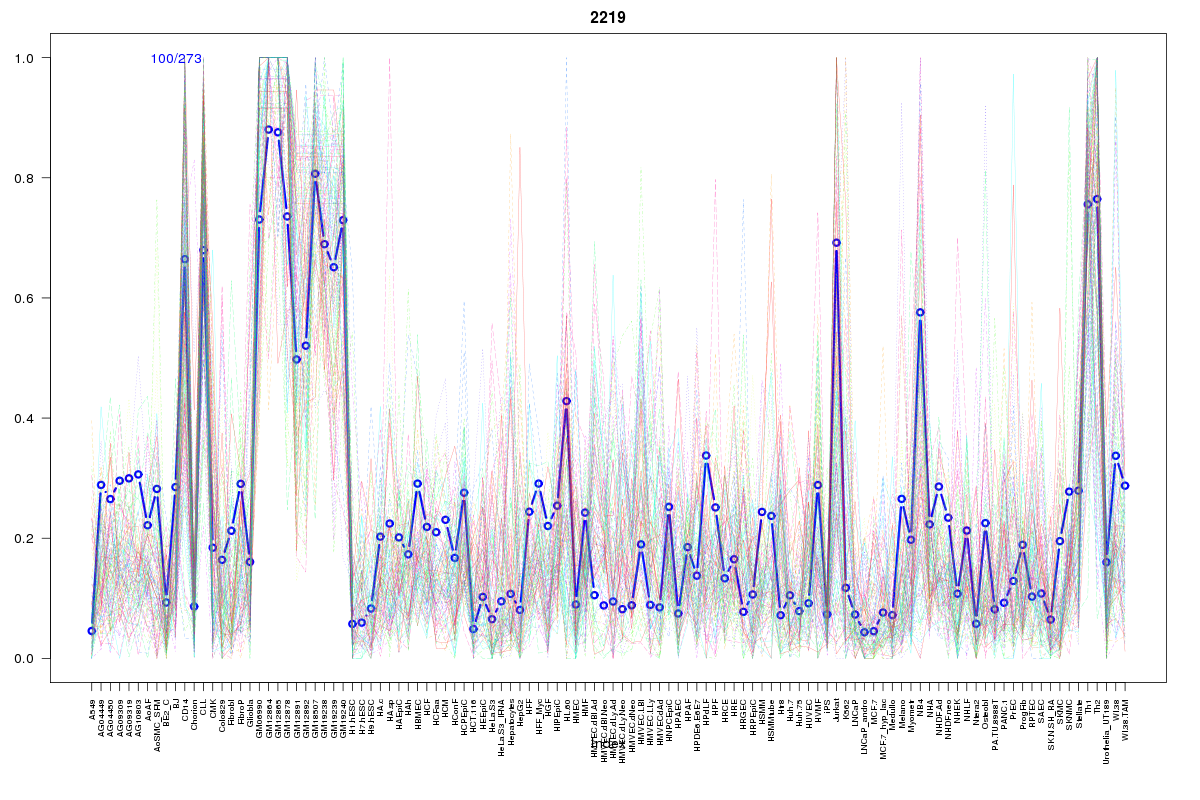 | 2219 | 1 |
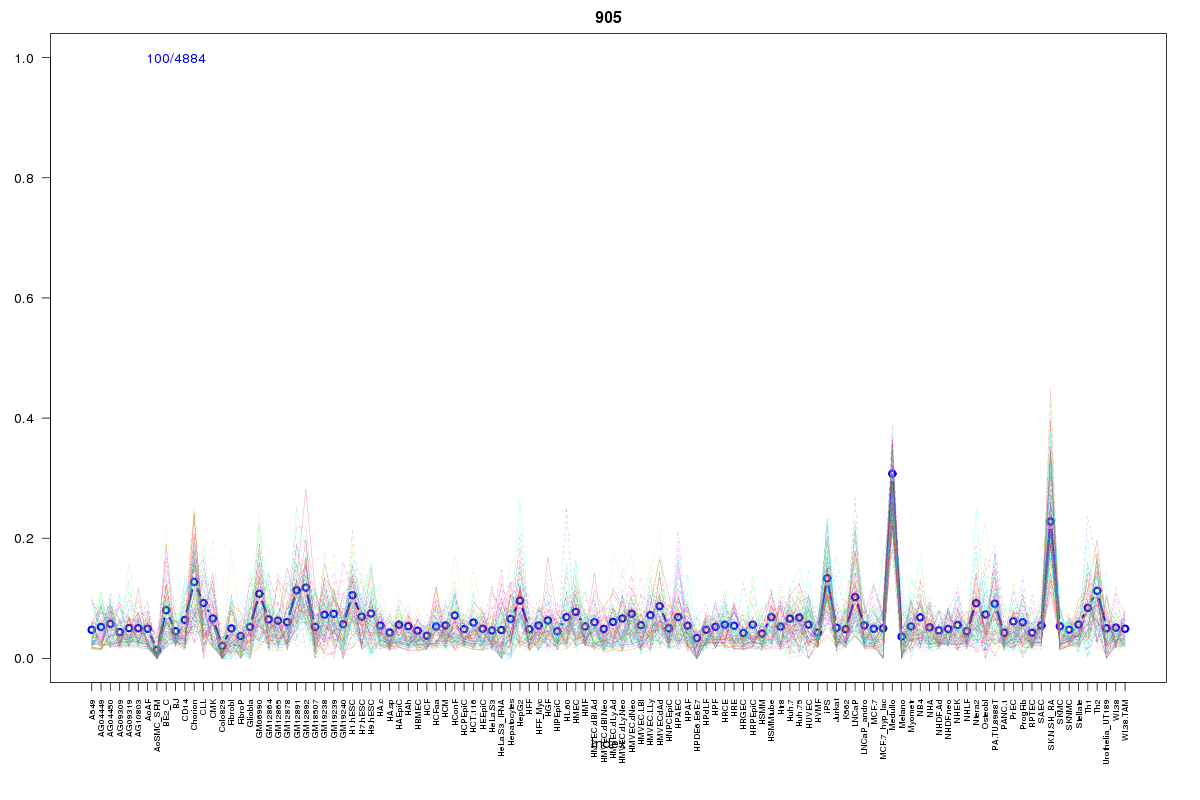 | 905 | 1 |
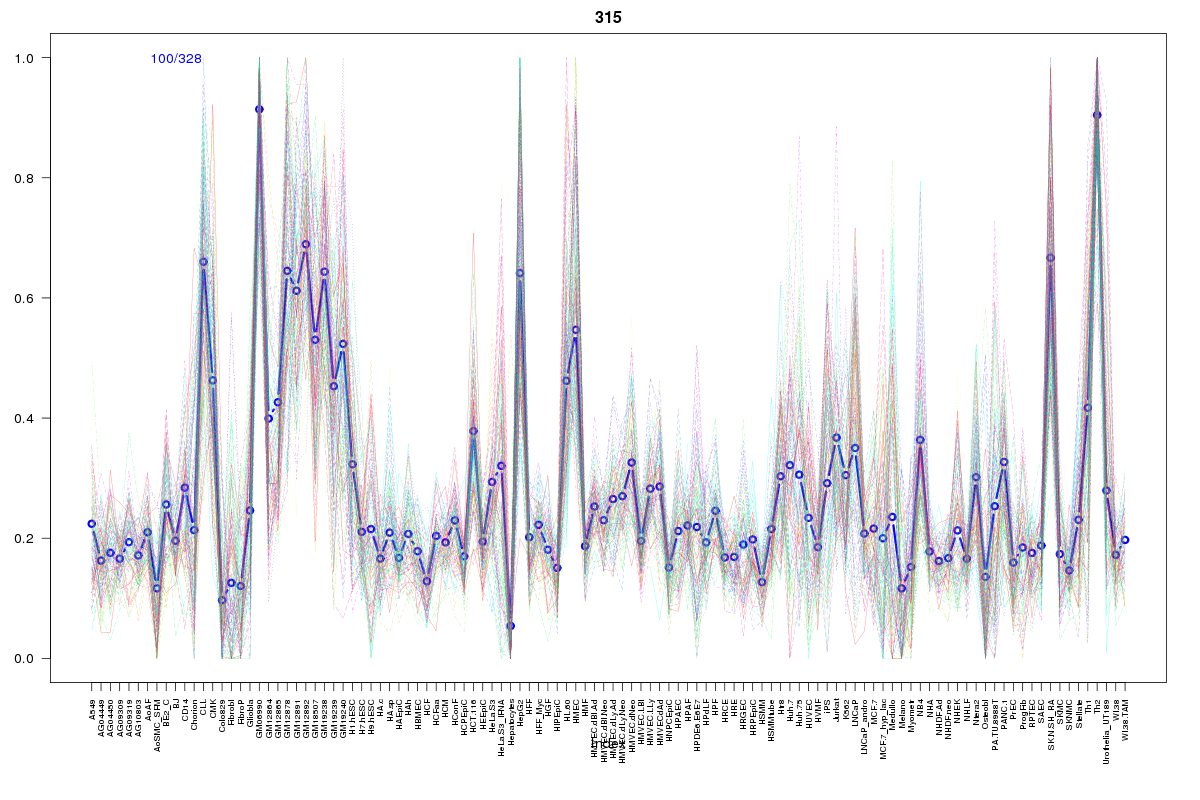 | 315 | 1 |
 | 615 | 1 |
Resources
BED file downloads
Connects to 21 DHS sitesTop 10 Correlated DHS Sites
p-values indiciate significant higher or lower correlation| Location | Cluster | P-value |
|---|---|---|
| chr19:50183705-50183855 | 1056 | 0.001 |
| chr19:50219705-50219855 | 416 | 0.008 |
| chr19:50321700-50321850 | 2219 | 0.012 |
| chr19:50163480-50163630 | 905 | 0.012 |
| chr19:50311405-50311555 | 881 | 0.012 |
| chr19:50181905-50182055 | 1025 | 0.016 |
| chr19:50175425-50175575 | 1164 | 0.023 |
| chr19:50170900-50171050 | 615 | 0.023 |
| chr19:50167460-50167610 | 315 | 0.023 |
| chr19:50275080-50275230 | 1022 | 0.023 |
| chr19:50194645-50194795 | 1413 | 0.02 |
External Databases
UCSCEnsembl (ENSG00000243829)