Gene: ATP2B1
chr12: 89981827-90049844Expression Profile
(log scale)
Graphical Connections
Distribution of linked clusters:
You may find it interesting if many of the connected DHS sites belong to the same cluster.| Cluster Profile | Cluster ID | Number of DHS sites in this cluster |
|---|---|---|
 | 1721 | 2 |
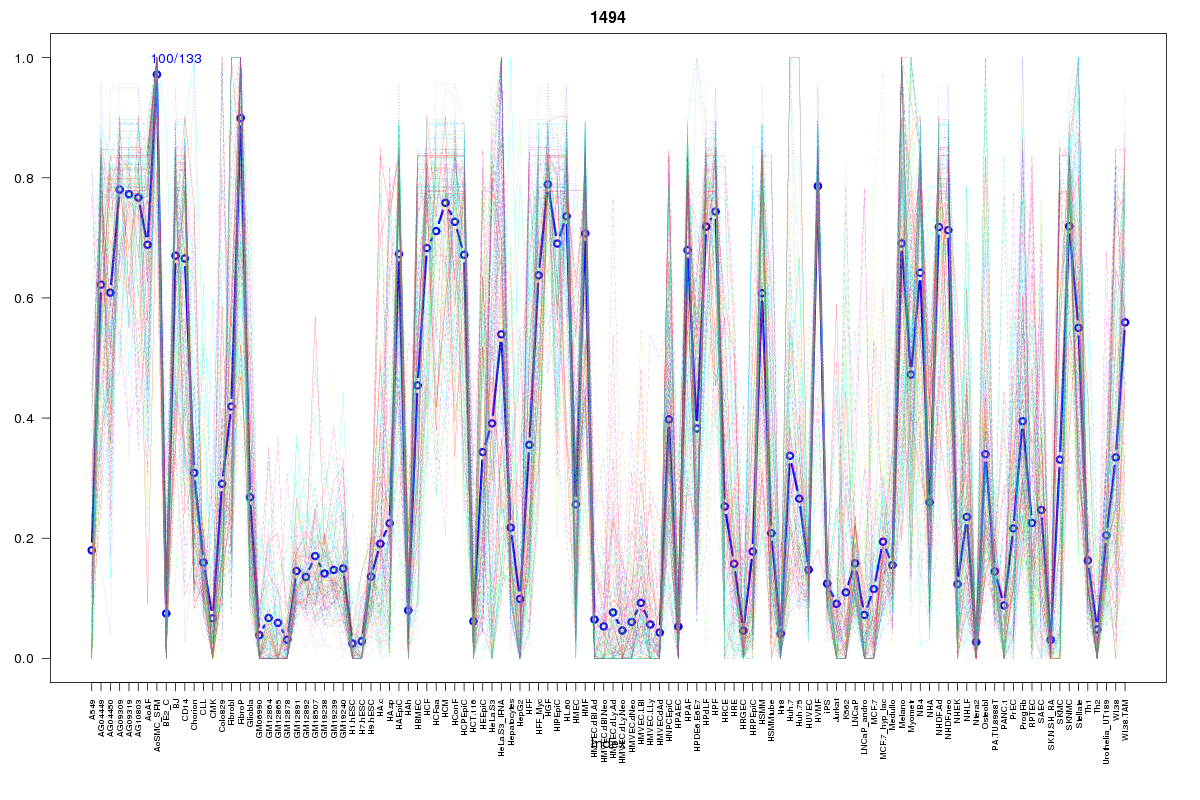 | 1494 | 1 |
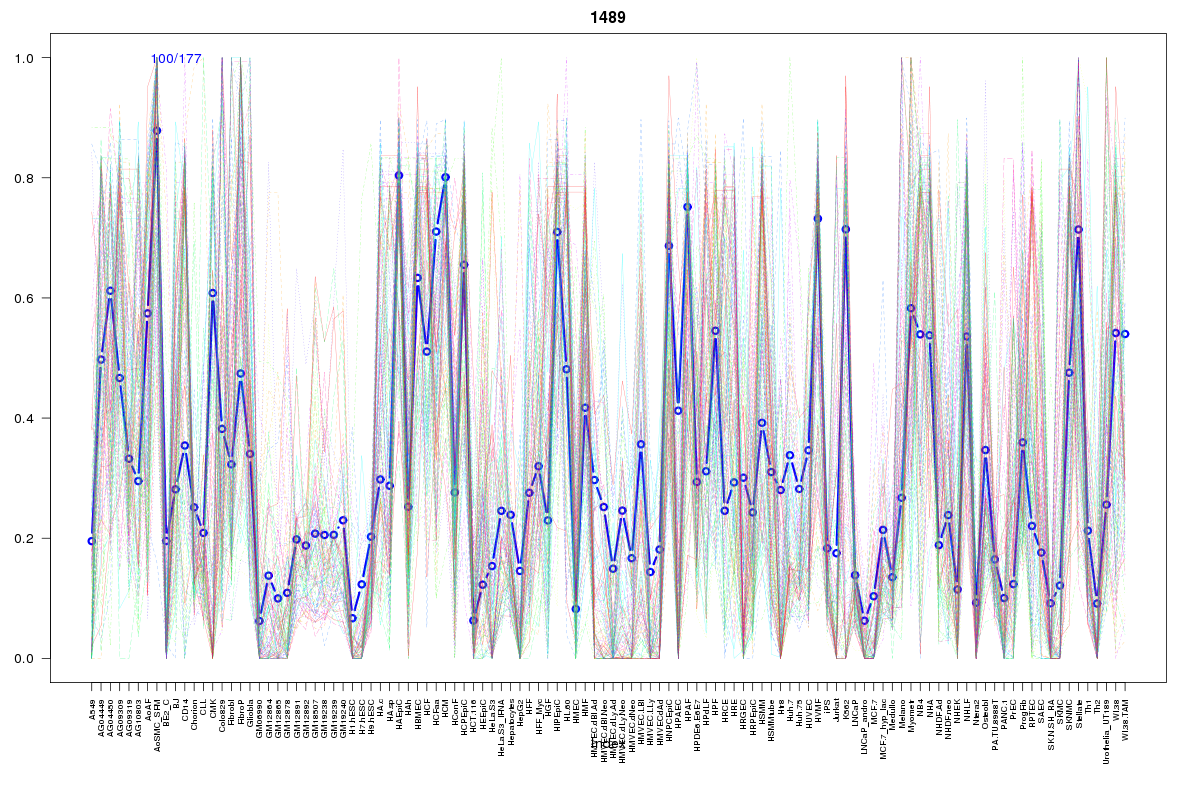 | 1489 | 1 |
 | 934 | 1 |
 | 15 | 1 |
 | 207 | 1 |
 | 1449 | 1 |
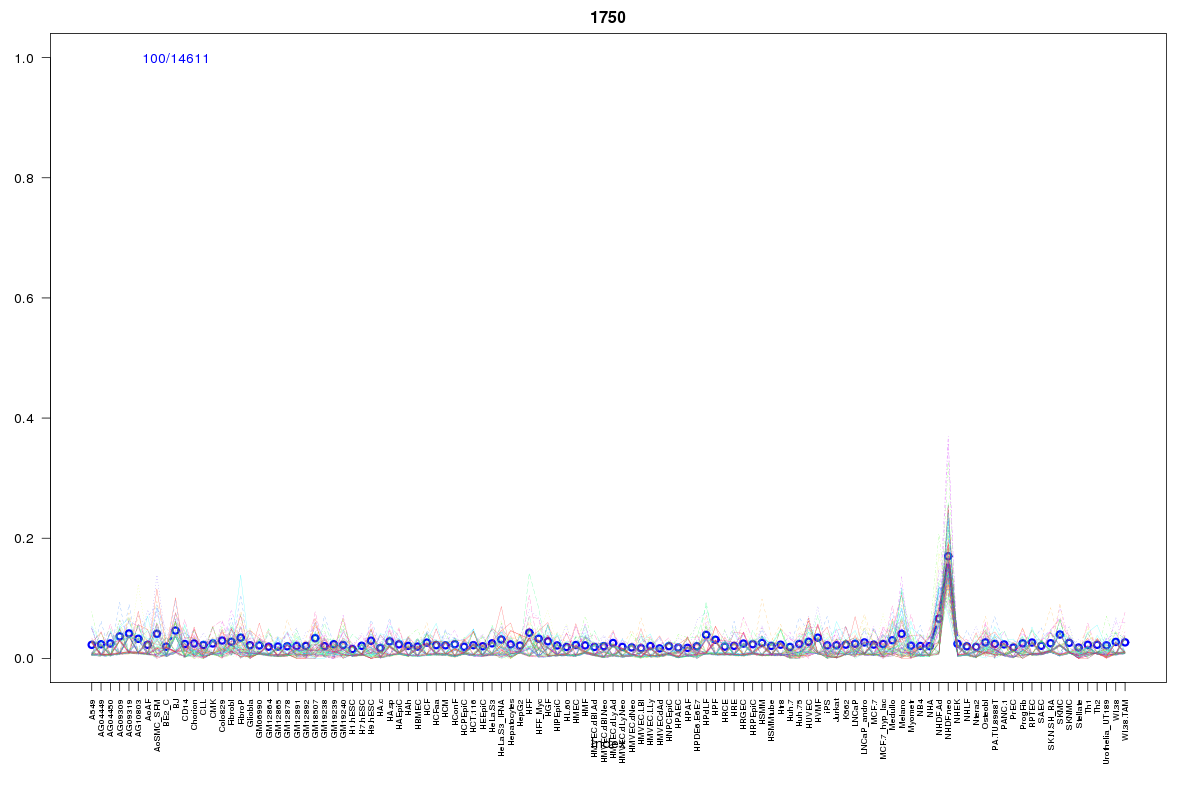 | 1750 | 1 |
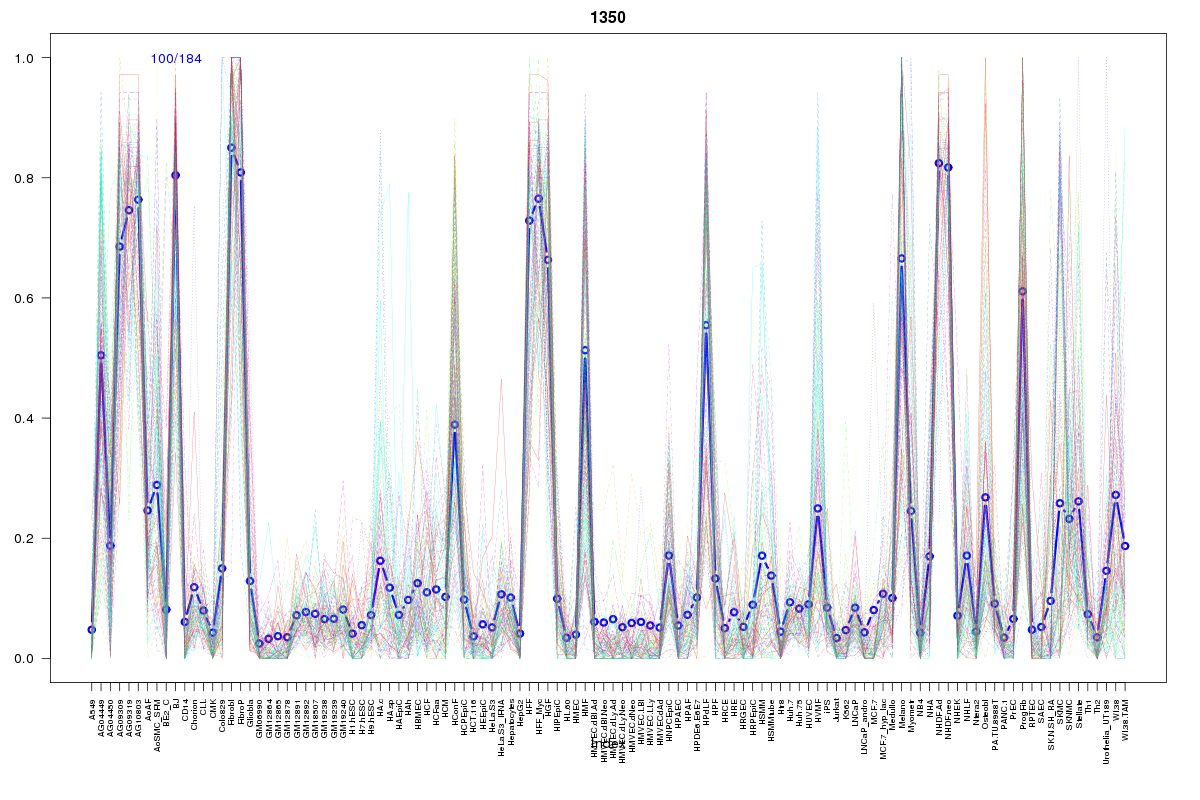 | 1350 | 1 |
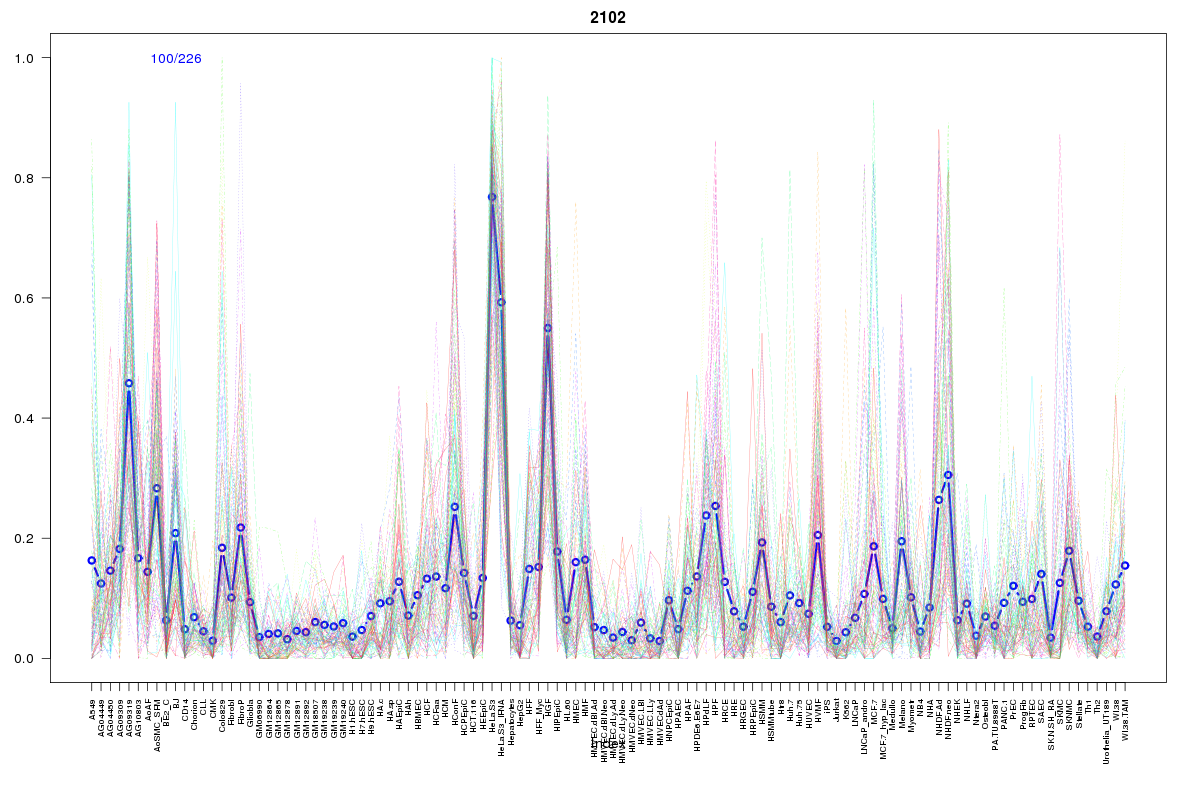 | 2102 | 1 |
 | 416 | 1 |
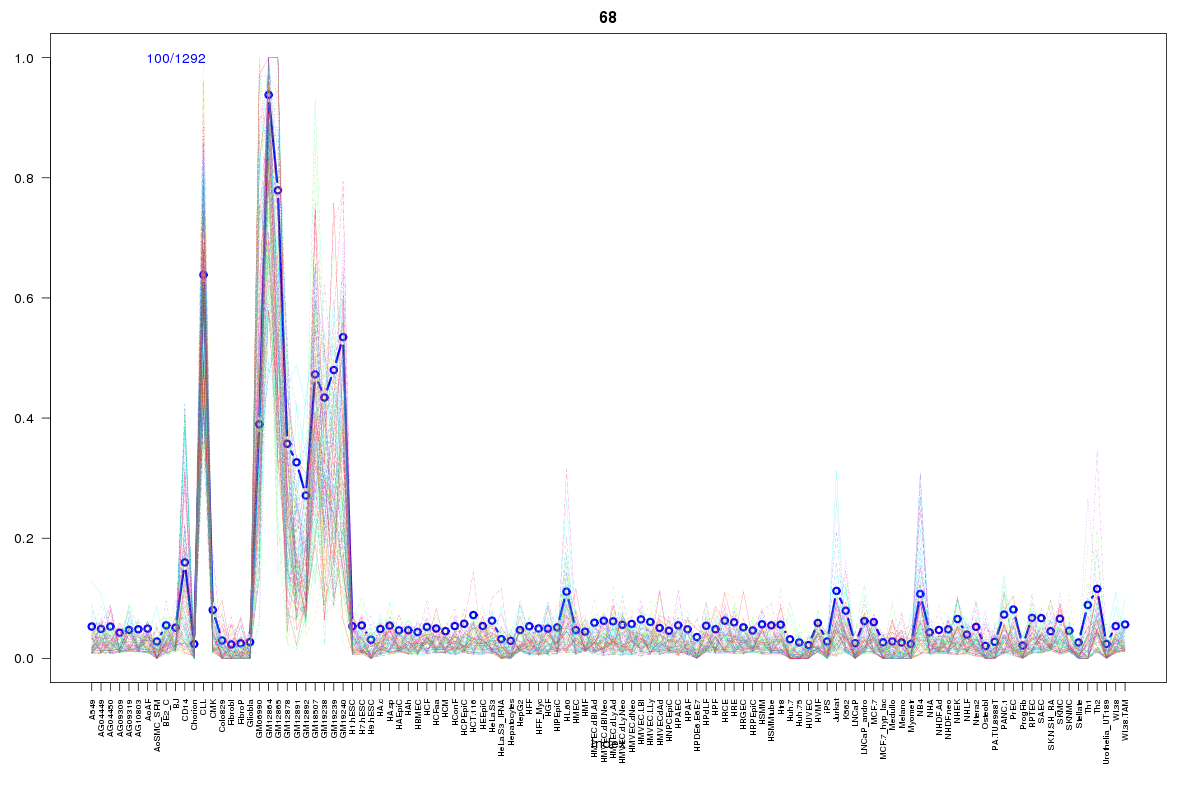 | 68 | 1 |
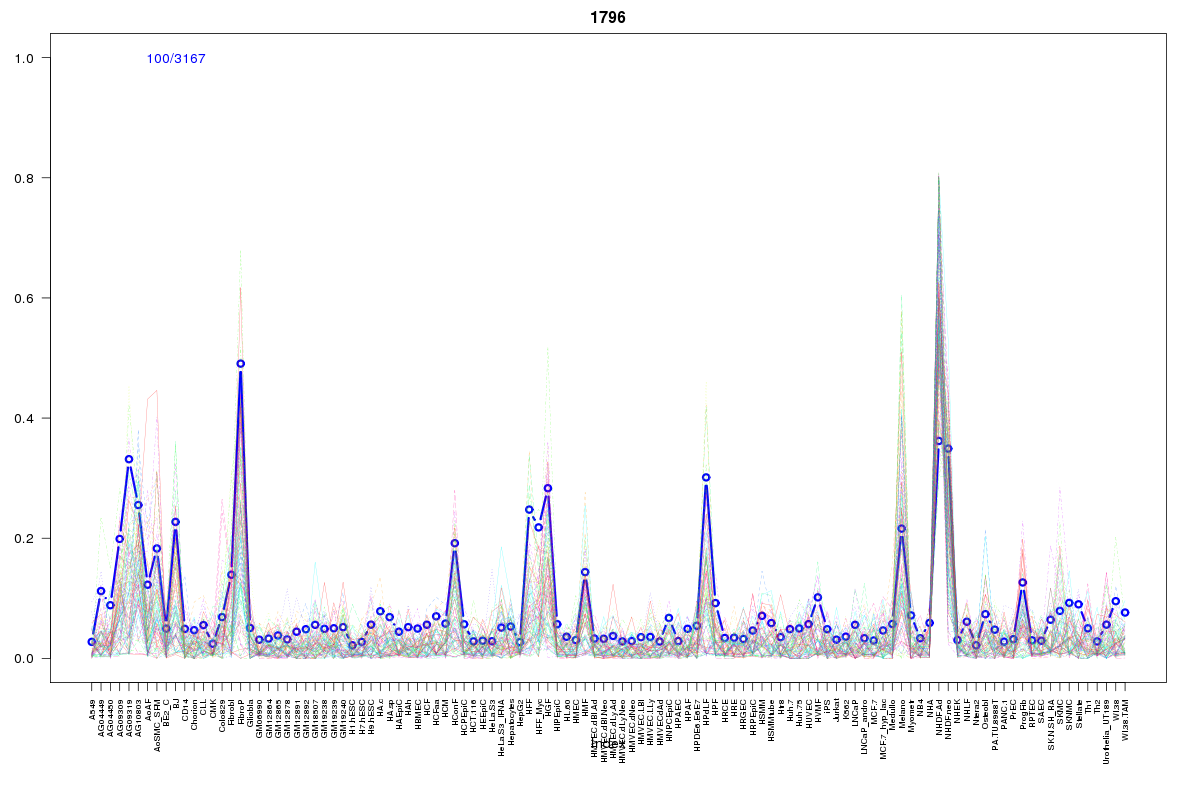 | 1796 | 1 |
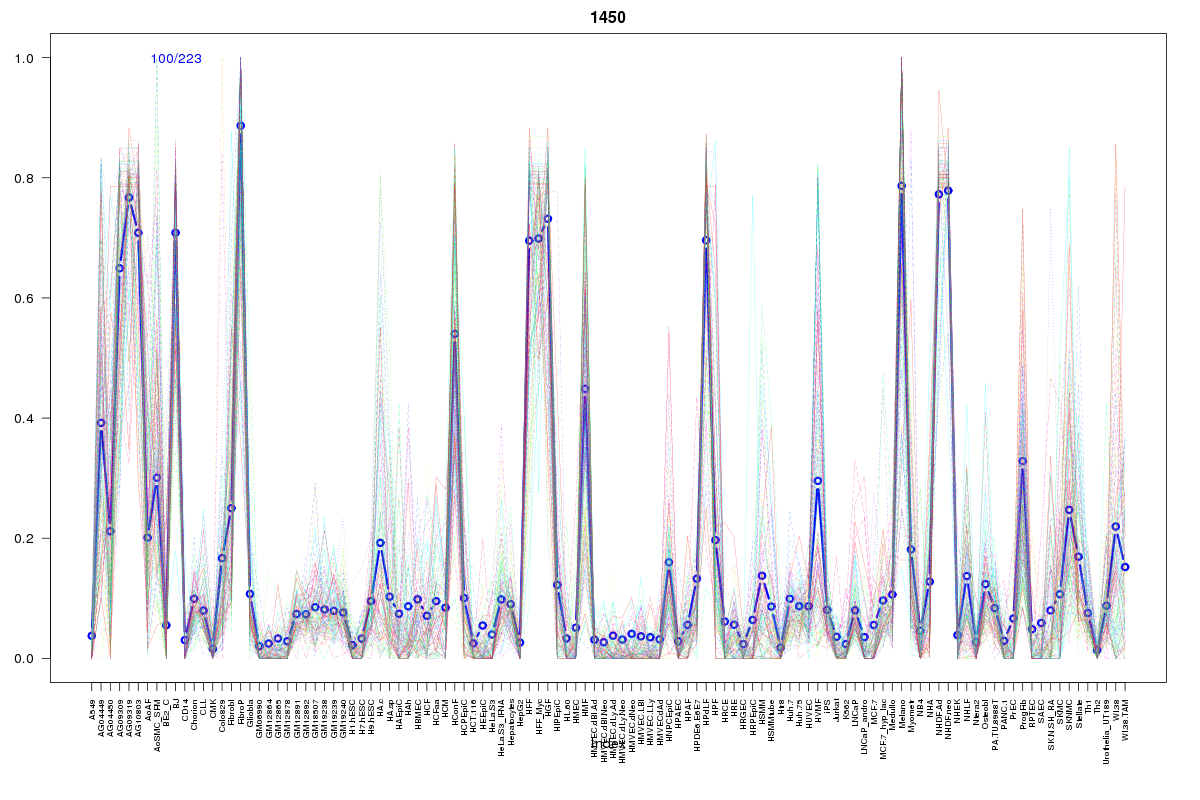 | 1450 | 1 |
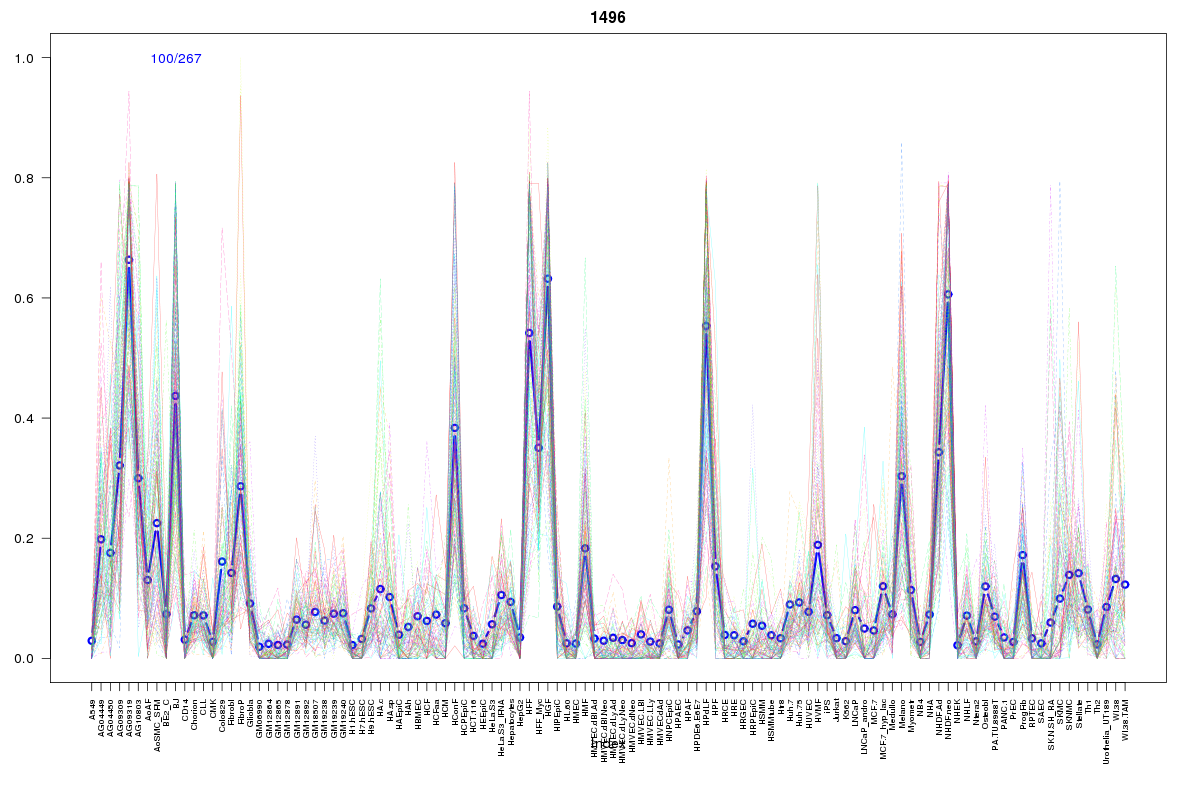 | 1496 | 1 |
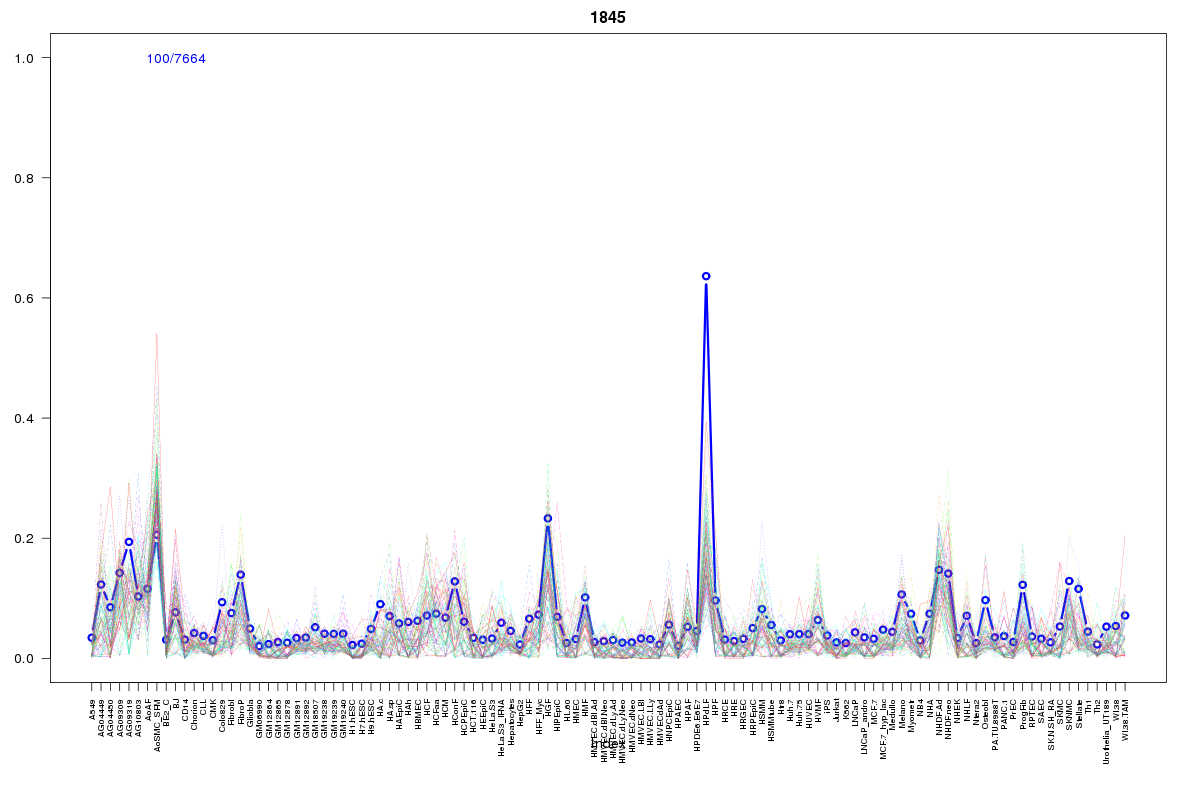 | 1845 | 1 |
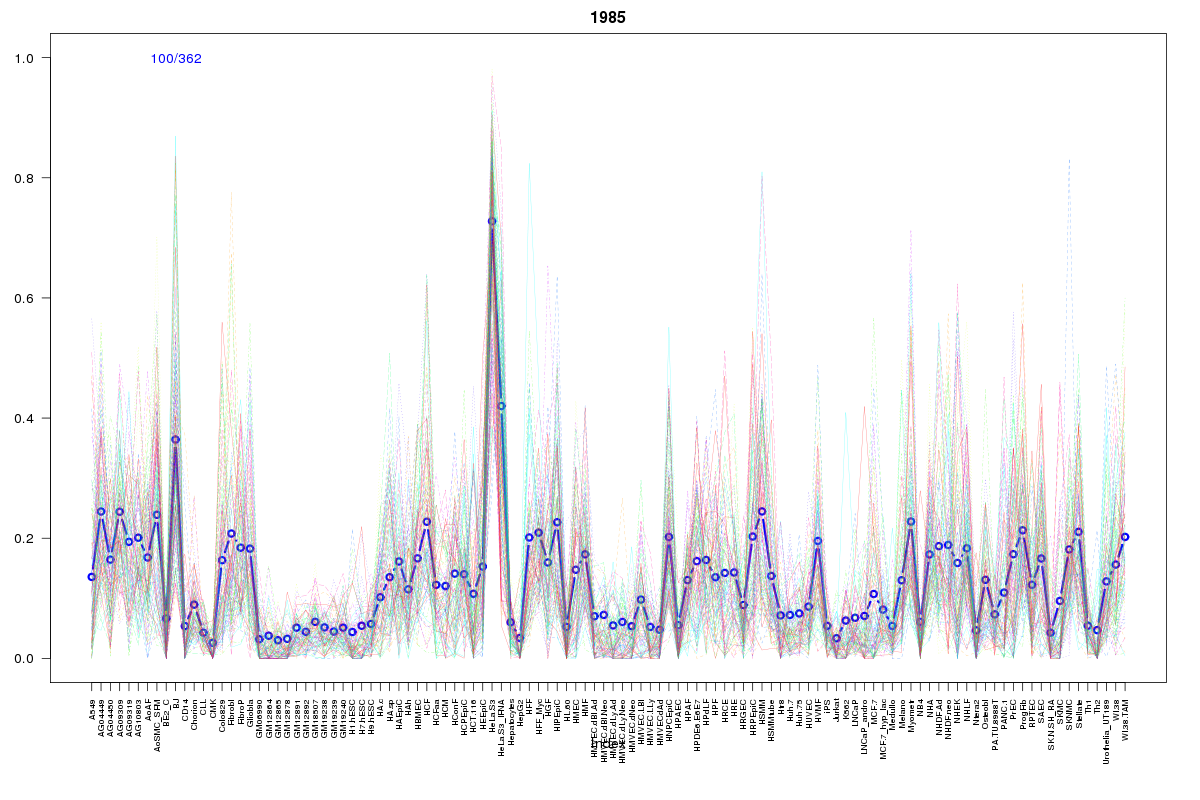 | 1985 | 1 |
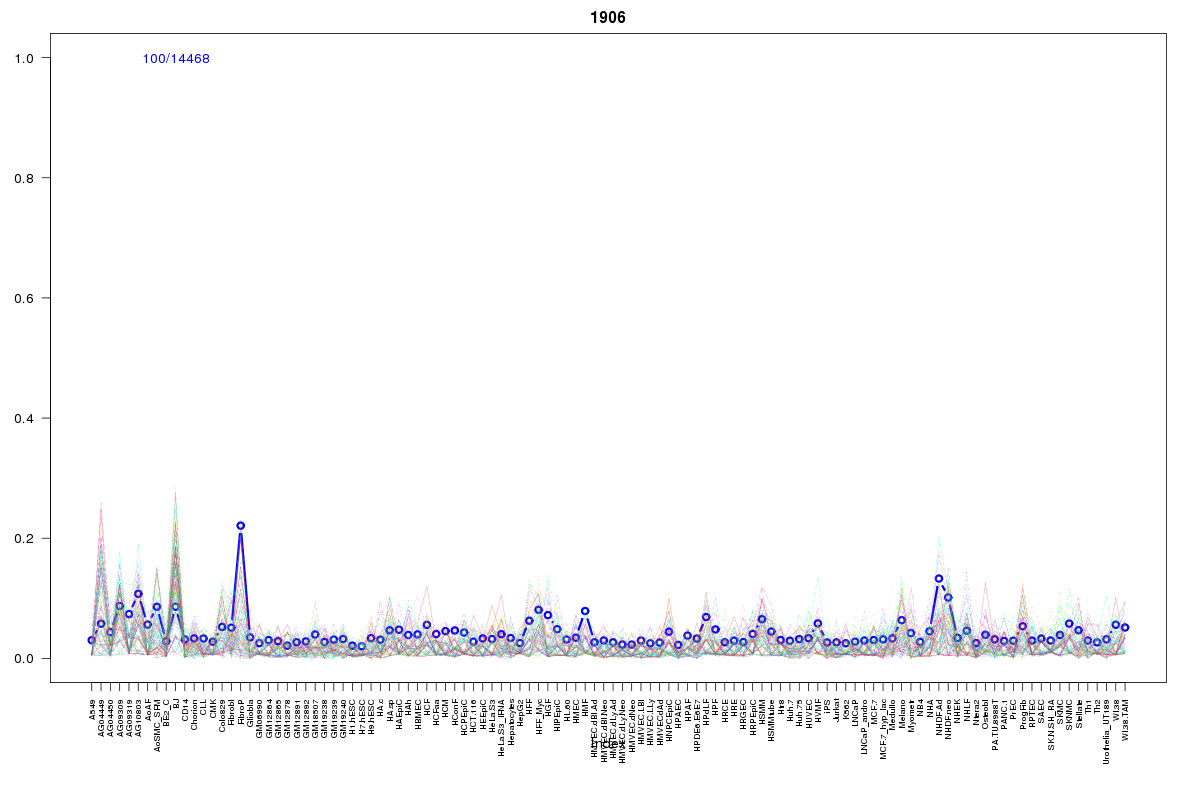 | 1906 | 1 |
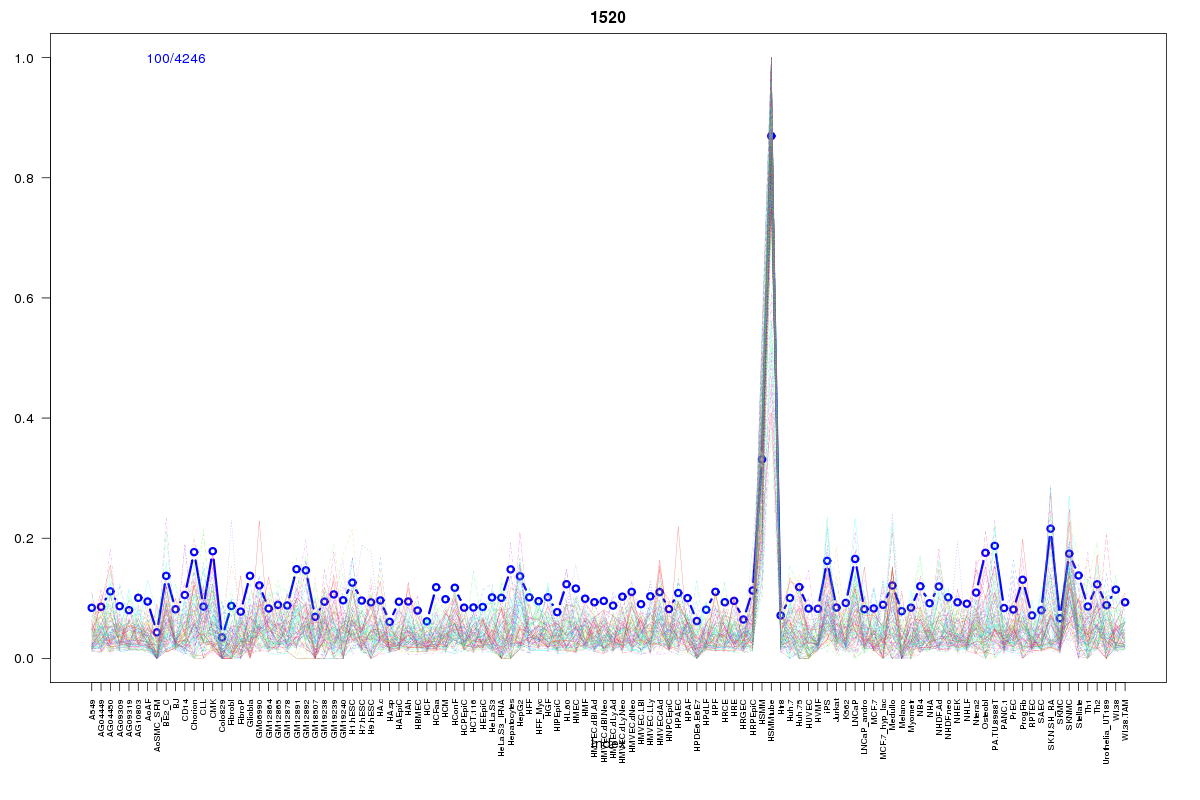 | 1520 | 1 |
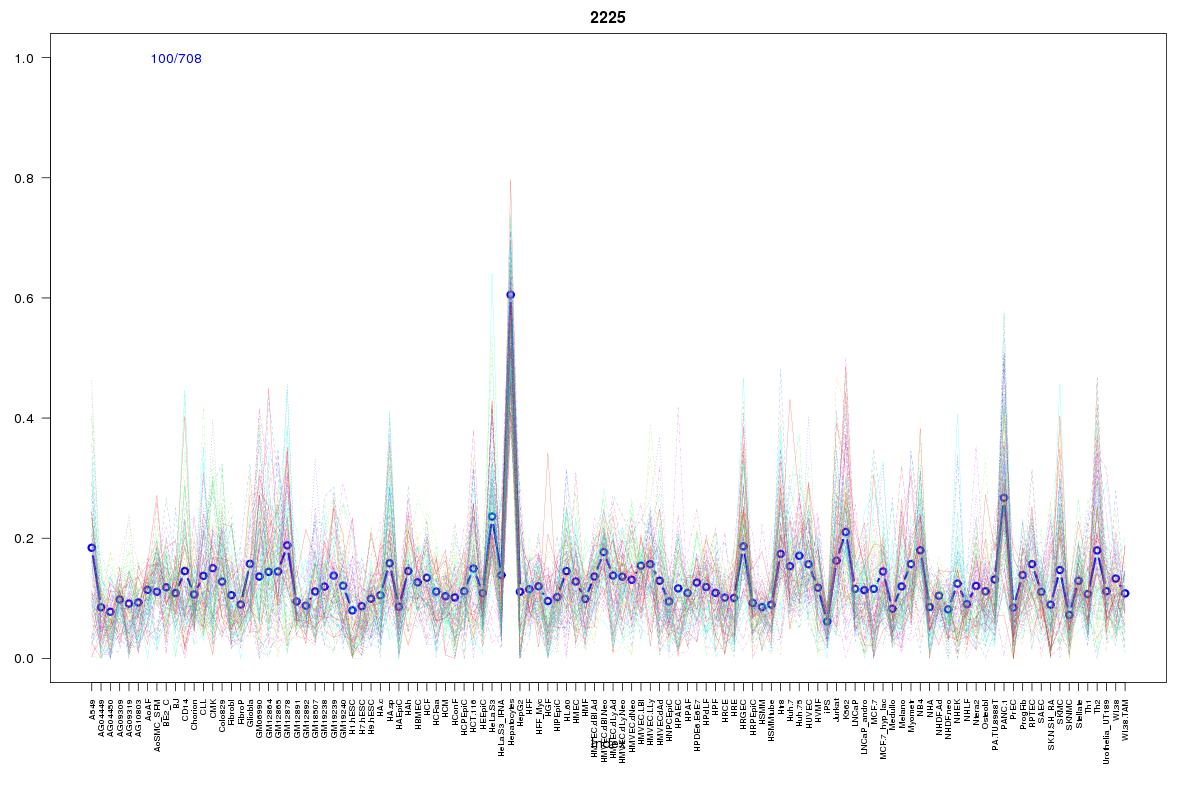 | 2225 | 1 |
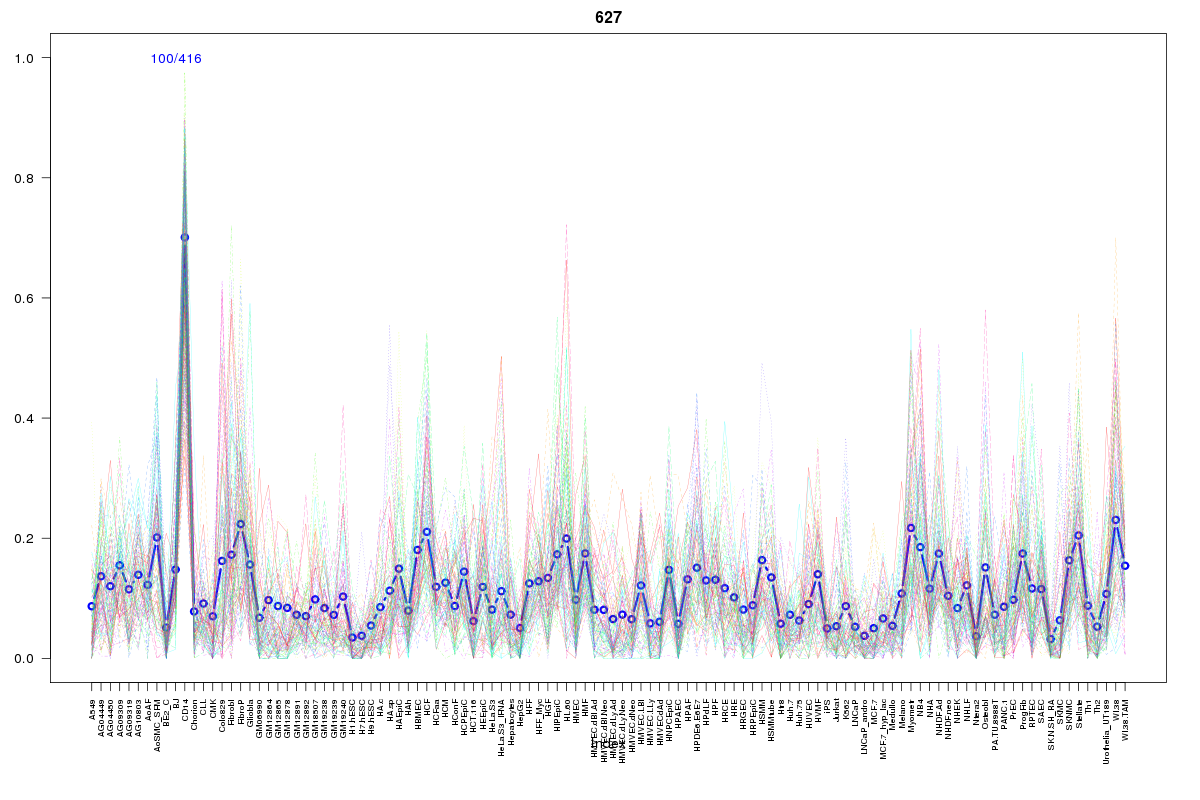 | 627 | 1 |
Resources
BED file downloads
Connects to 22 DHS sitesTop 10 Correlated DHS Sites
p-values indiciate significant higher or lower correlation| Location | Cluster | P-value |
|---|---|---|
| chr12:89965740-89965890 | 1450 | 0 |
| chr12:90144820-90144970 | 1350 | 0 |
| chr12:89965360-89965510 | 1796 | 0 |
| chr12:90145005-90145155 | 2102 | 0.002 |
| chr12:89968760-89968910 | 1496 | 0.003 |
| chr12:90057900-90058050 | 1985 | 0.004 |
| chr12:90056520-90056670 | 1845 | 0.004 |
| chr12:89963320-89963470 | 416 | 0.008 |
| chr12:90101040-90101190 | 2225 | 0.009 |
| chr12:90084820-90084970 | 1520 | 0.009 |
| chr12:90144660-90144810 | 1449 | 0.01 |
External Databases
UCSCEnsembl (ENSG00000070961)