Gene: TRPM5
chr11: 2425744-2444275Expression Profile
(log scale)
Graphical Connections
Distribution of linked clusters:
You may find it interesting if many of the connected DHS sites belong to the same cluster.| Cluster Profile | Cluster ID | Number of DHS sites in this cluster |
|---|---|---|
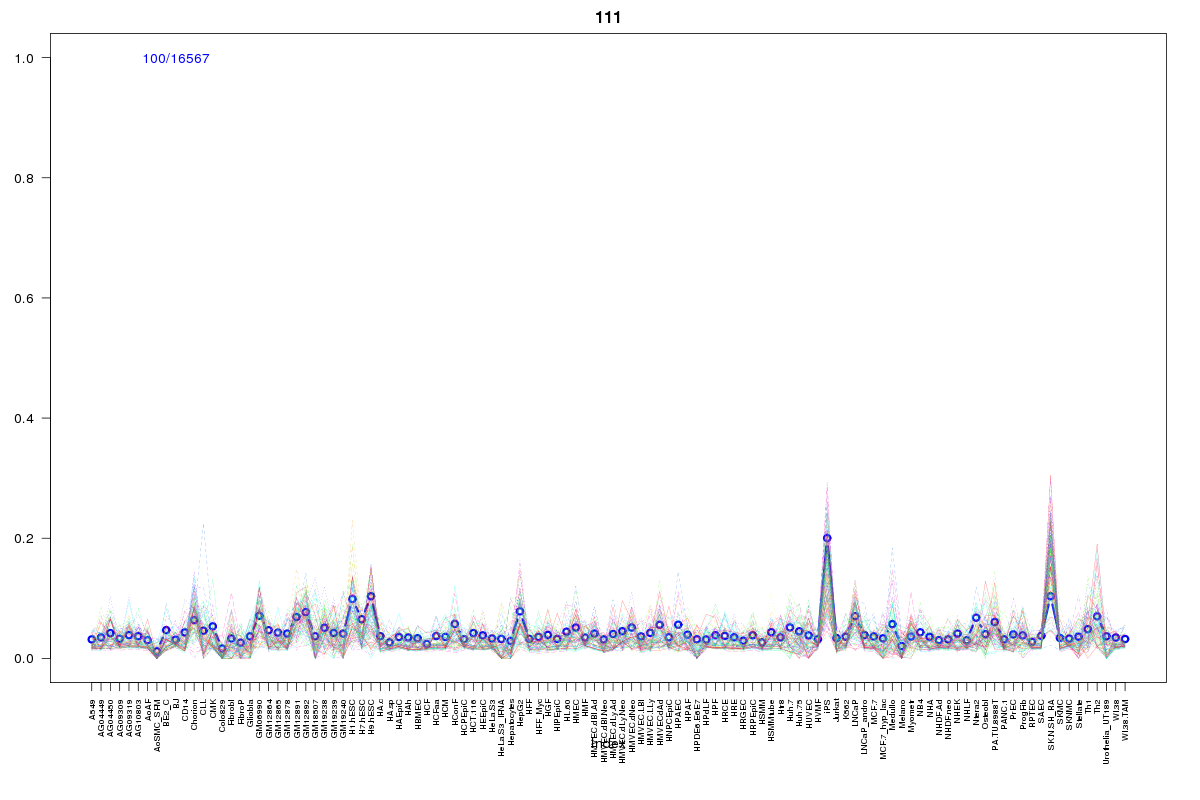 | 111 | 5 |
 | 570 | 4 |
 | 1008 | 3 |
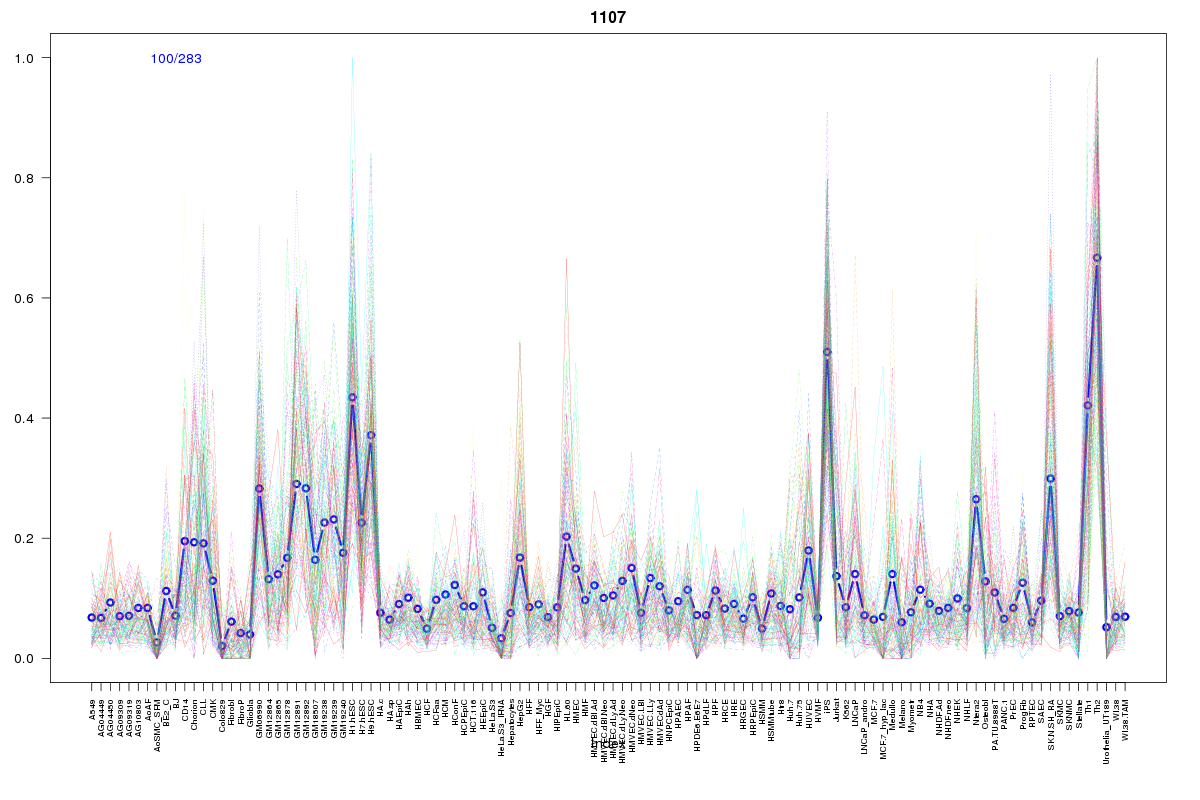 | 1107 | 2 |
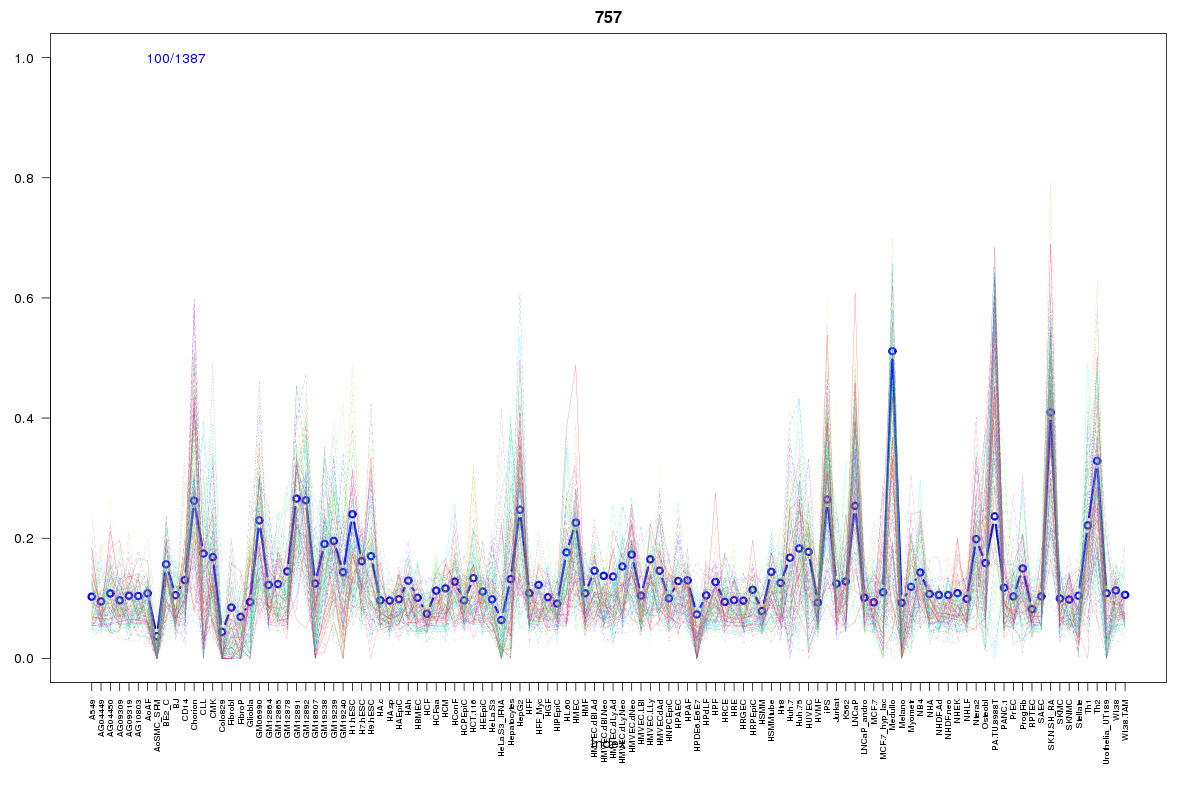 | 757 | 2 |
 | 568 | 2 |
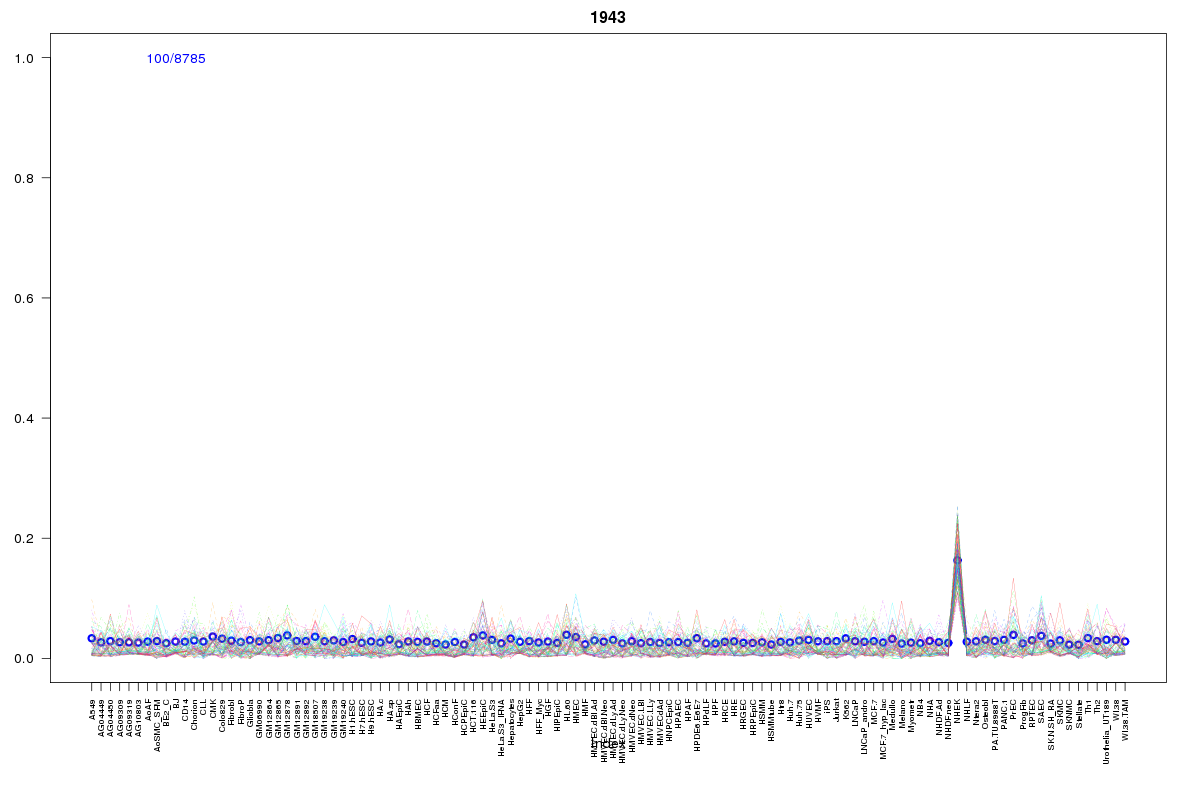 | 1943 | 1 |
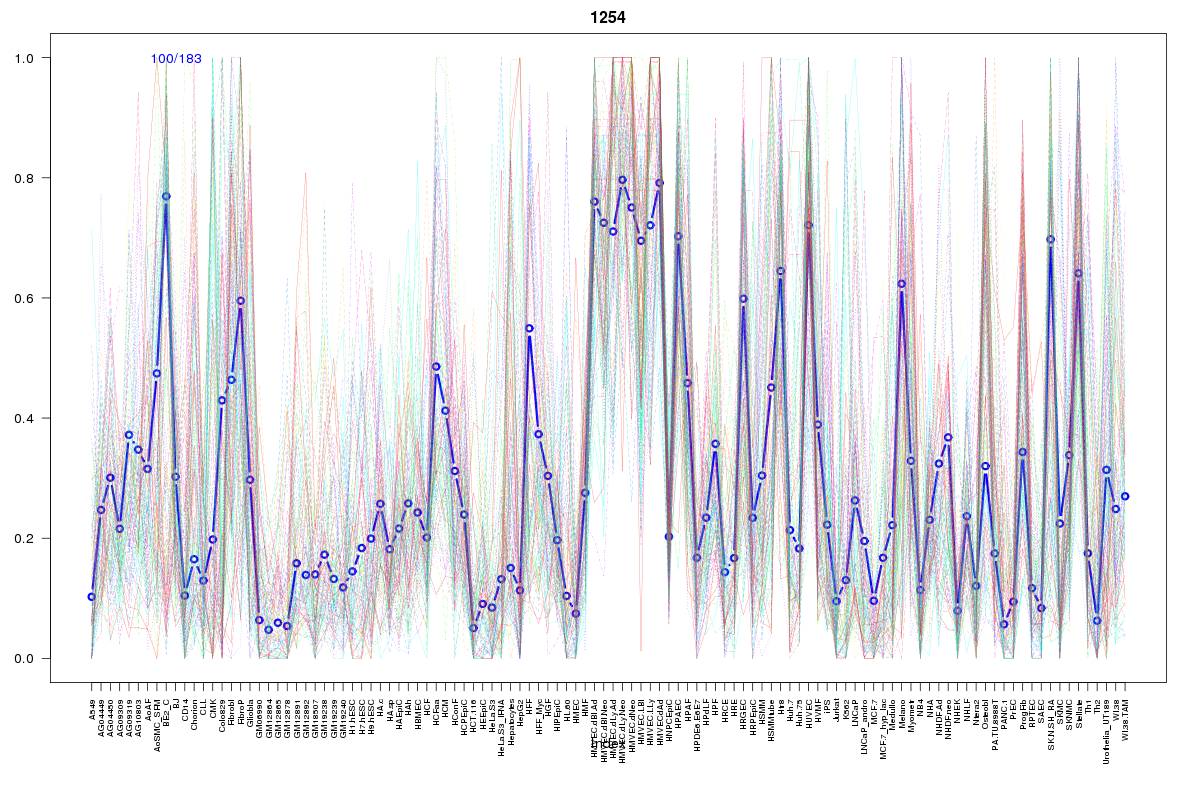 | 1254 | 1 |
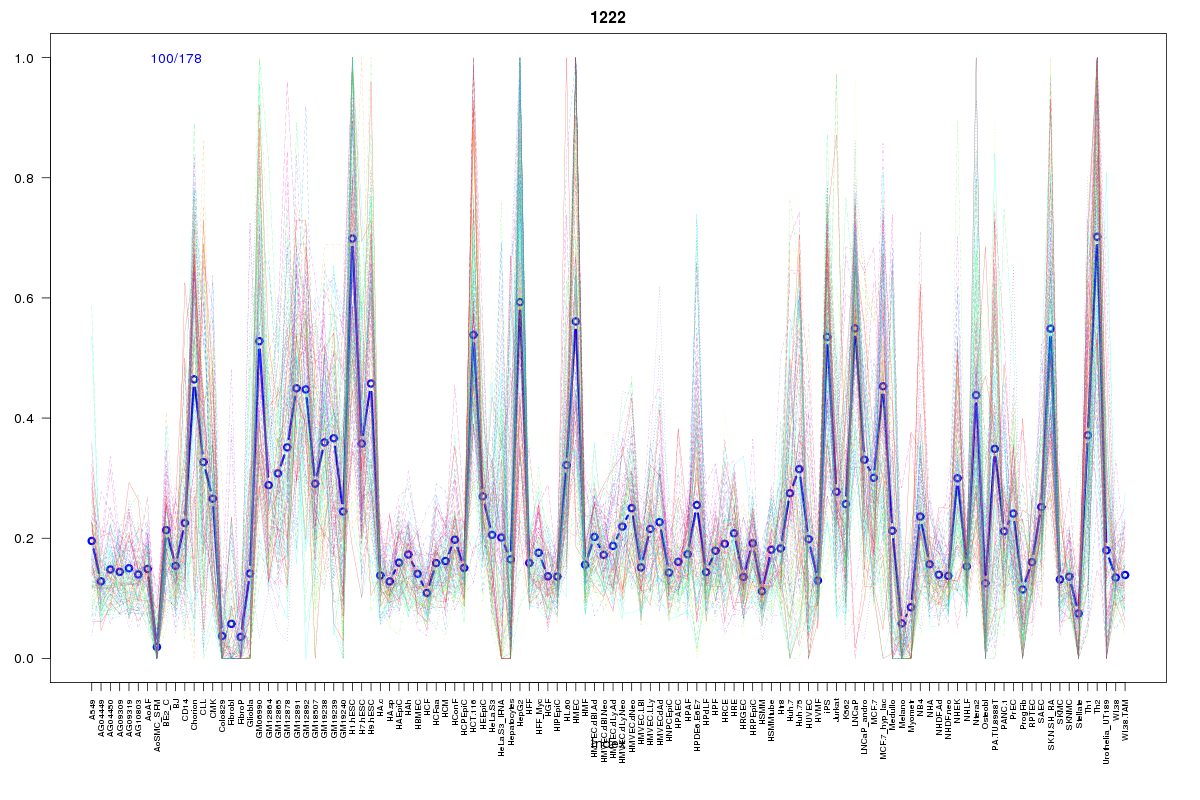 | 1222 | 1 |
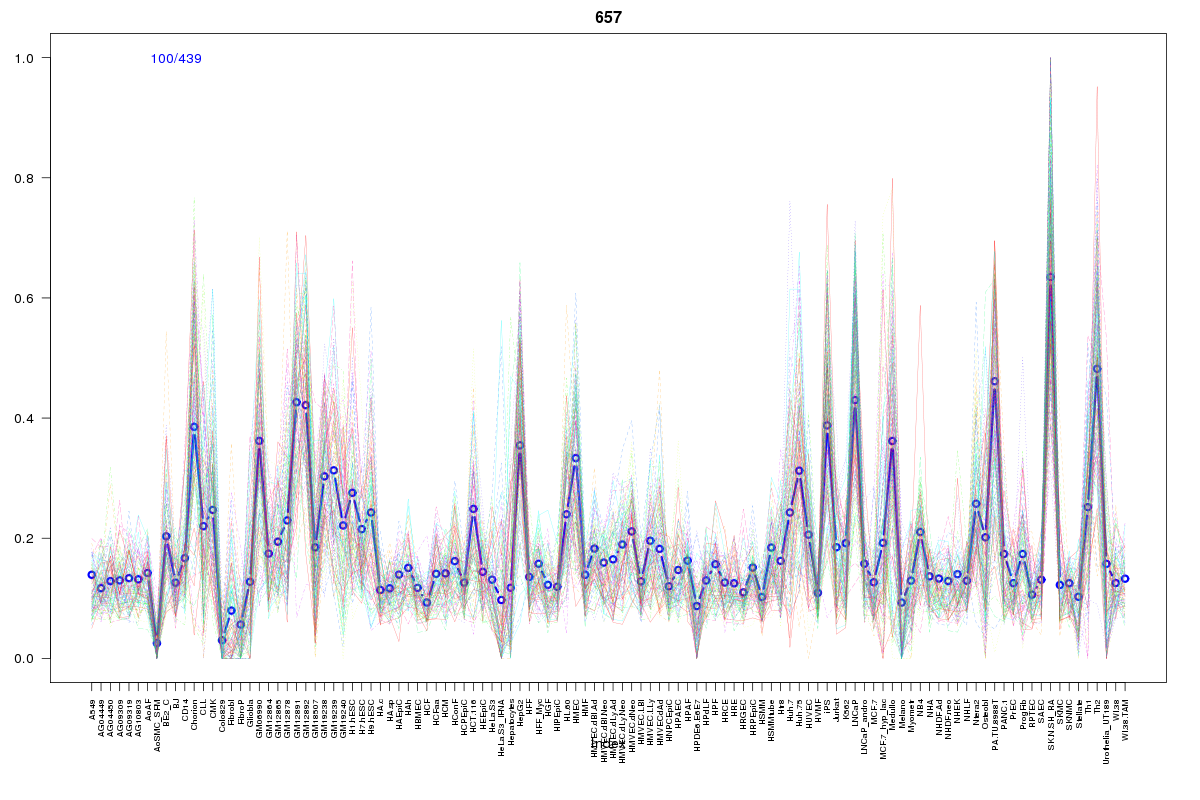 | 657 | 1 |
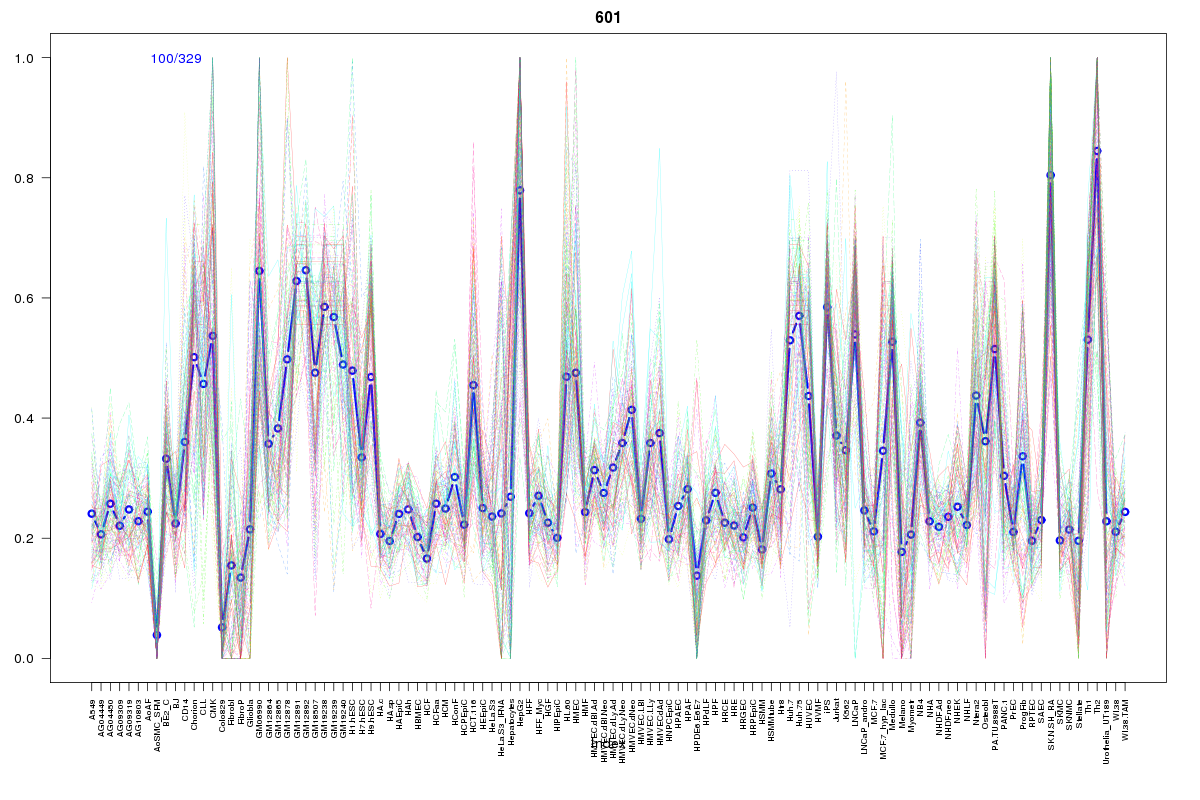 | 601 | 1 |
 | 2116 | 1 |
 | 2062 | 1 |
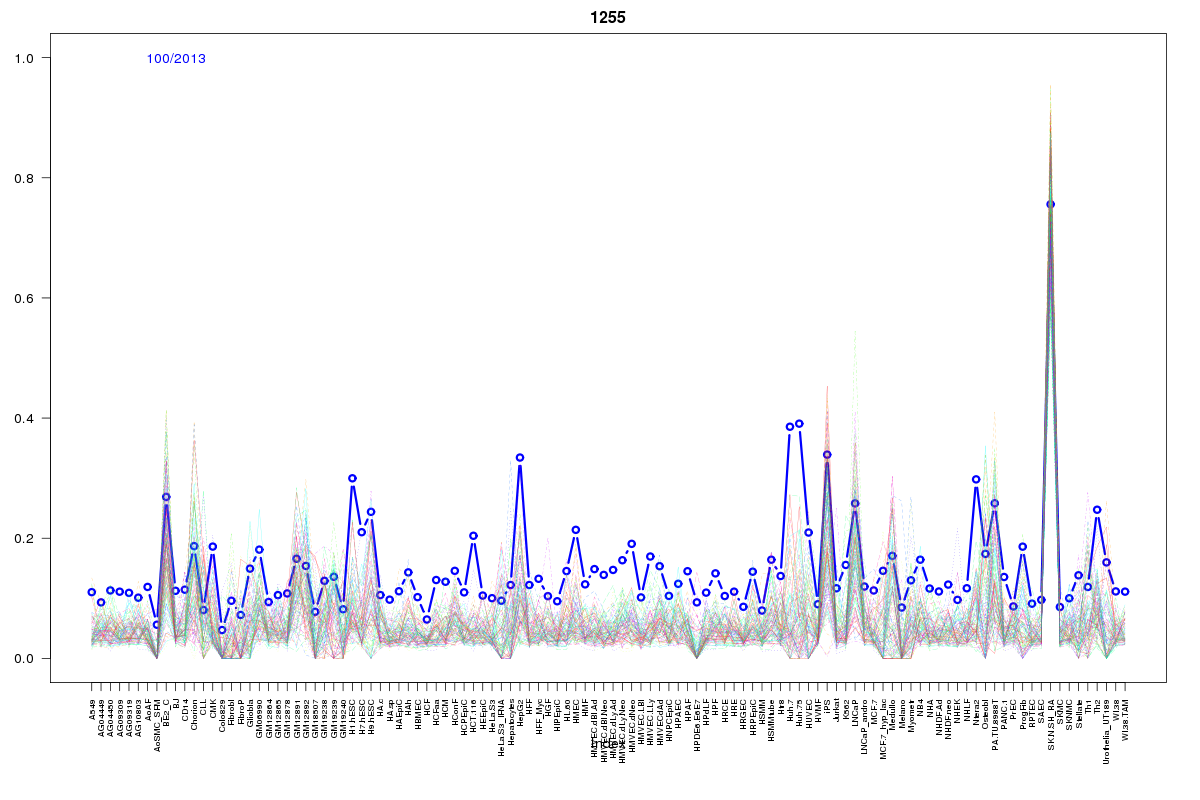 | 1255 | 1 |
 | 2218 | 1 |
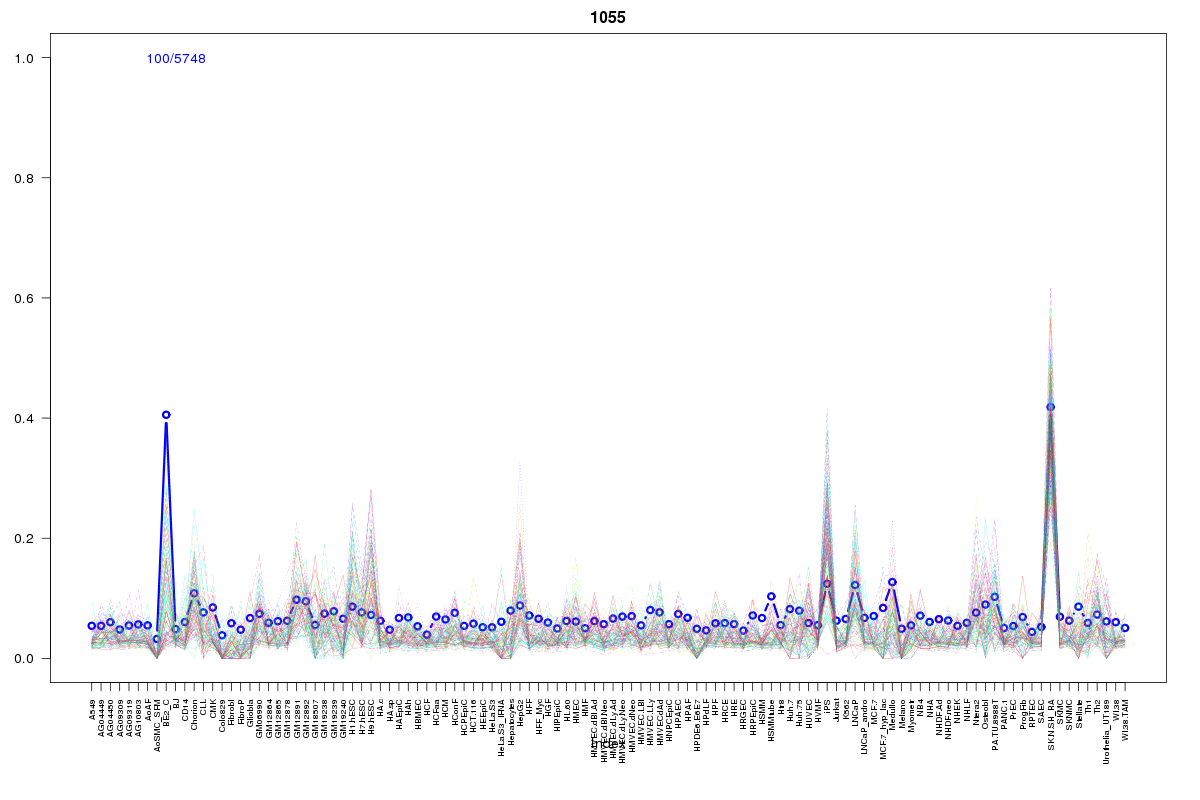 | 1055 | 1 |
 | 1078 | 1 |
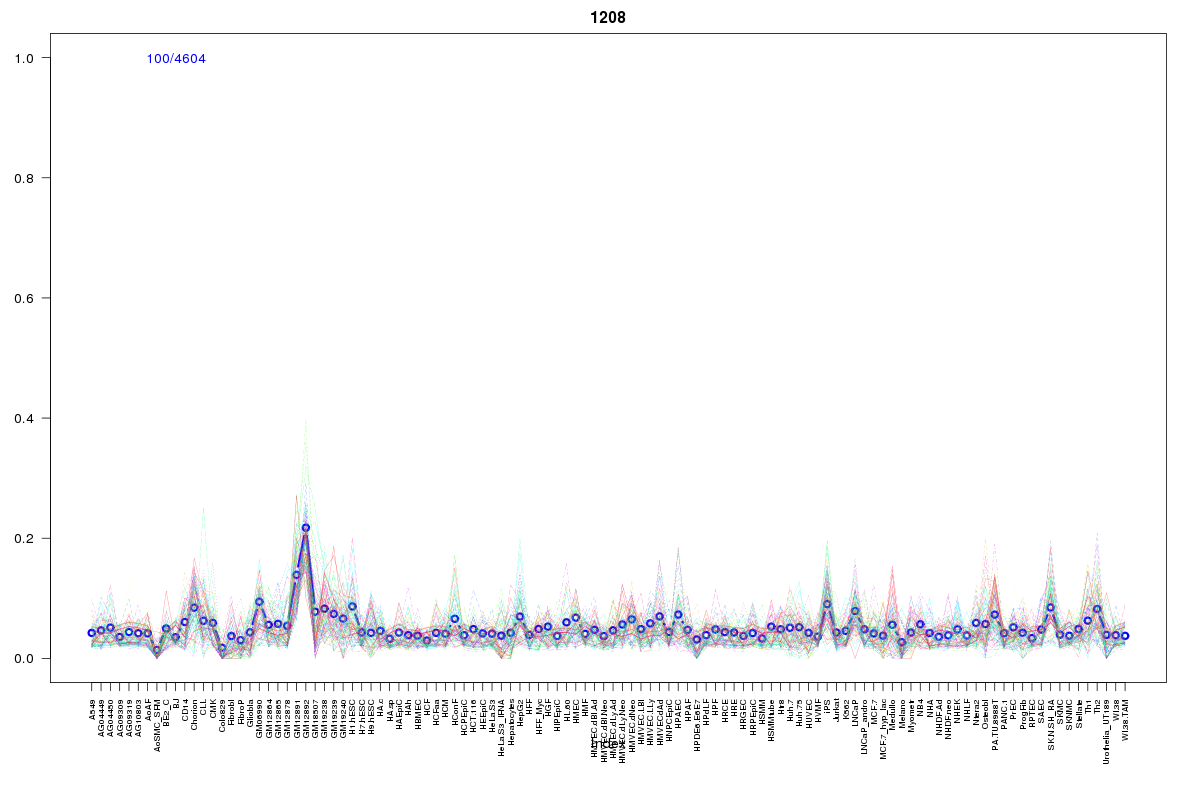 | 1208 | 1 |
Resources
BED file downloads
Connects to 30 DHS sitesTop 10 Correlated DHS Sites
p-values indiciate significant higher or lower correlation| Location | Cluster | P-value |
|---|---|---|
| chr11:2404260-2404410 | 1254 | 0.006 |
| chr11:2381345-2381495 | 1943 | 0.007 |
| chr11:2473505-2473655 | 1008 | 0.024 |
| chr11:2441325-2441475 | 757 | 0.024 |
| chr11:2471965-2472115 | 570 | 0.024 |
| chr11:2382965-2383115 | 568 | 0.024 |
| chr11:2340040-2340190 | 568 | 0.024 |
| chr11:2488640-2488790 | 2218 | 0.024 |
| chr11:2504800-2504950 | 1055 | 0.024 |
| chr11:2337145-2337295 | 570 | 0.024 |
| chr11:2485605-2485755 | 111 | 0.023 |
External Databases
UCSCEnsembl (ENSG00000070985)