Gene: MYBPC3
chr11: 47352956-47374253Expression Profile
(log scale)
Graphical Connections
Distribution of linked clusters:
You may find it interesting if many of the connected DHS sites belong to the same cluster.| Cluster Profile | Cluster ID | Number of DHS sites in this cluster |
|---|---|---|
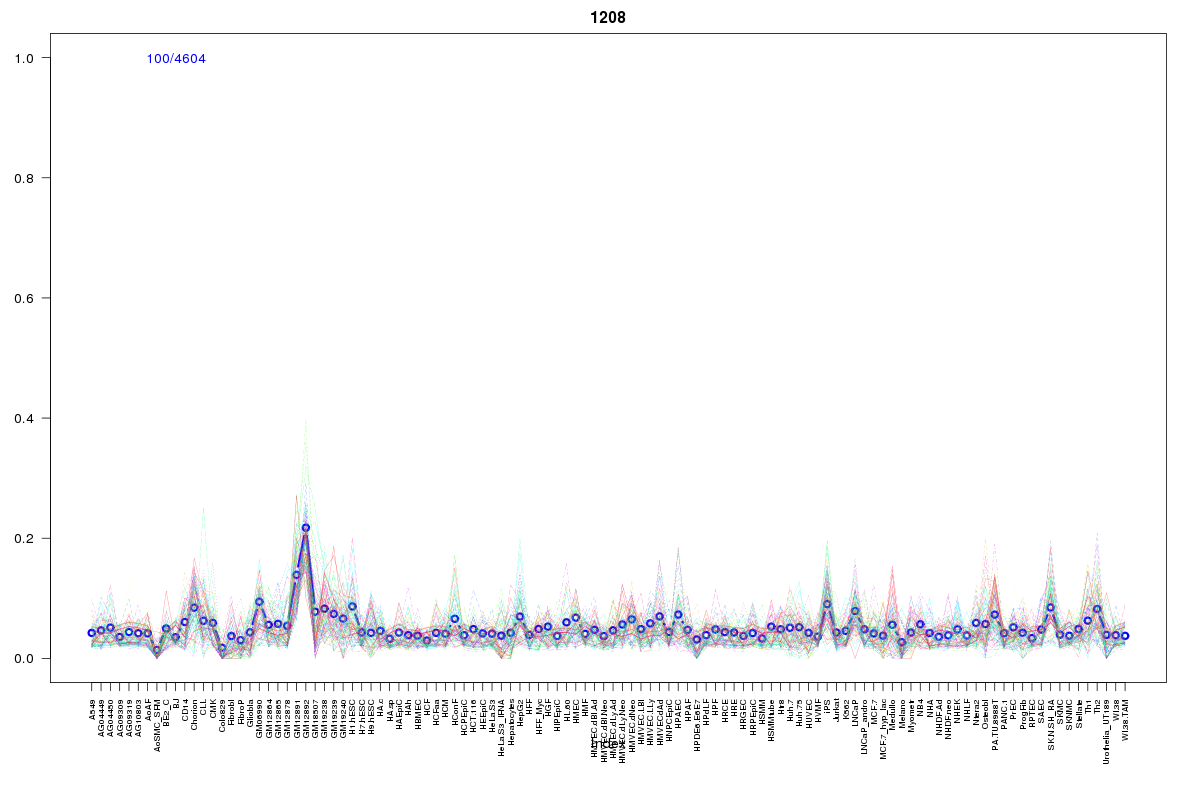 | 1208 | 1 |
 | 569 | 1 |
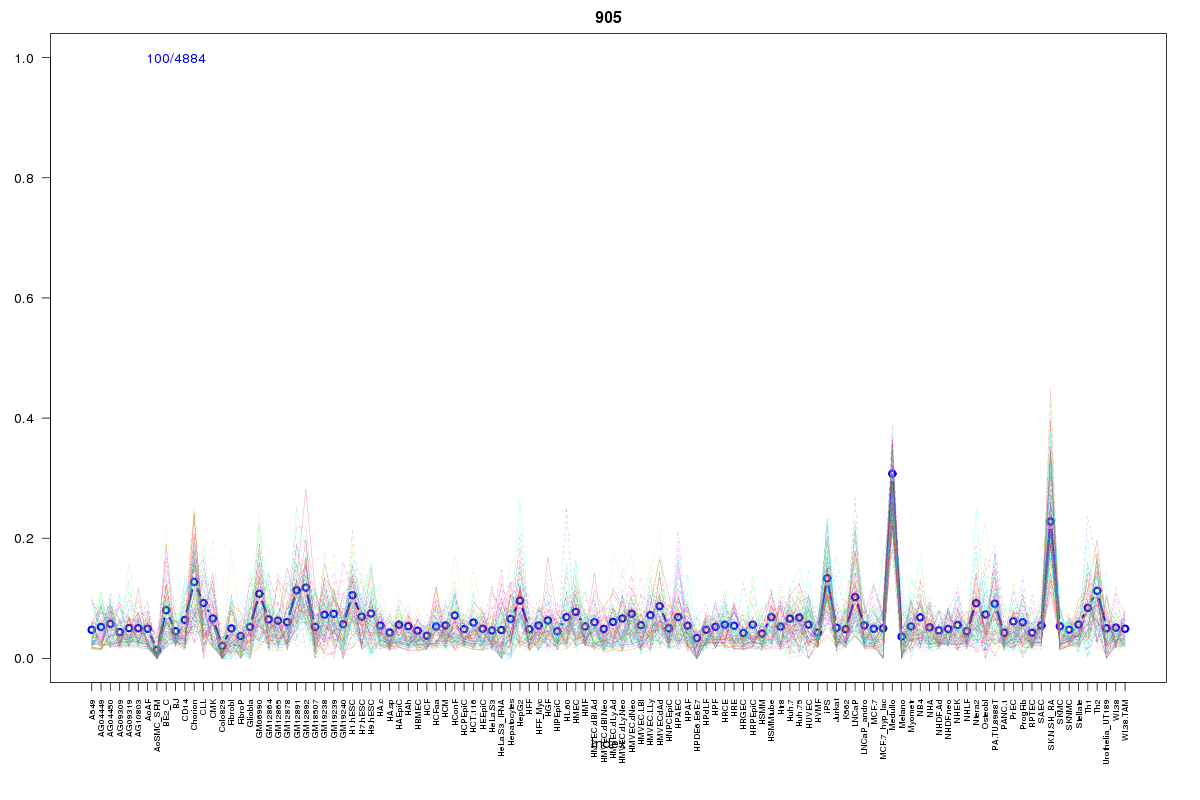 | 905 | 1 |
 | 2279 | 1 |
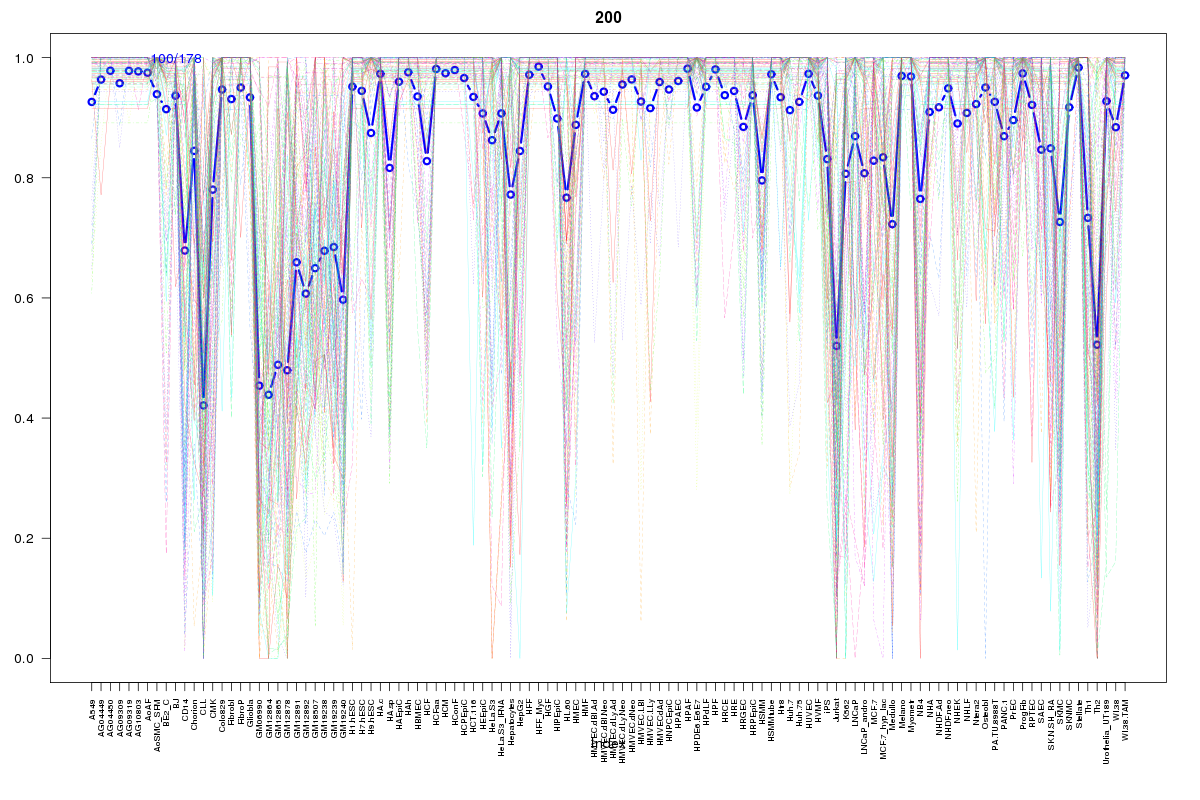 | 200 | 1 |
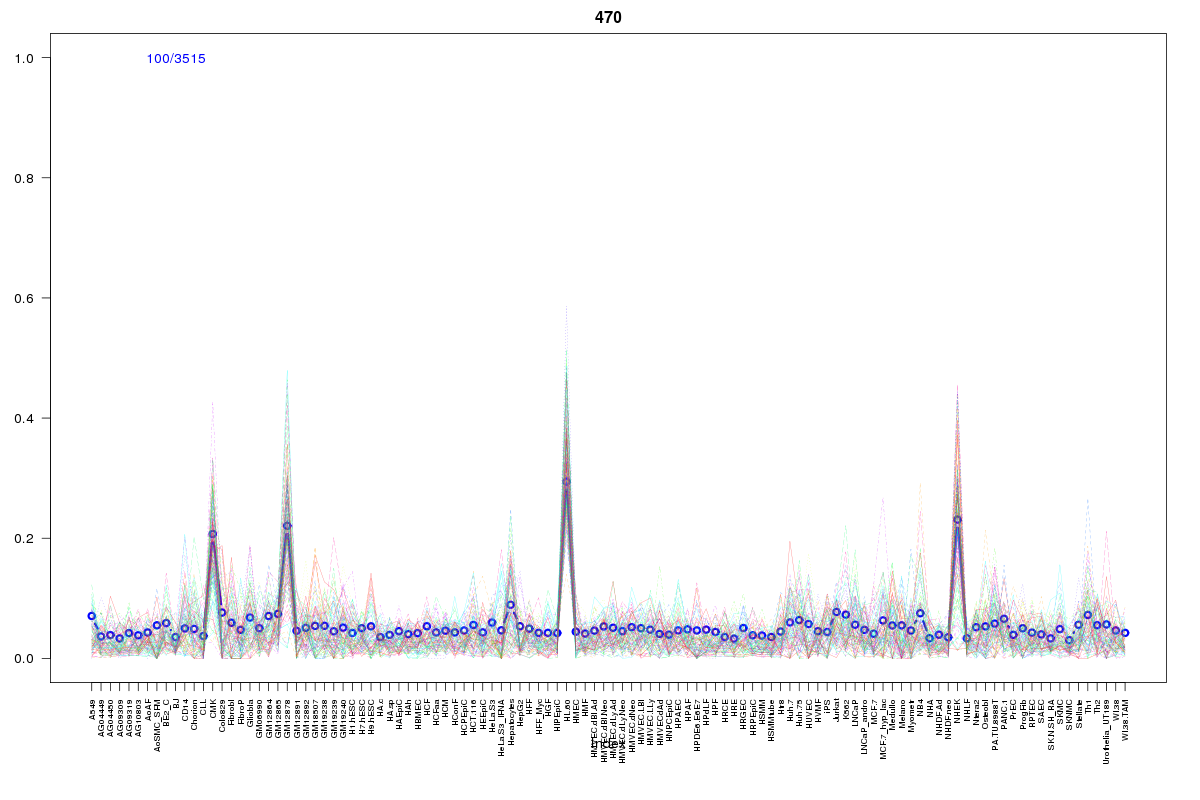 | 470 | 1 |
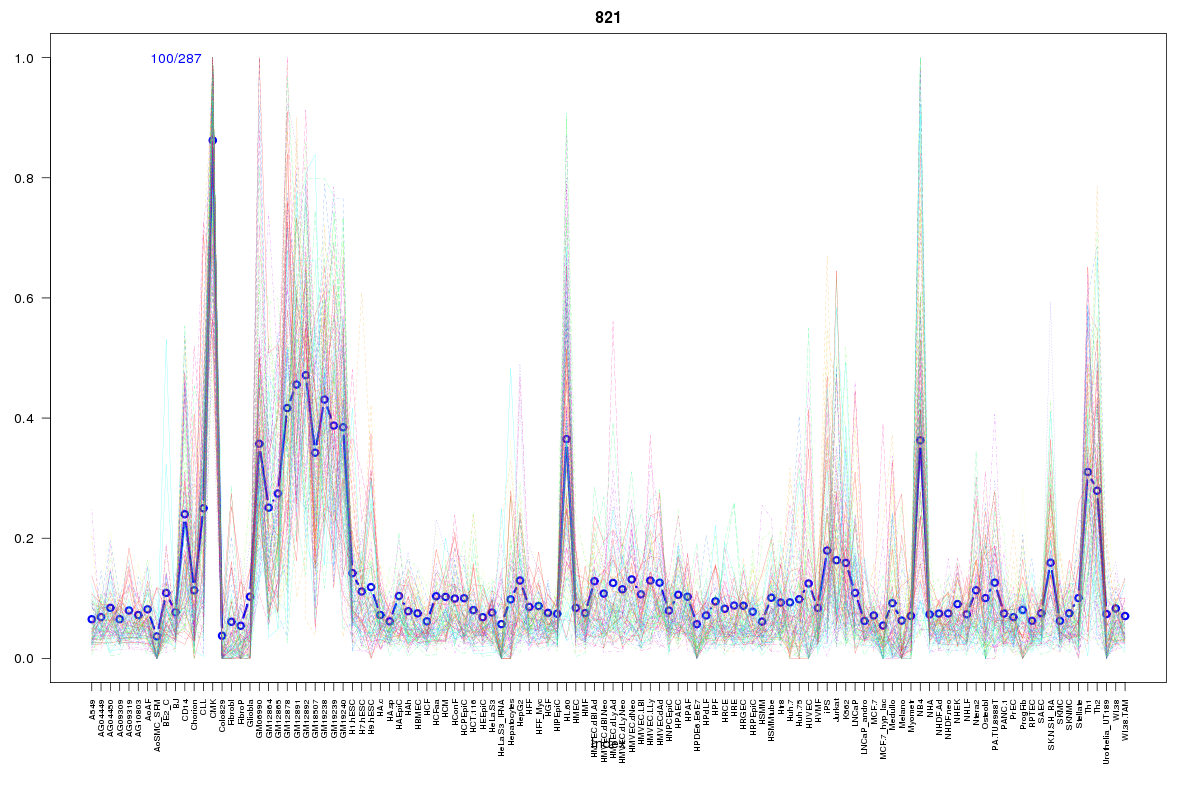 | 821 | 1 |
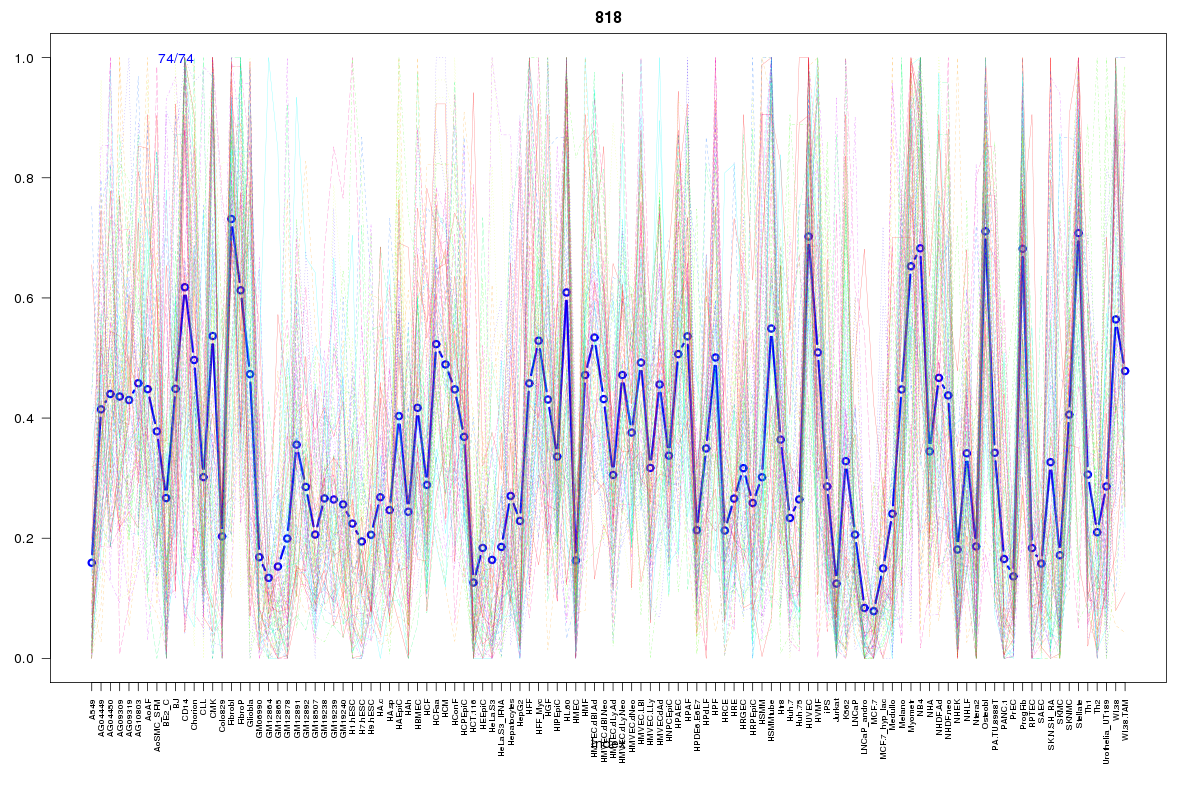 | 818 | 1 |
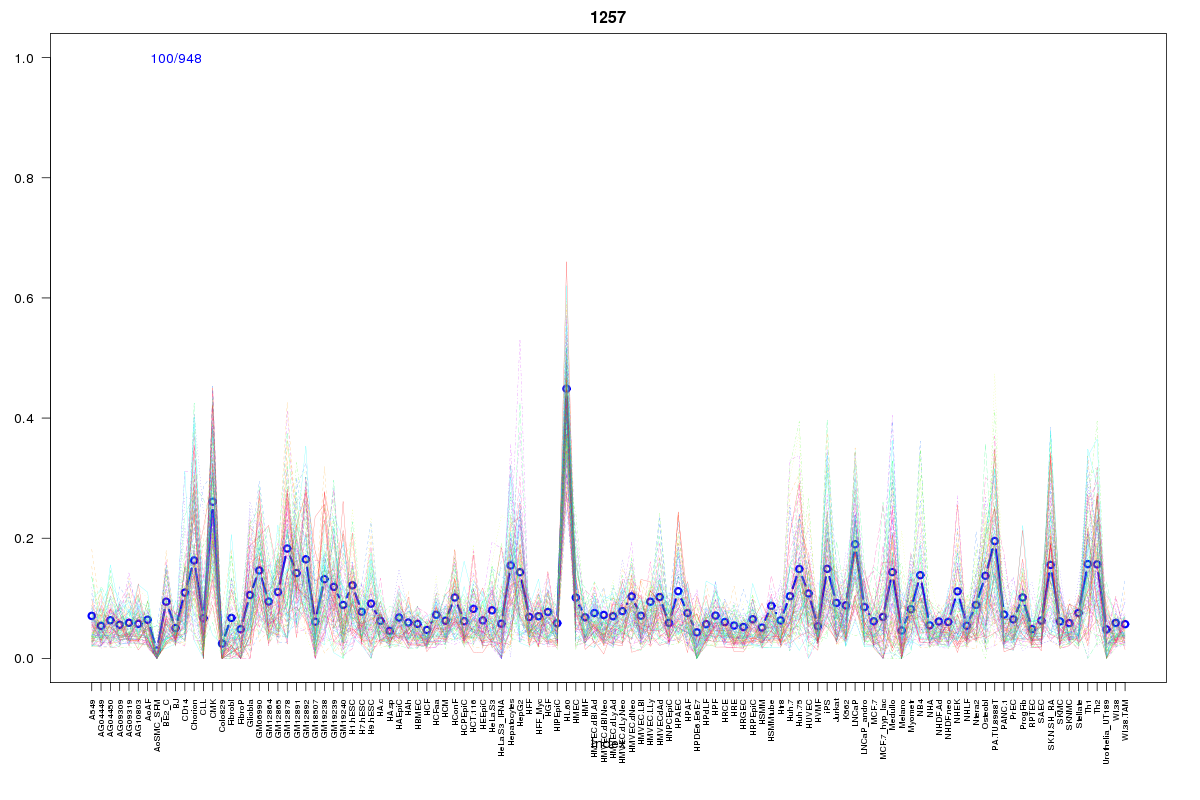 | 1257 | 1 |
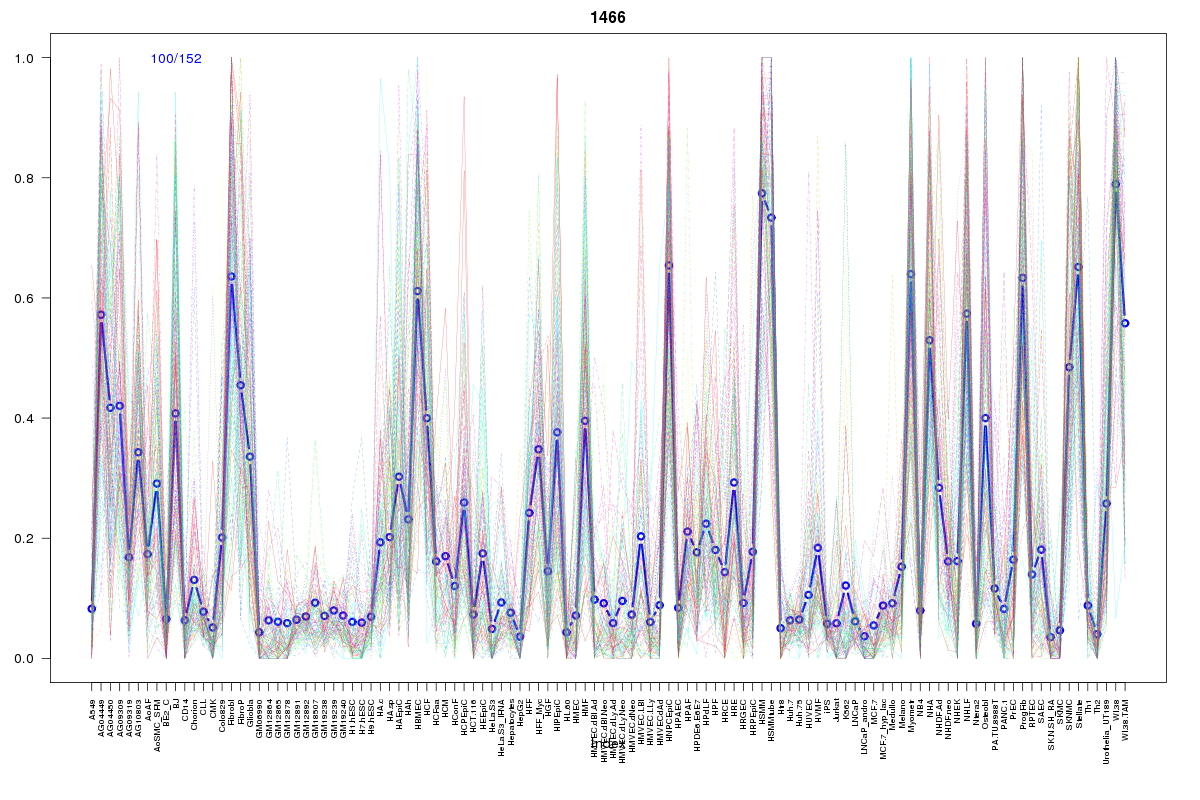 | 1466 | 1 |
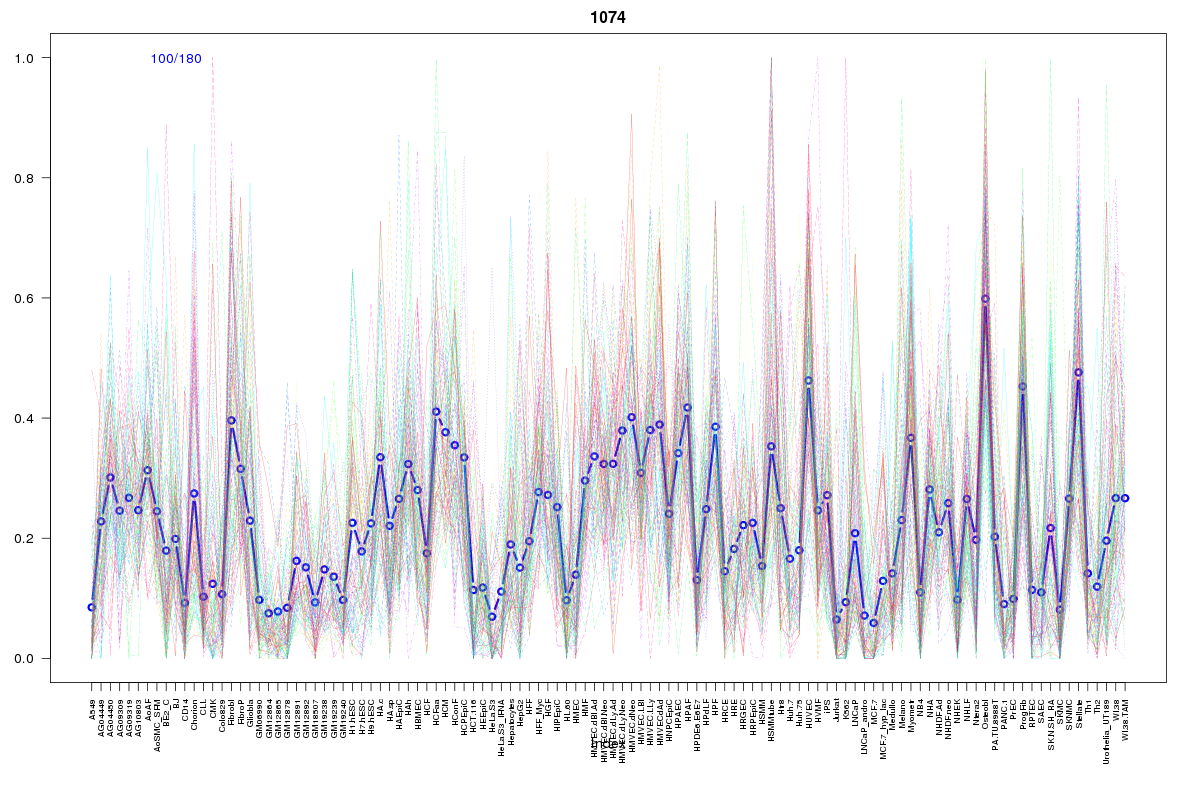 | 1074 | 1 |
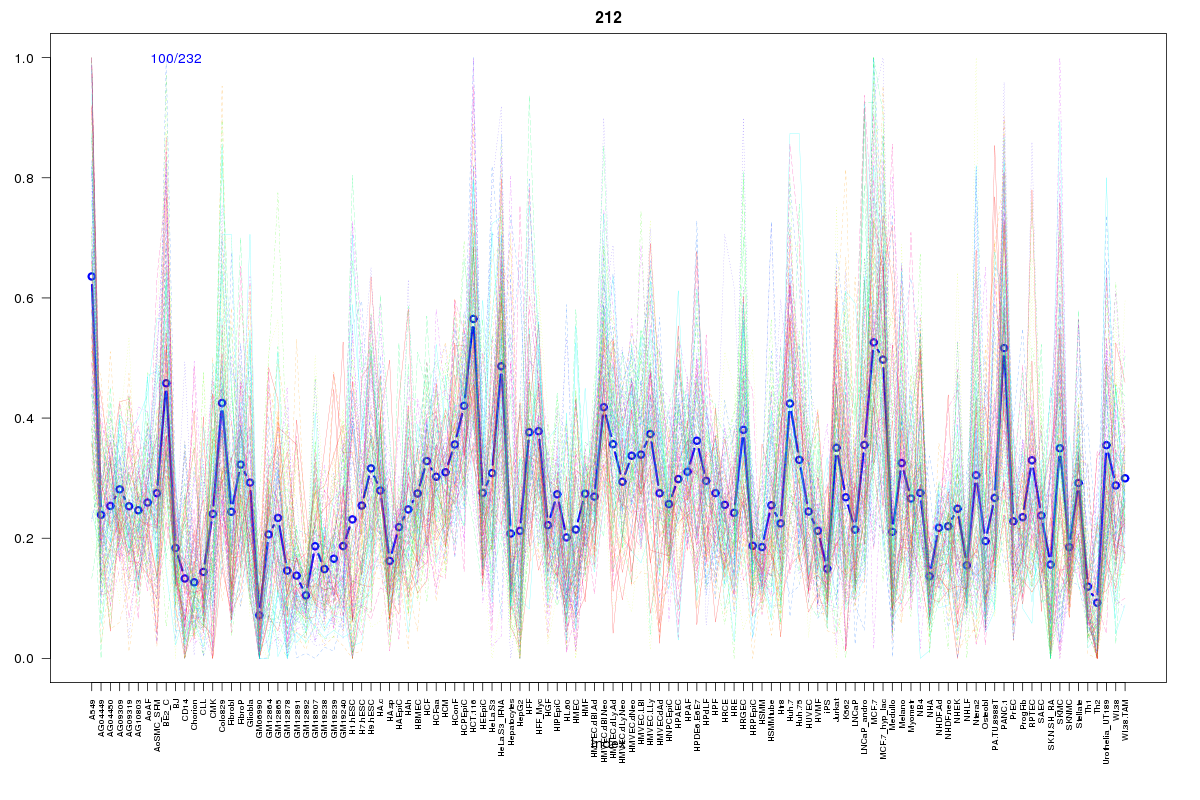 | 212 | 1 |
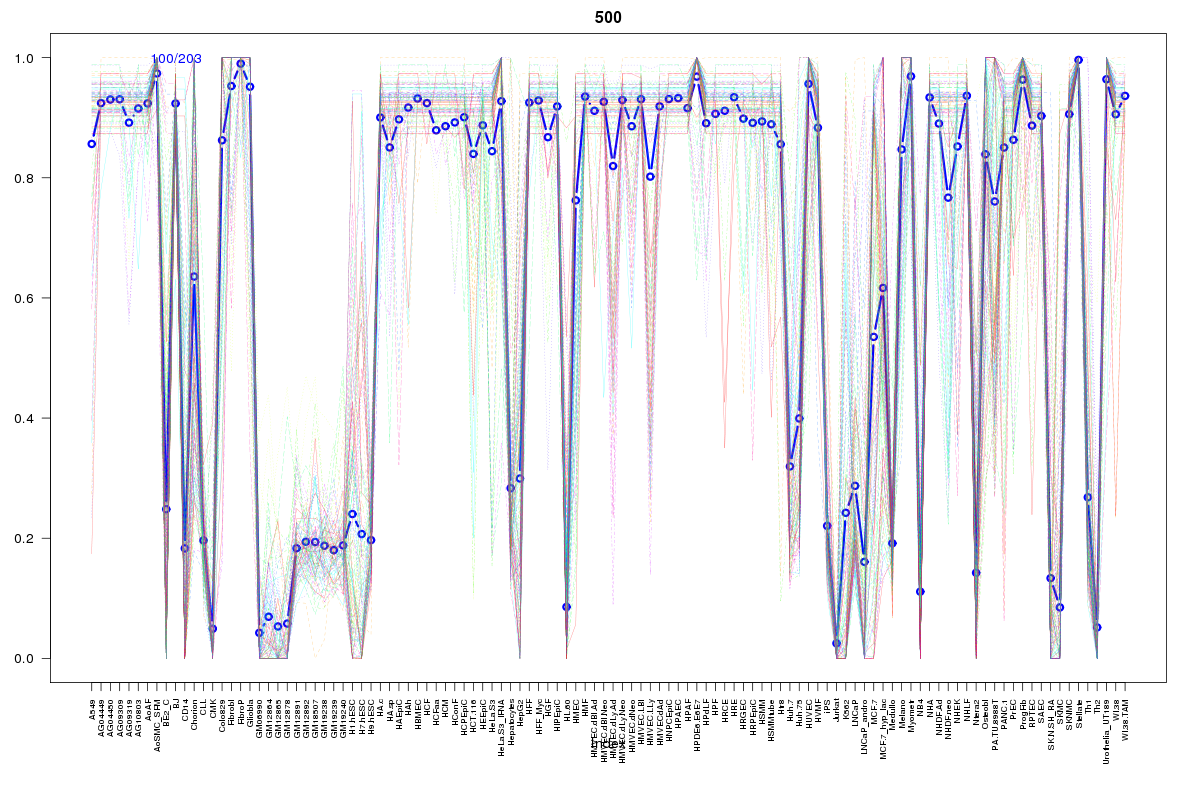 | 500 | 1 |
 | 615 | 1 |
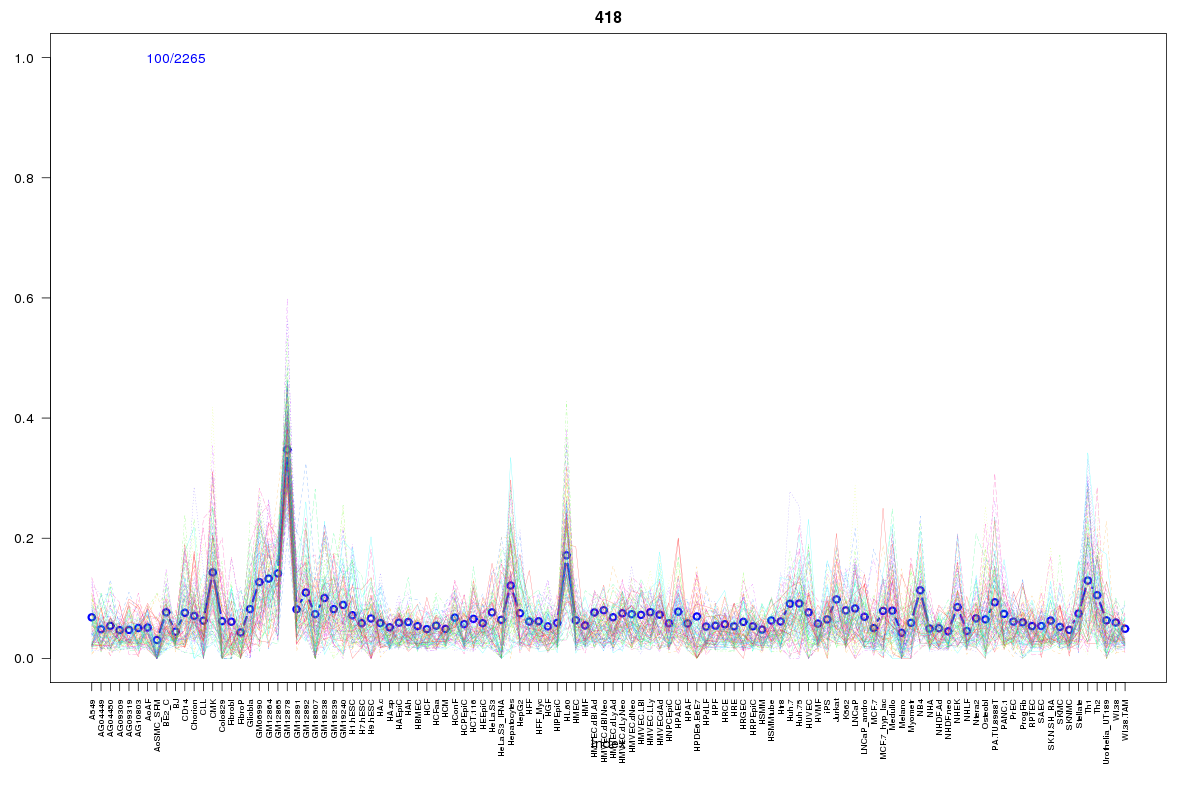 | 418 | 1 |
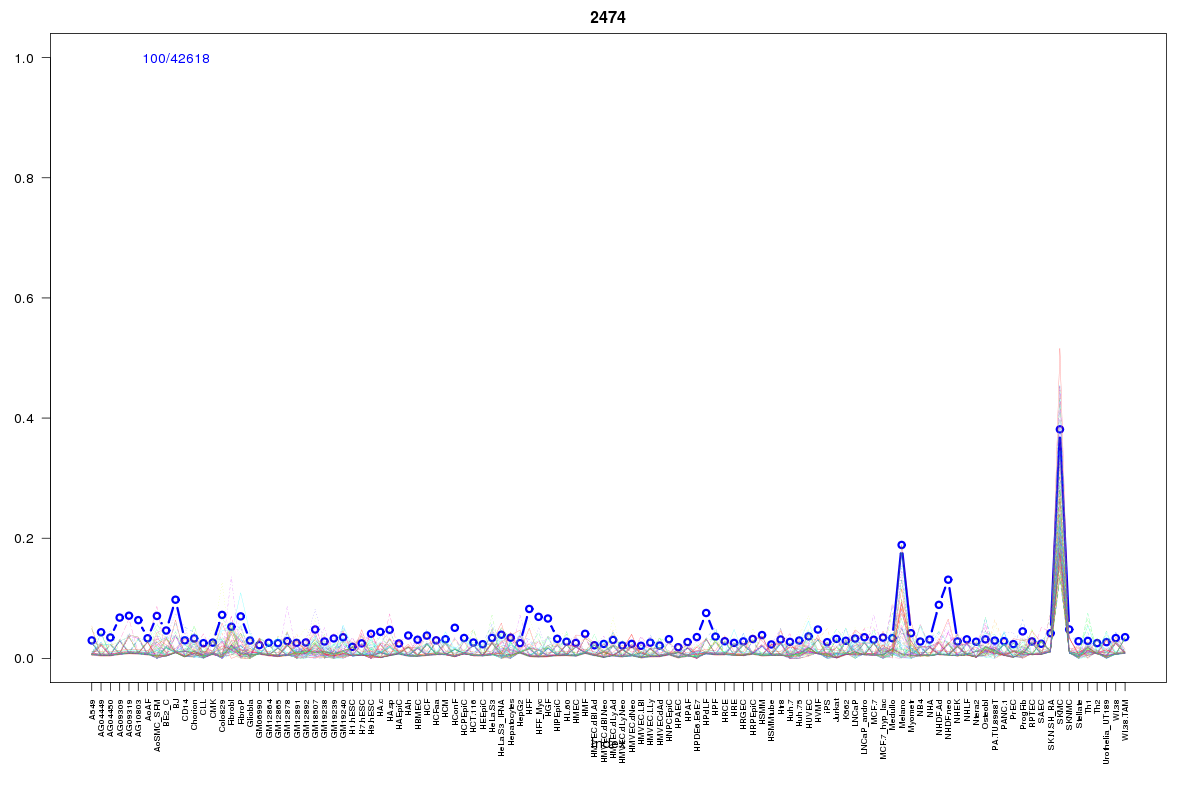 | 2474 | 1 |
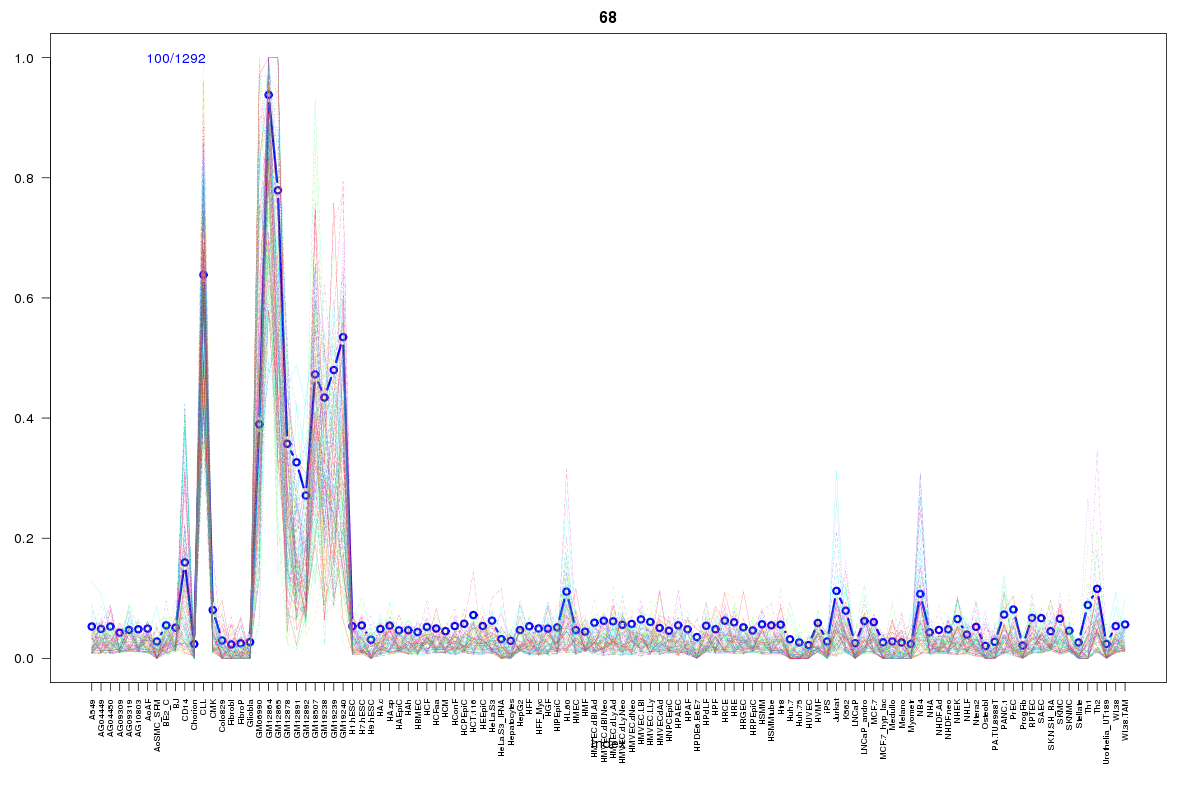 | 68 | 1 |
 | 1008 | 1 |
Resources
BED file downloads
Connects to 18 DHS sitesTop 10 Correlated DHS Sites
p-values indiciate significant higher or lower correlation| Location | Cluster | P-value |
|---|---|---|
| chr11:47267660-47267810 | 615 | 0.005 |
| chr11:47350120-47350270 | 68 | 0.017 |
| chr11:47339100-47339250 | 2474 | 0.021 |
| chr11:47368245-47368395 | 569 | 0.021 |
| chr11:47437525-47437675 | 1074 | 0.022 |
| chr11:47446500-47446650 | 418 | 0.021 |
| chr11:47255600-47255750 | 212 | 0.013 |
| chr11:47372045-47372195 | 905 | 0.012 |
| chr11:47362585-47362735 | 1008 | 0.01 |
| chr11:47373365-47373515 | 2279 | 0.006 |
| chr11:47377765-47377915 | 470 | 0.006 |
External Databases
UCSCEnsembl (ENSG00000134571)