Gene: MYOM3
chr1: 24382524-24393069Expression Profile
(log scale)
Graphical Connections
Distribution of linked clusters:
You may find it interesting if many of the connected DHS sites belong to the same cluster.| Cluster Profile | Cluster ID | Number of DHS sites in this cluster |
|---|---|---|
 | 1355 | 5 |
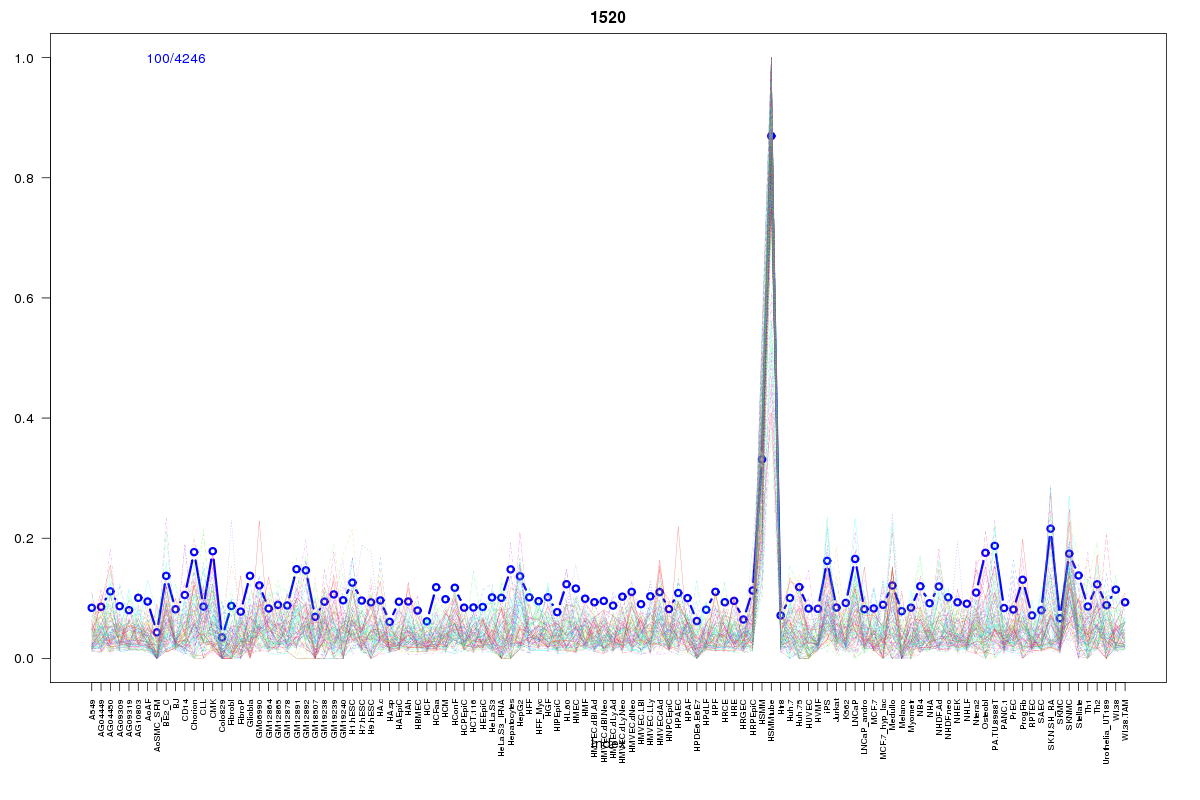 | 1520 | 5 |
 | 1721 | 4 |
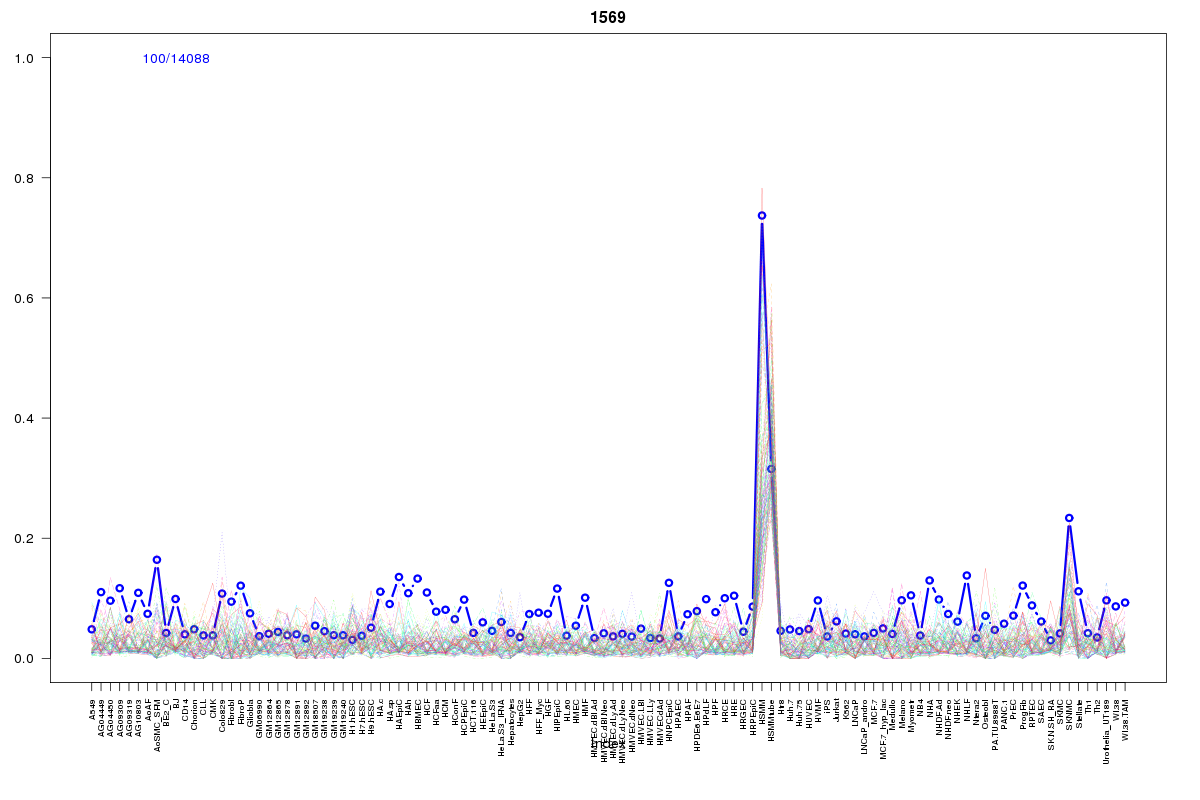 | 1569 | 3 |
 | 862 | 3 |
 | 2055 | 2 |
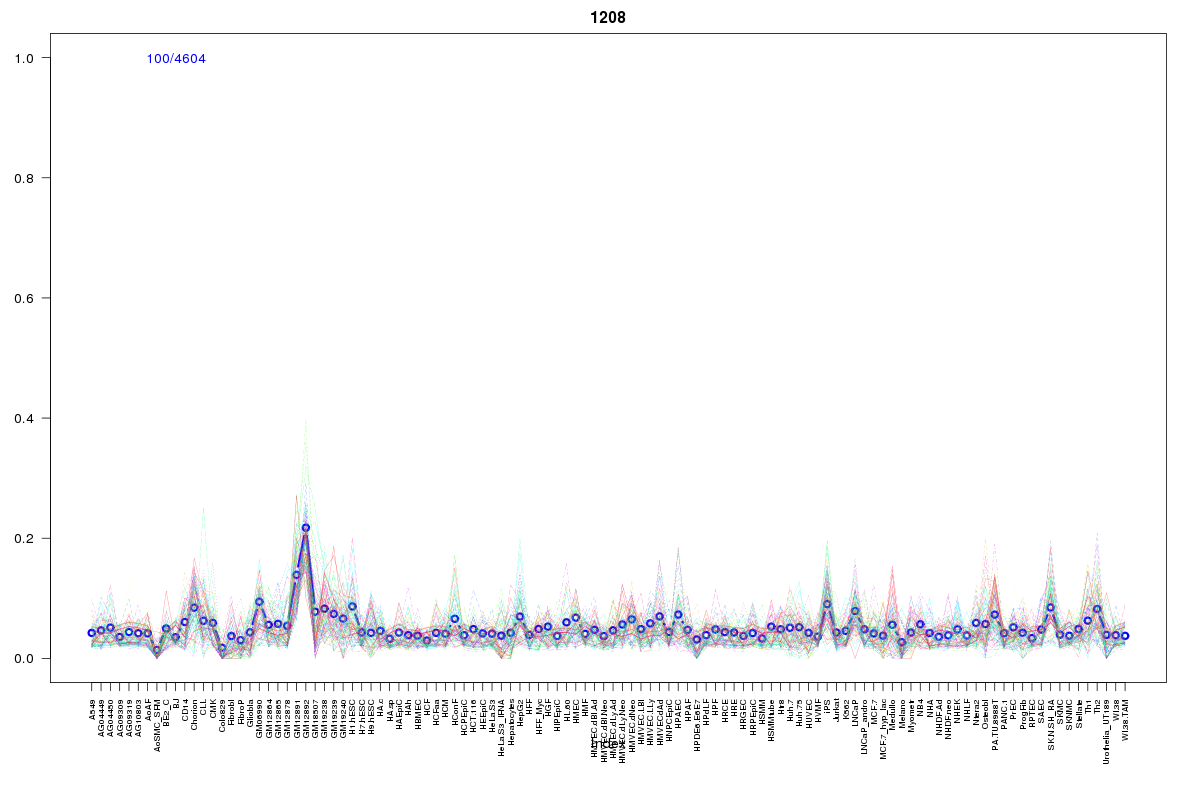 | 1208 | 1 |
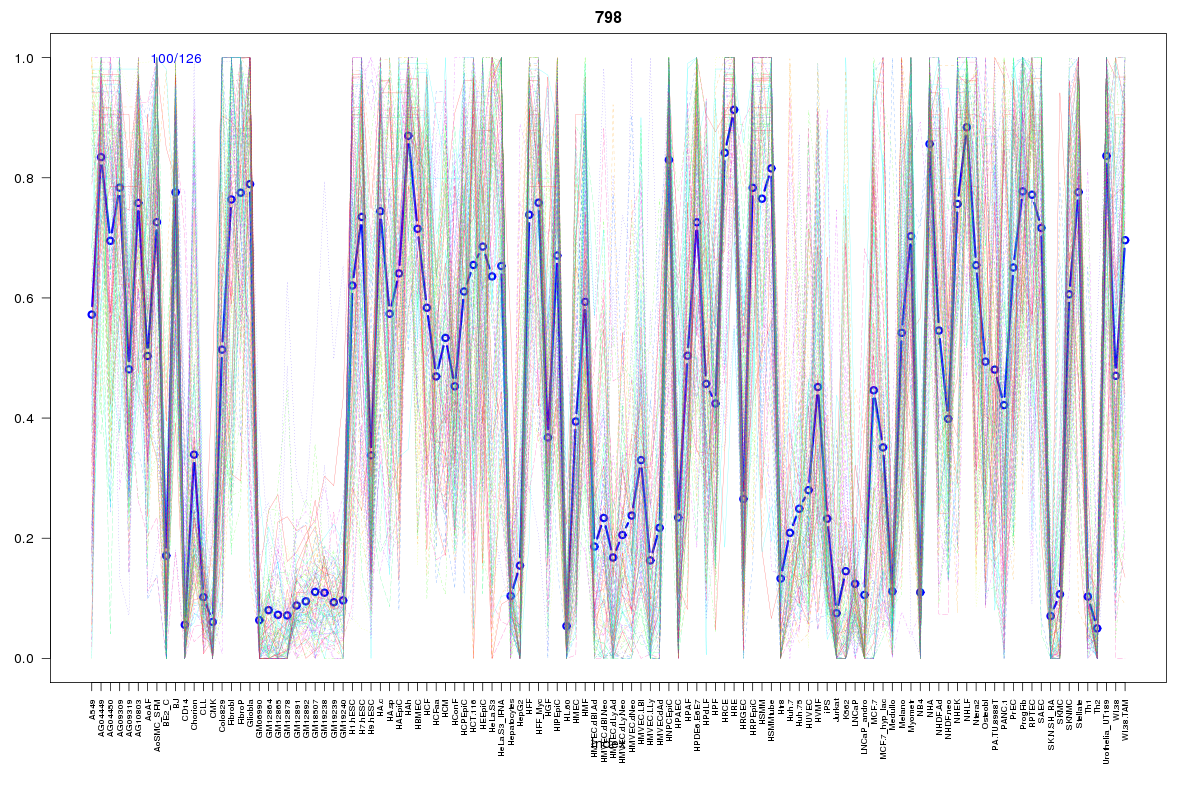 | 798 | 1 |
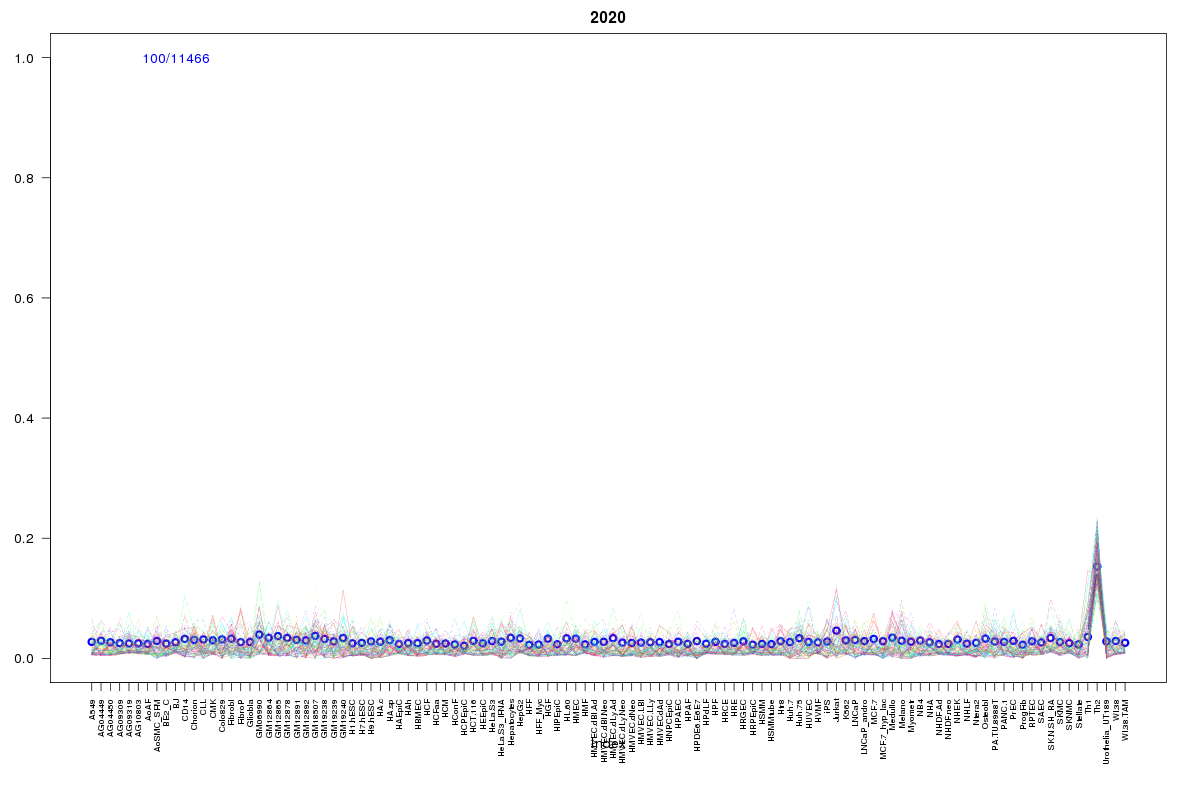 | 2020 | 1 |
 | 1970 | 1 |
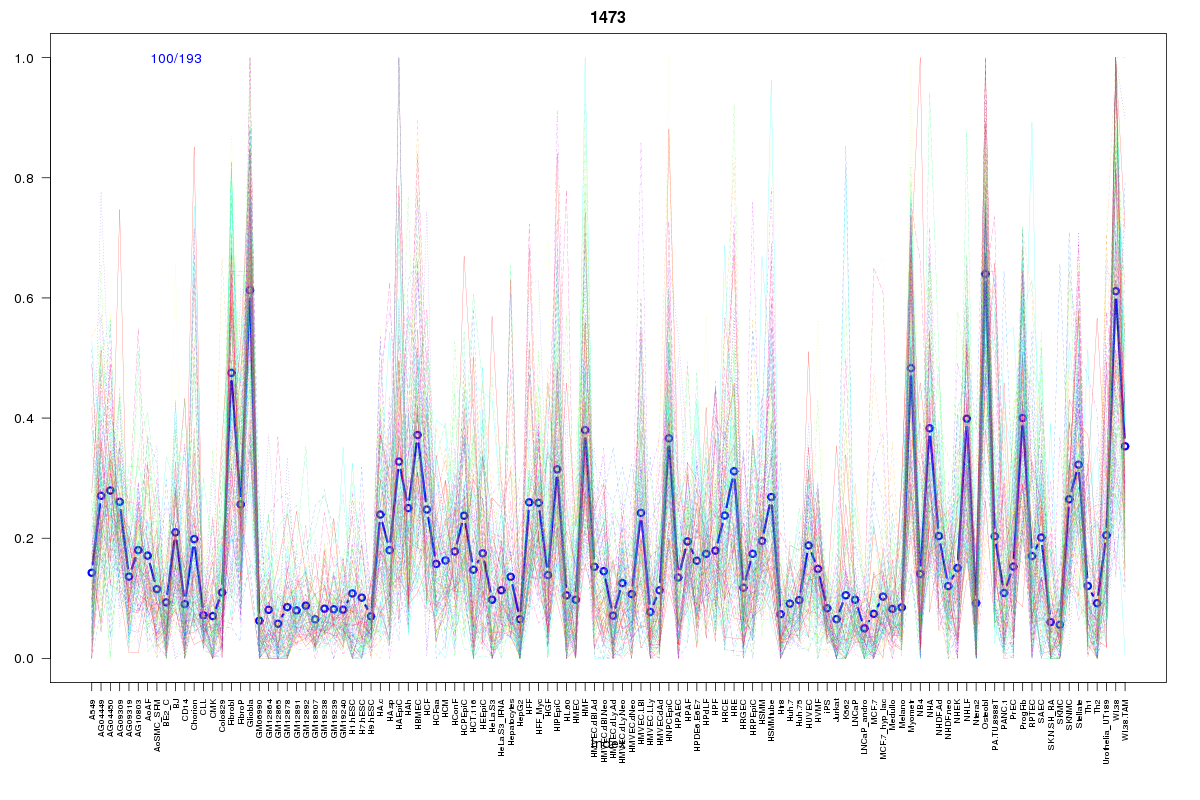 | 1473 | 1 |
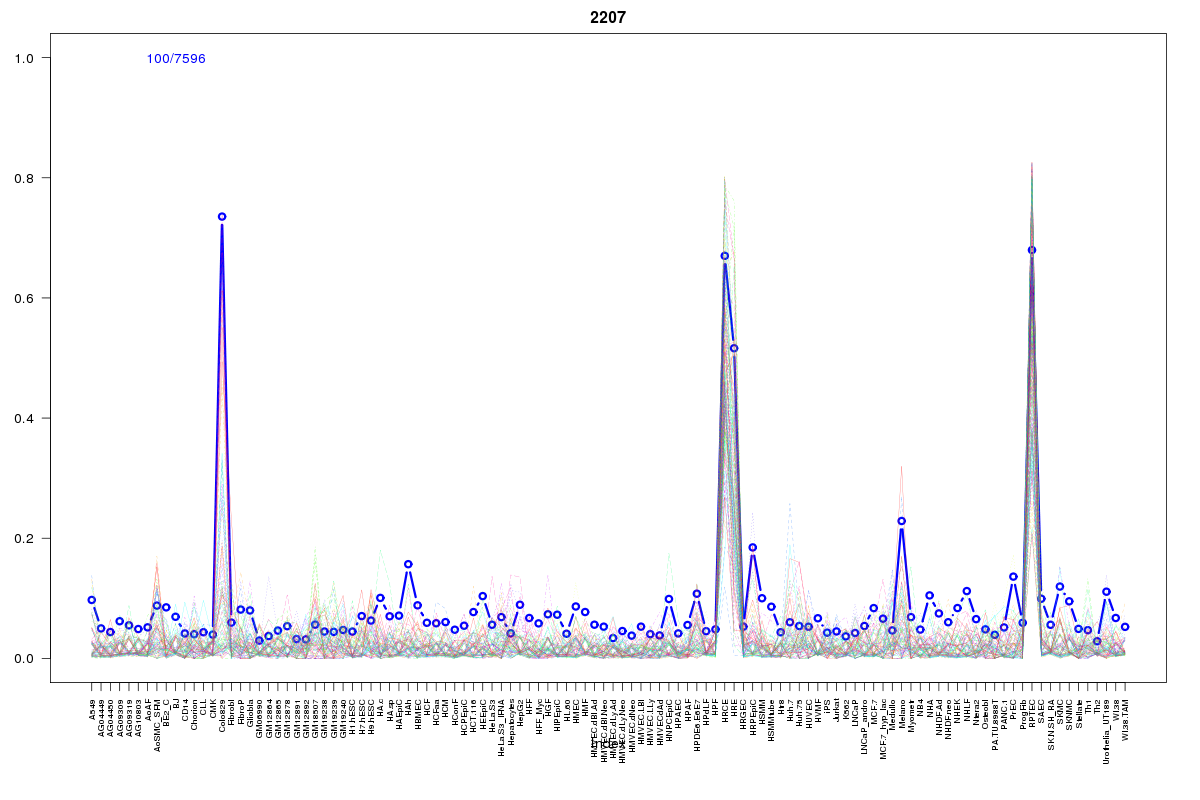 | 2207 | 1 |
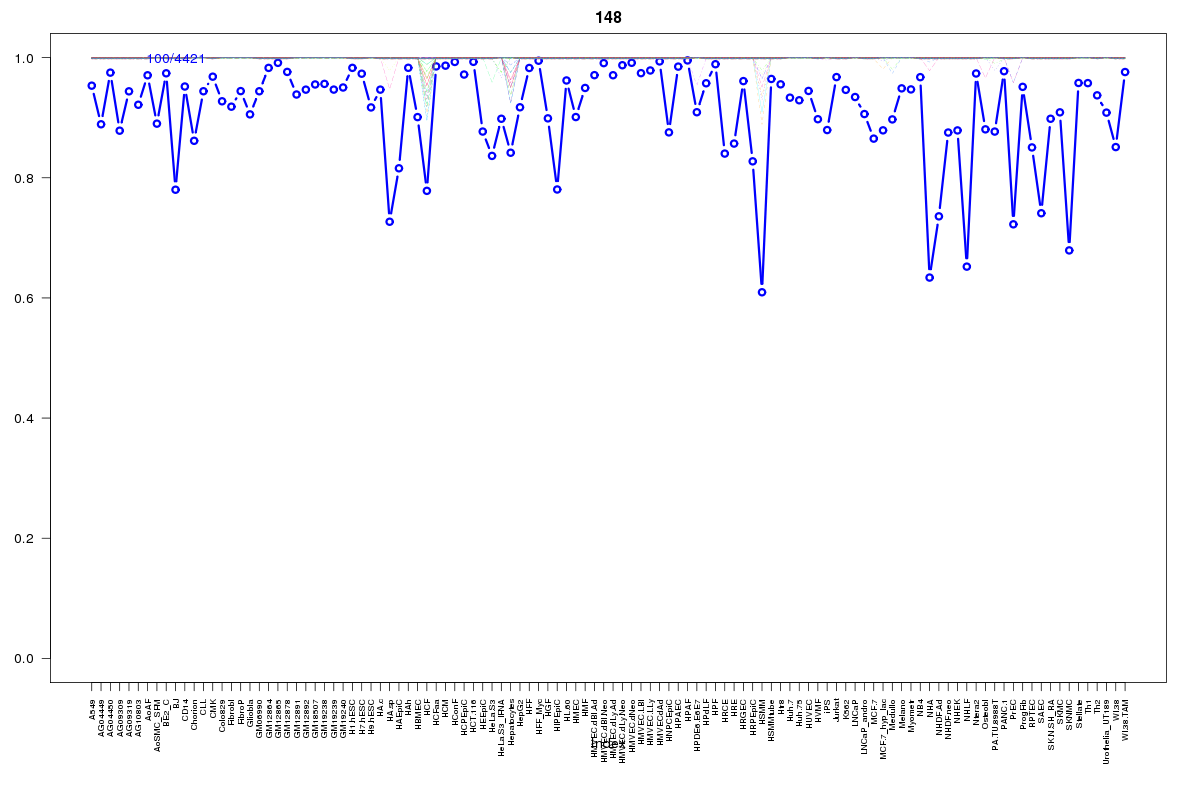 | 148 | 1 |
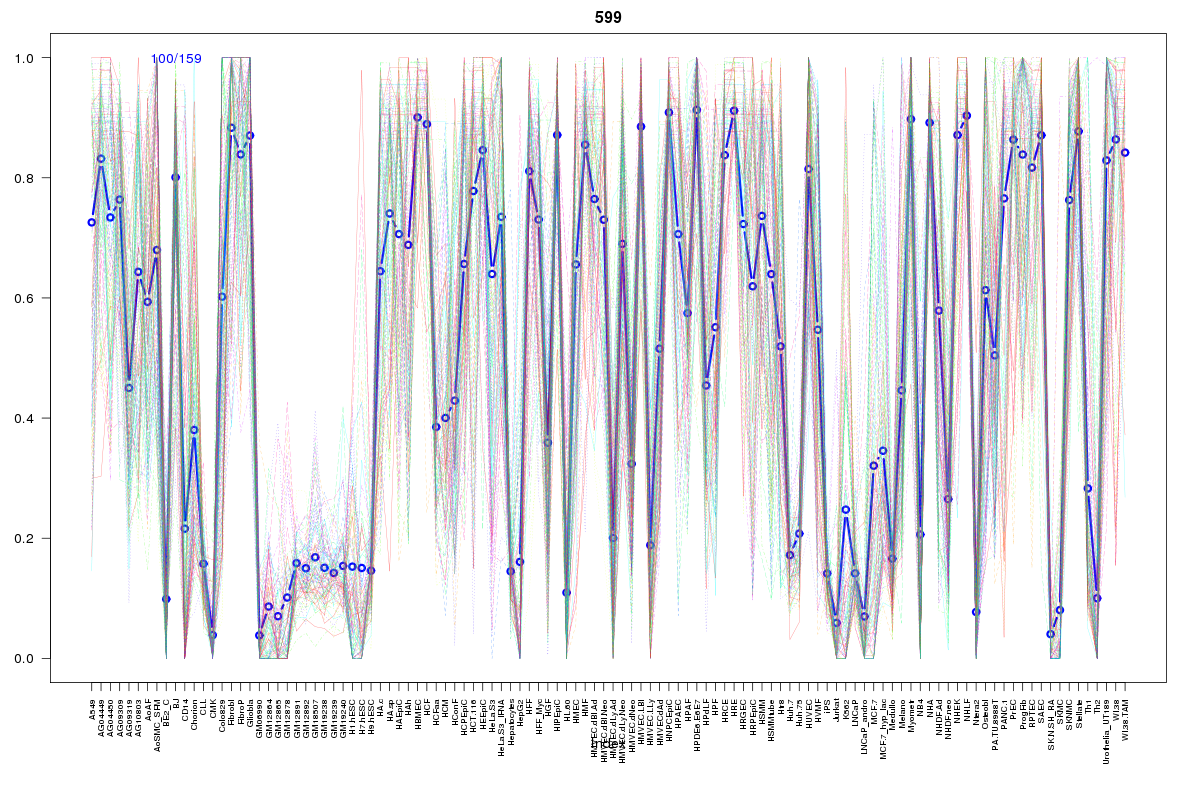 | 599 | 1 |
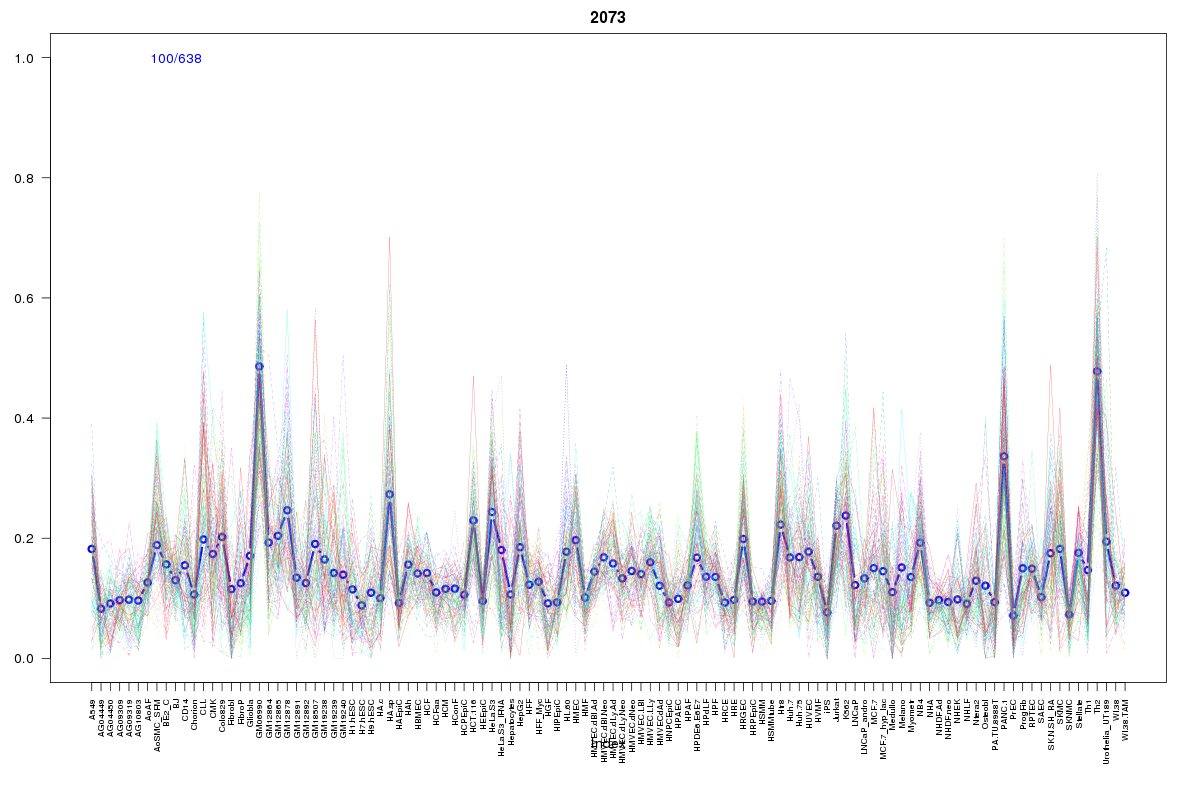 | 2073 | 1 |
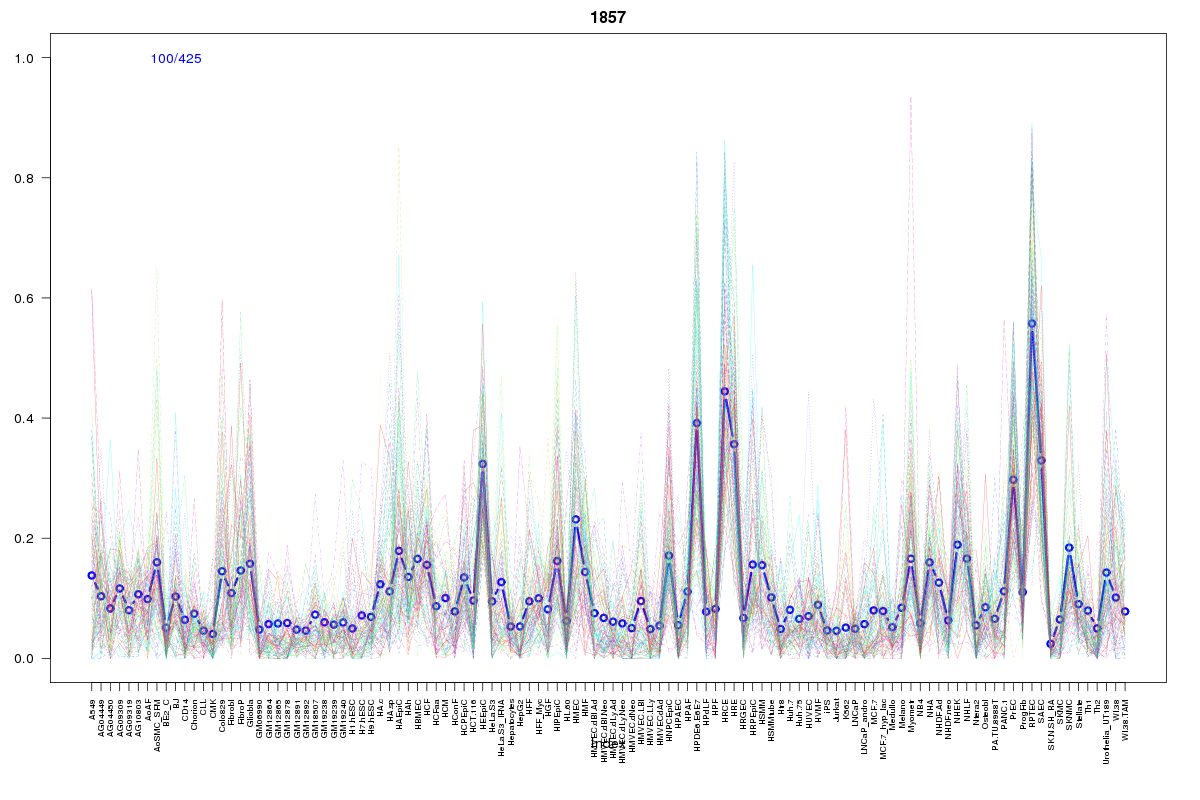 | 1857 | 1 |
 | 1404 | 1 |
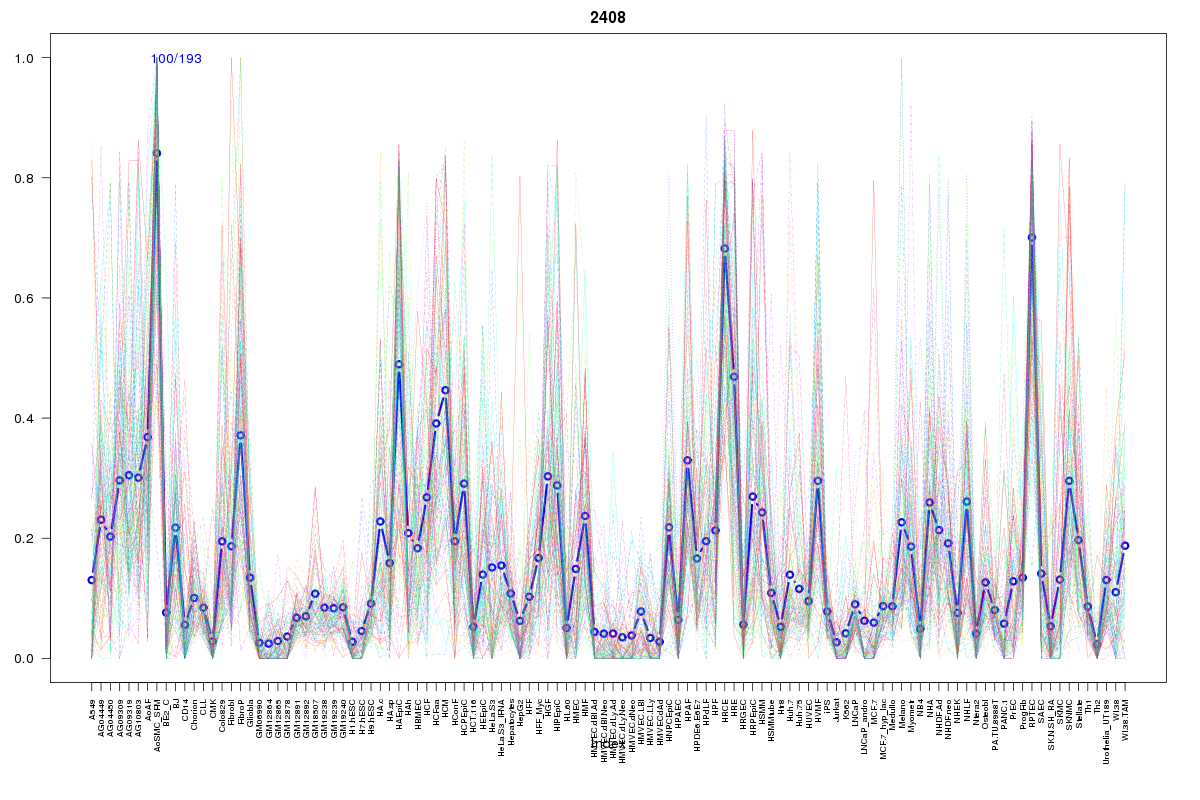 | 2408 | 1 |
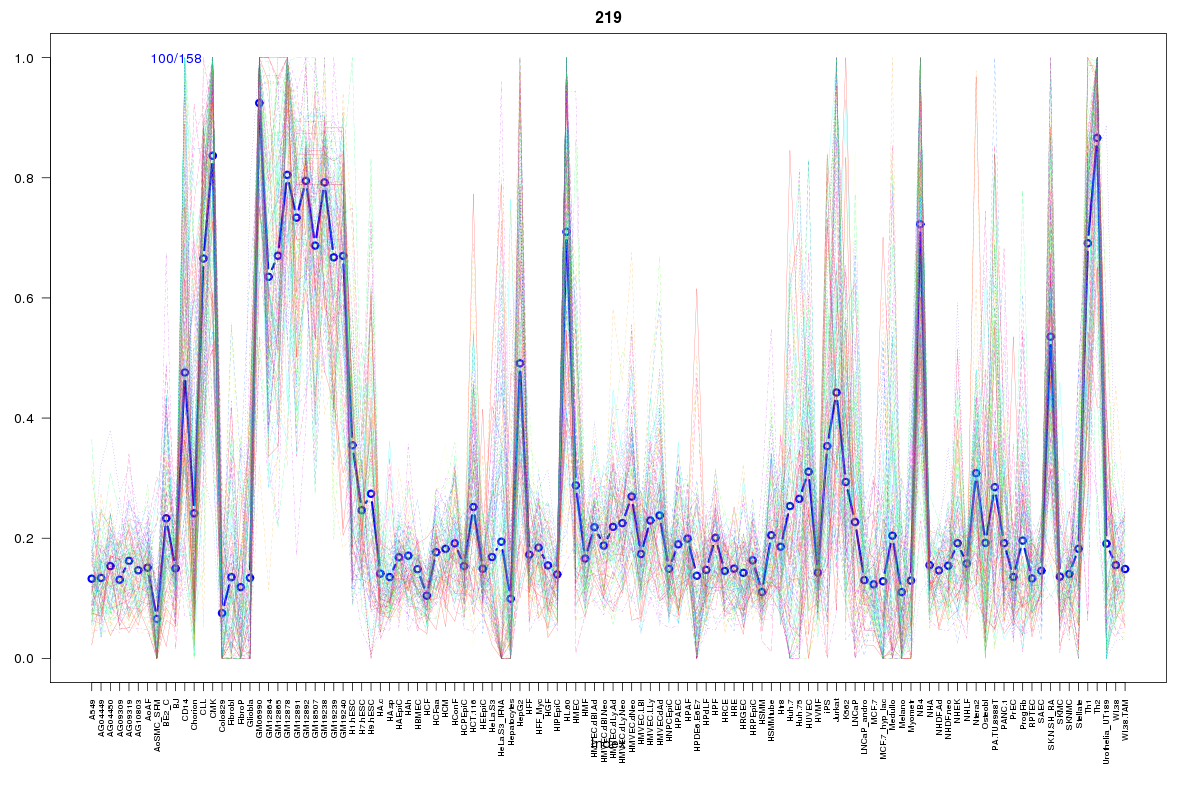 | 219 | 1 |
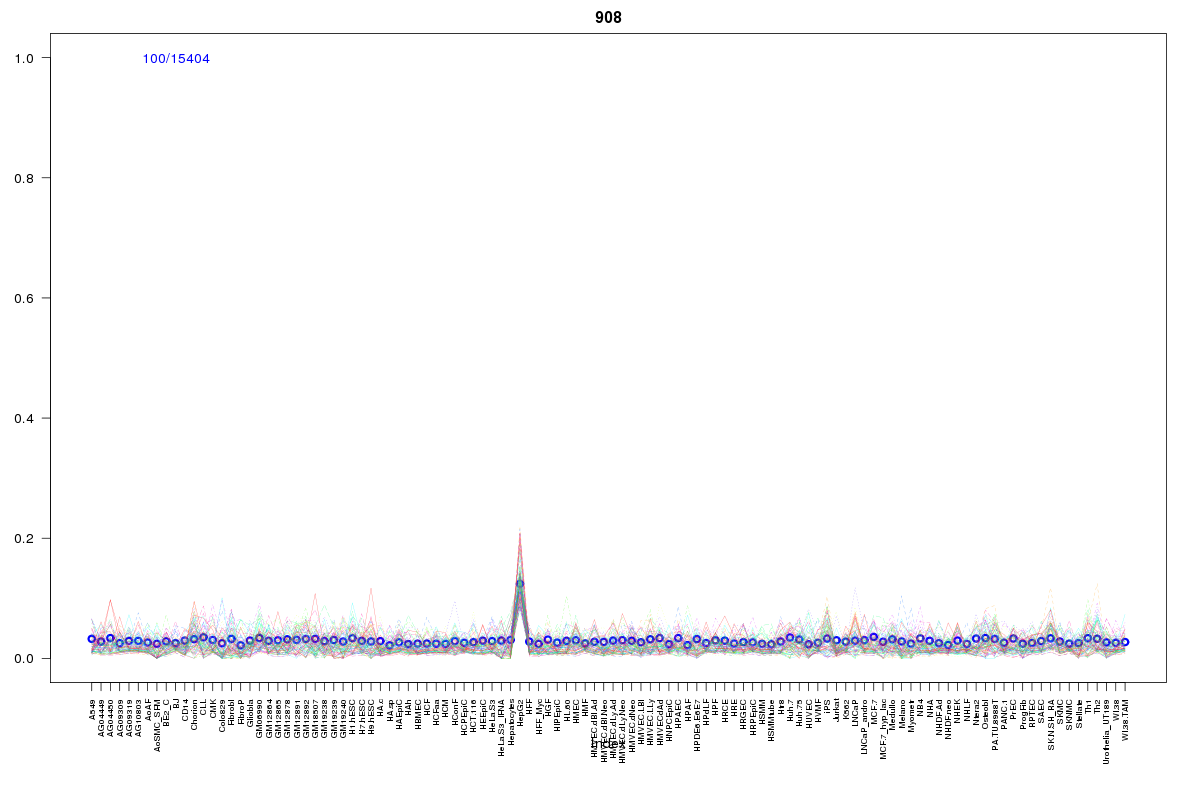 | 908 | 1 |
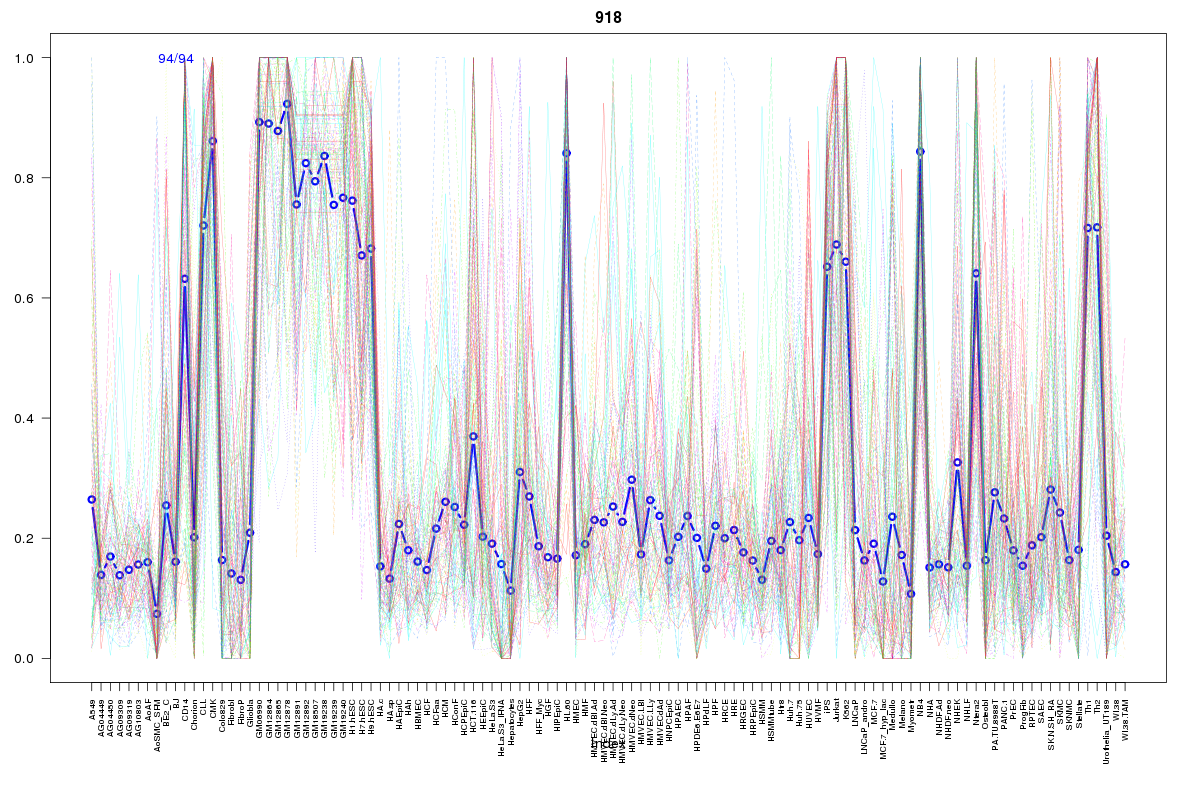 | 918 | 1 |
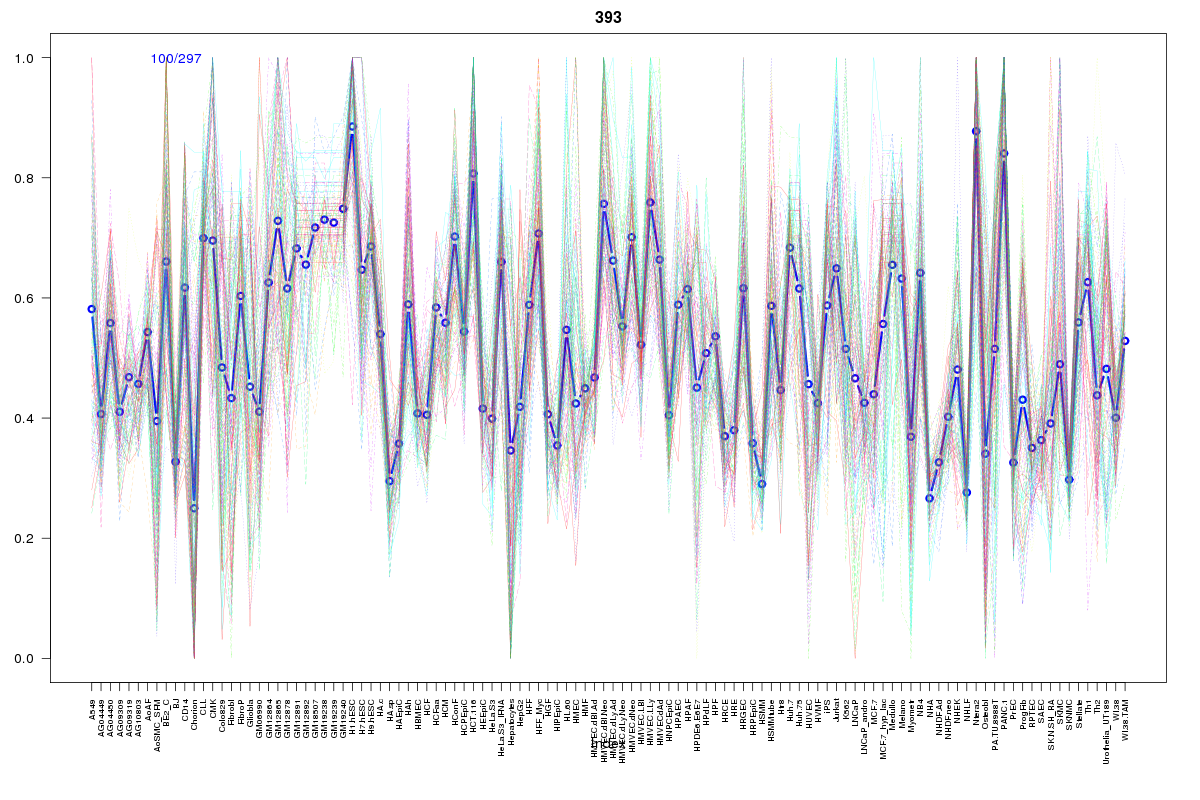 | 393 | 1 |
 | 1056 | 1 |
Resources
BED file downloads
Connects to 39 DHS sitesTop 10 Correlated DHS Sites
p-values indiciate significant higher or lower correlation| Location | Cluster | P-value |
|---|---|---|
| chr1:24429620-24429770 | 1520 | 0 |
| chr1:24429460-24429610 | 862 | 0 |
| chr1:24435000-24435150 | 1355 | 0 |
| chr1:24435165-24435315 | 2207 | 0 |
| chr1:24422960-24423110 | 1520 | 0.006 |
| chr1:24474405-24474555 | 2055 | 0.007 |
| chr1:24428840-24428990 | 1520 | 0.007 |
| chr1:24381400-24381550 | 1721 | 0.007 |
| chr1:24431980-24432130 | 1569 | 0.011 |
| chr1:24438680-24438830 | 1520 | 0.012 |
| chr1:24379460-24379610 | 1721 | 0.012 |
External Databases
UCSCEnsembl (ENSG00000142661)