Gene: LGI3
chr8: 22004337-22014345Expression Profile
(log scale)
Graphical Connections
Distribution of linked clusters:
You may find it interesting if many of the connected DHS sites belong to the same cluster.| Cluster Profile | Cluster ID | Number of DHS sites in this cluster |
|---|---|---|
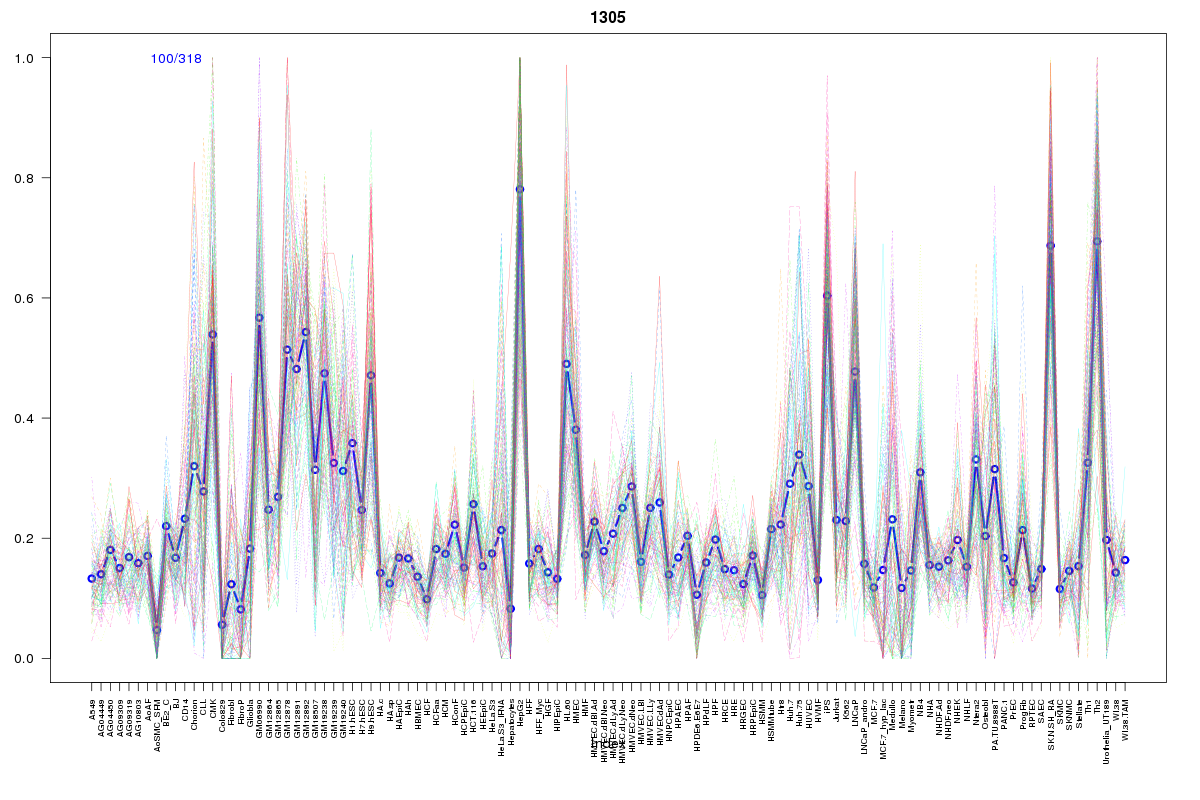 | 1305 | 2 |
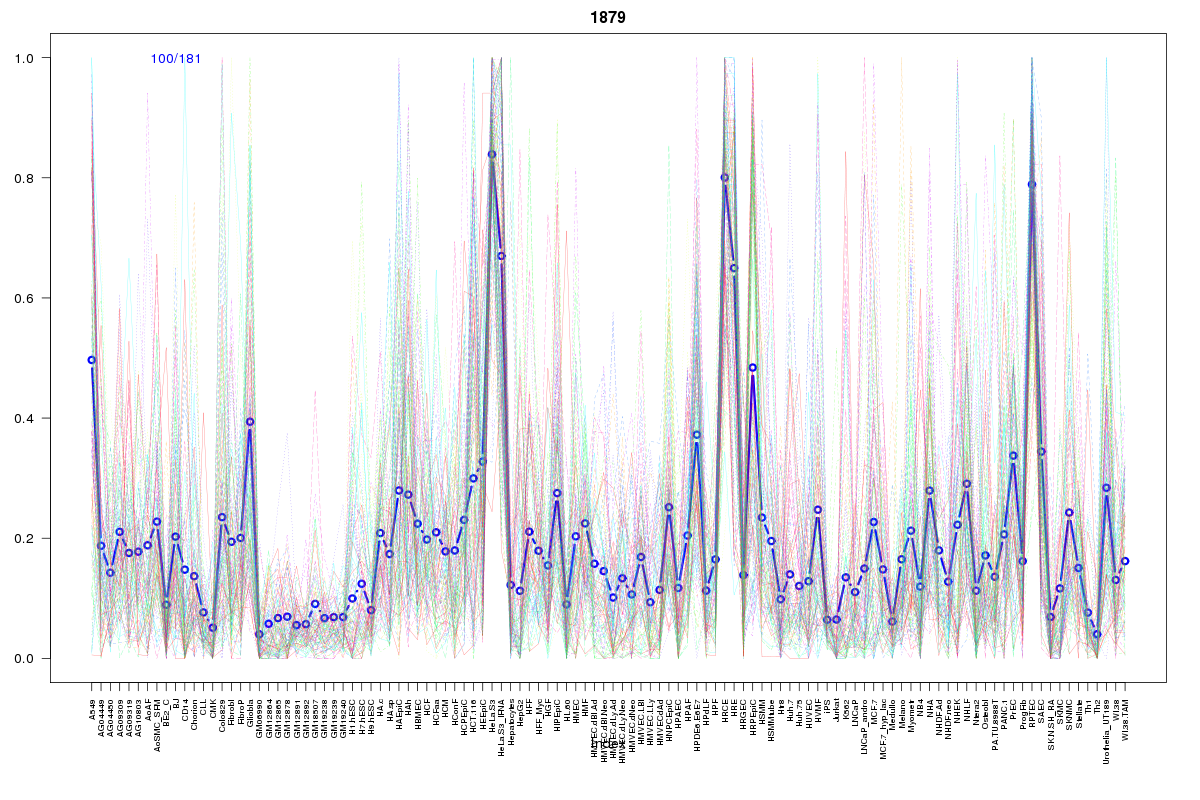 | 1879 | 1 |
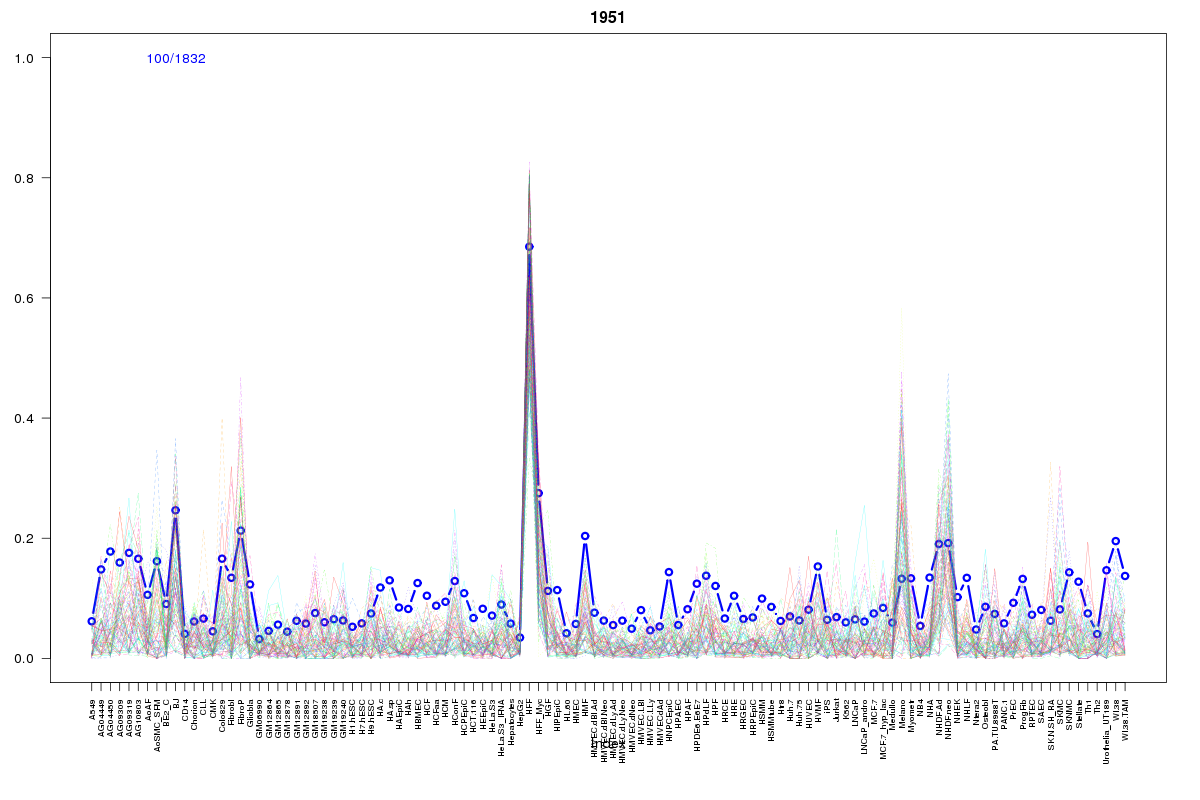 | 1951 | 1 |
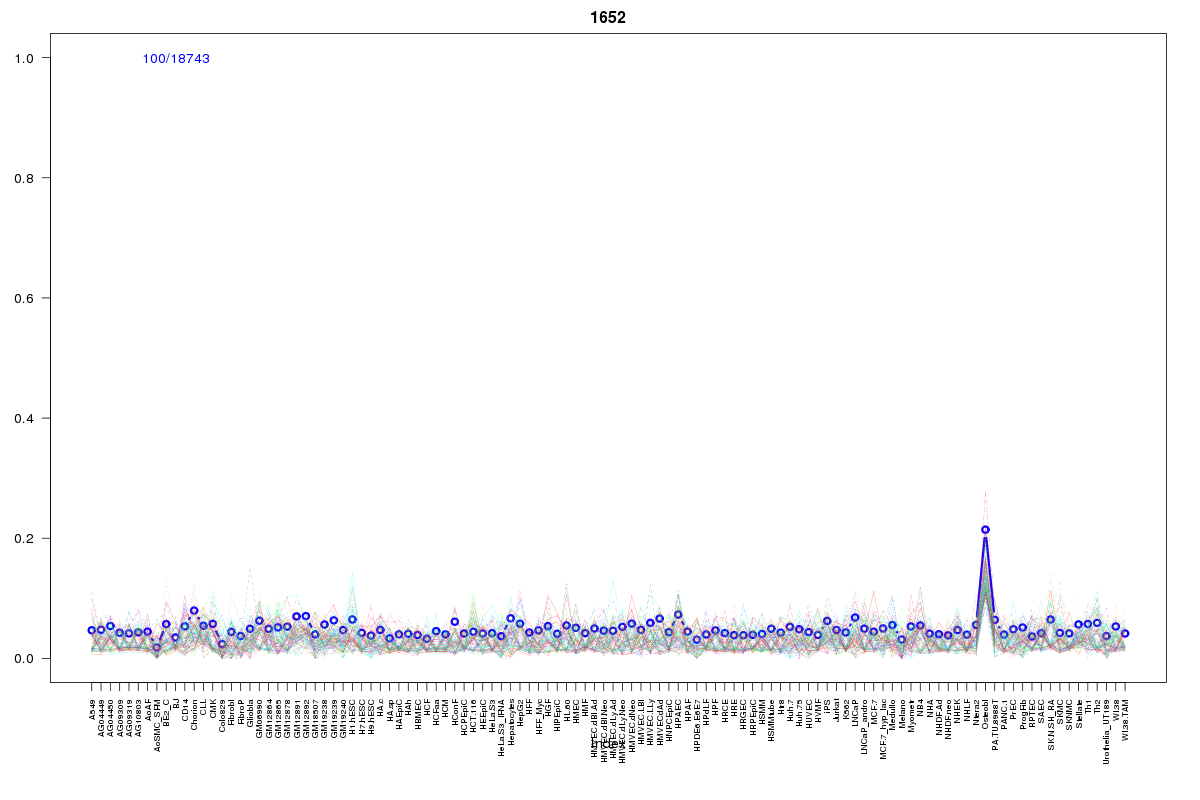 | 1652 | 1 |
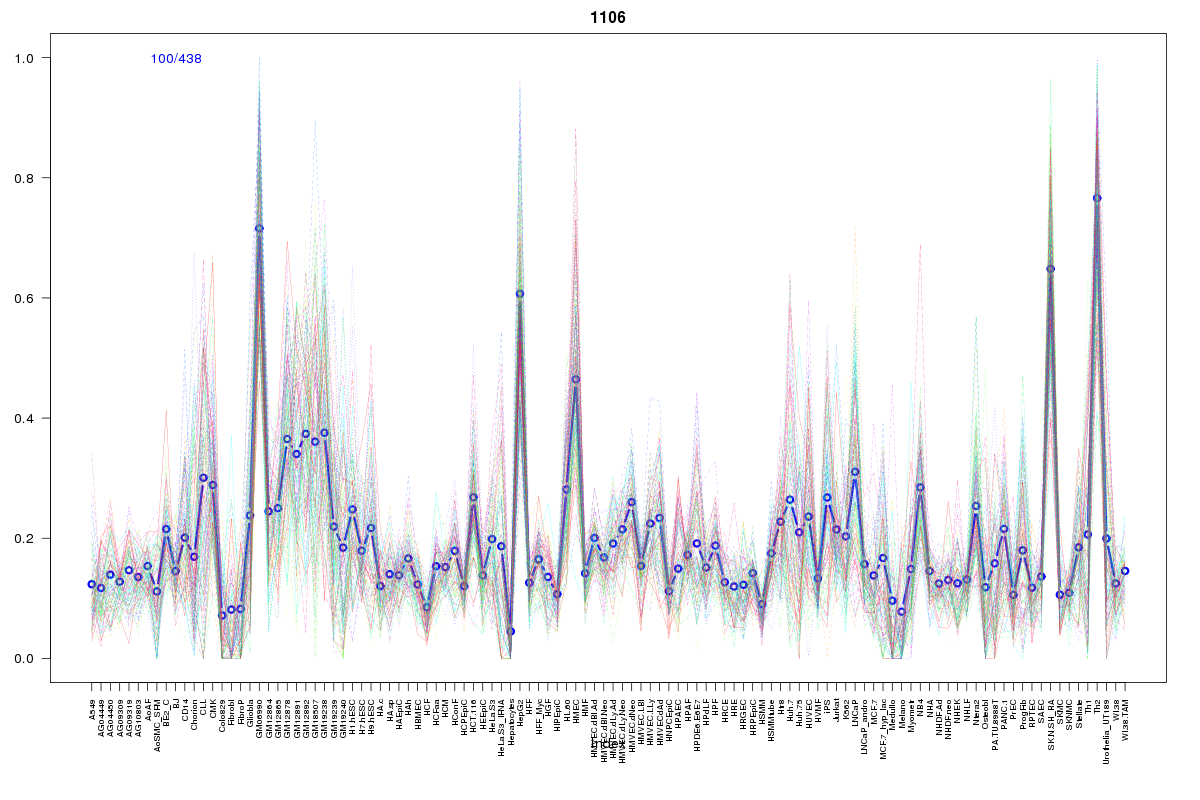 | 1106 | 1 |
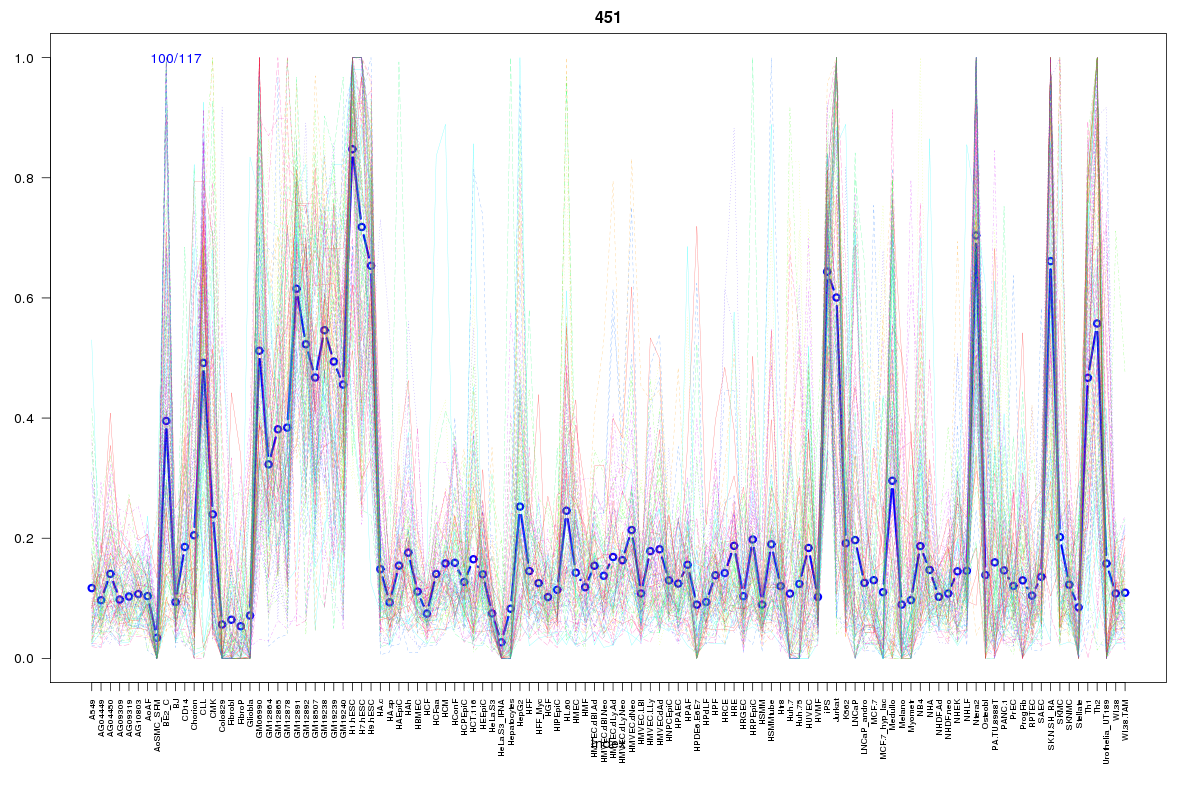 | 451 | 1 |
 | 233 | 1 |
 | 1078 | 1 |
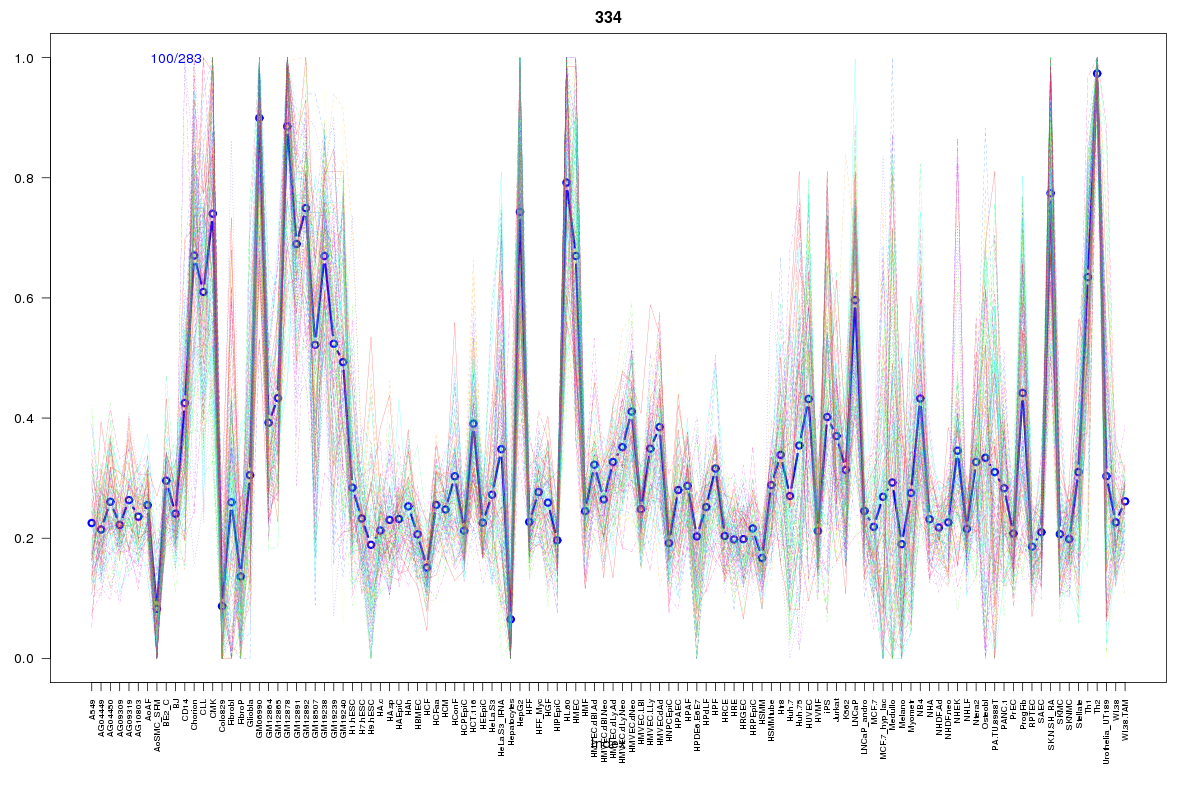 | 334 | 1 |
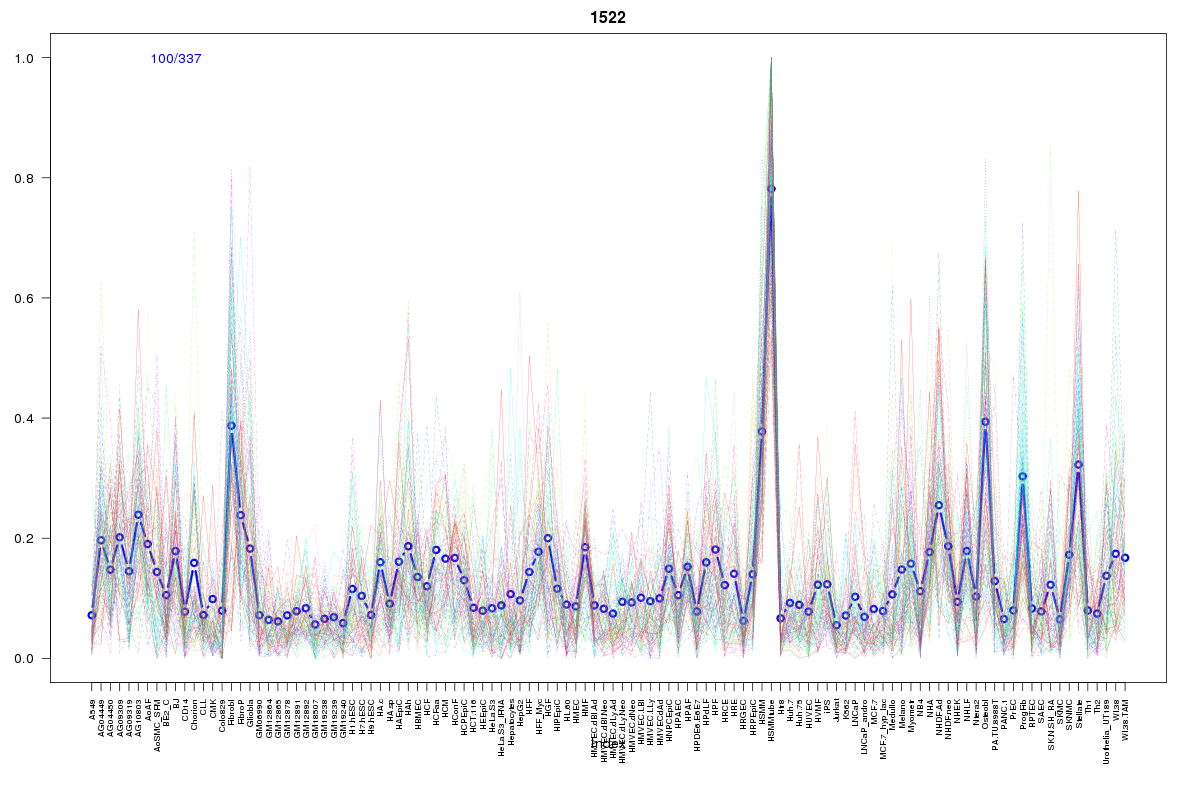 | 1522 | 1 |
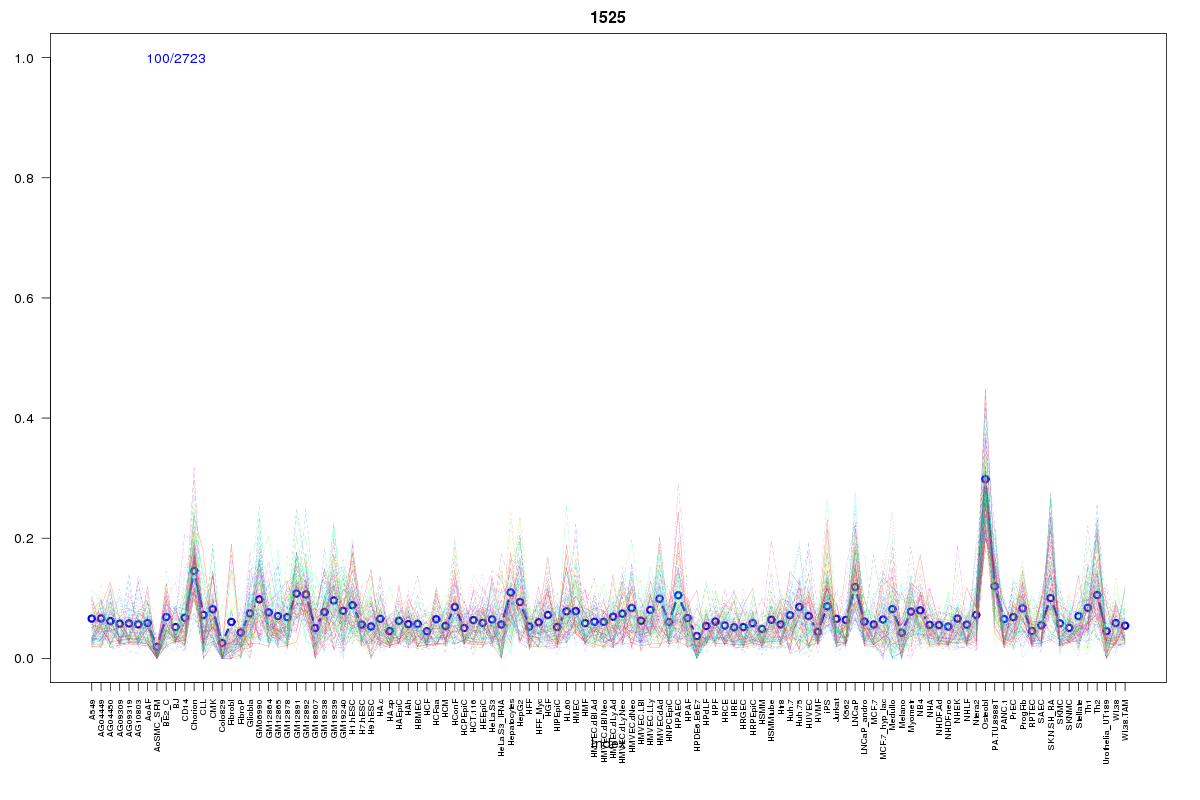 | 1525 | 1 |
 | 1913 | 1 |
 | 1075 | 1 |
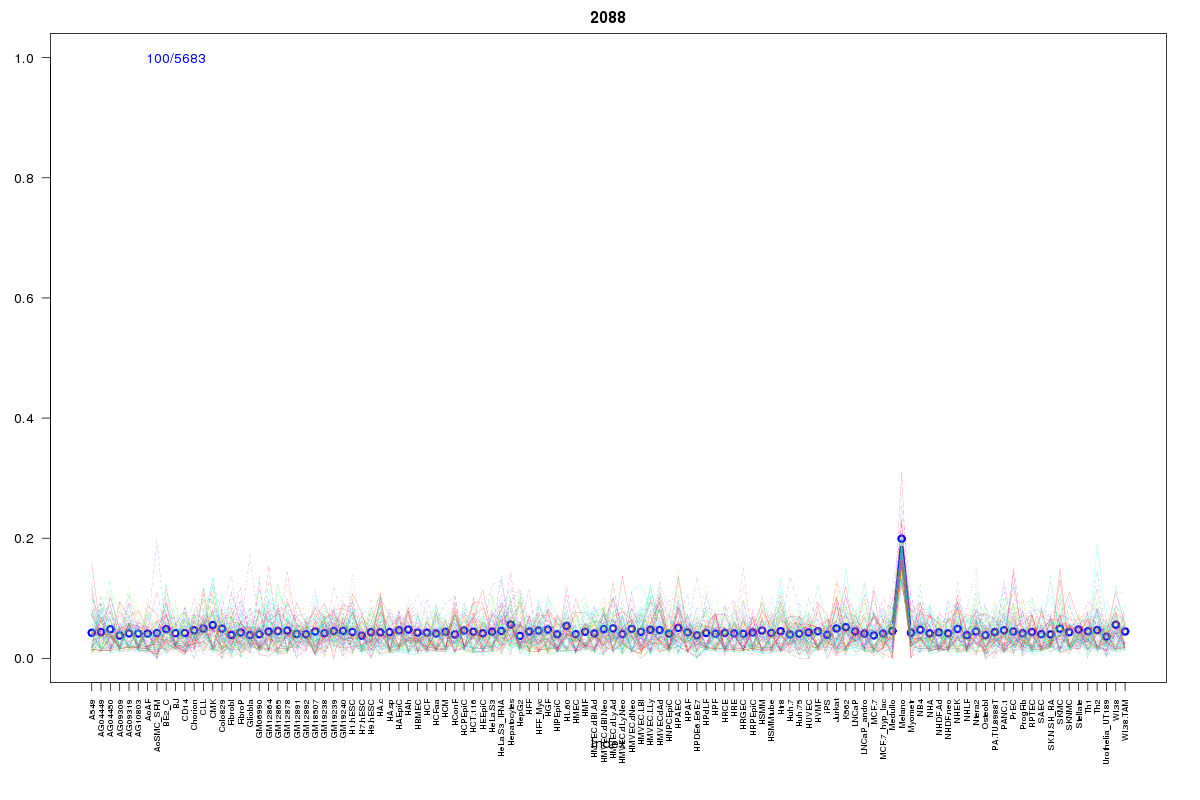 | 2088 | 1 |
 | 1008 | 1 |
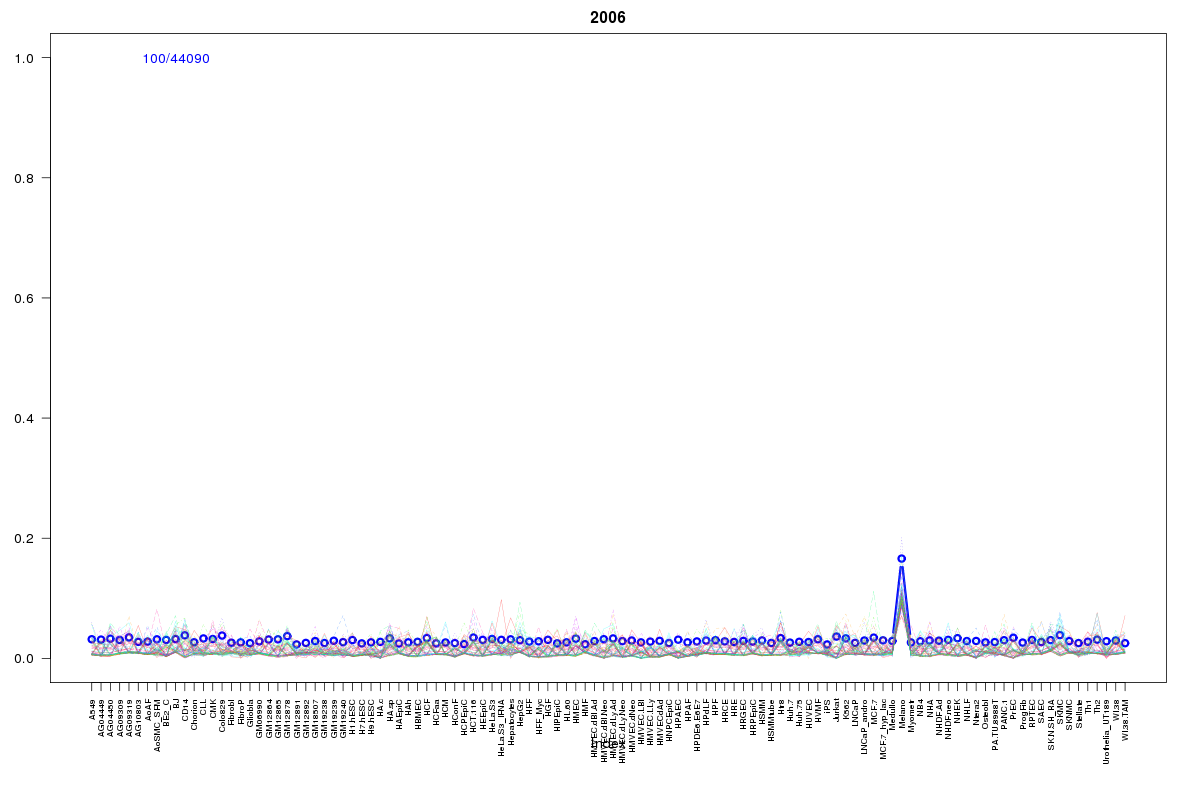 | 2006 | 1 |
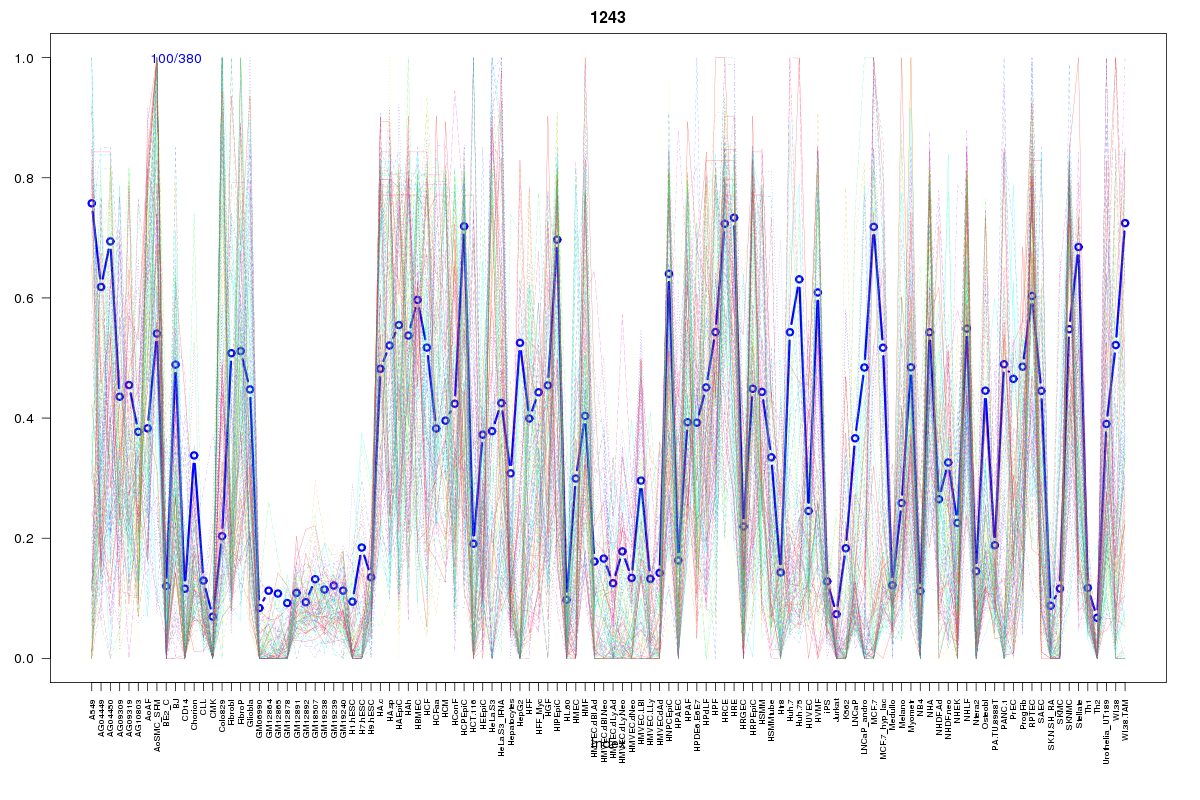 | 1243 | 1 |
Resources
BED file downloads
Connects to 18 DHS sitesTop 10 Correlated DHS Sites
p-values indiciate significant higher or lower correlation| Location | Cluster | P-value |
|---|---|---|
| chr8:22066605-22066755 | 2006 | 0.005 |
| chr8:21992345-21992495 | 1913 | 0.009 |
| chr8:22018305-22018455 | 2088 | 0.011 |
| chr8:22073560-22073710 | 1951 | 0.016 |
| chr8:22014685-22014835 | 1075 | 0.018 |
| chr8:22102180-22102330 | 1106 | 0.024 |
| chr8:22058425-22058575 | 1008 | 0.024 |
| chr8:21991505-21991655 | 1525 | 0.022 |
| chr8:21910445-21910595 | 1652 | 0.018 |
| chr8:21947120-21947270 | 233 | 0.014 |
| chr8:21999160-21999310 | 1305 | 0.013 |
External Databases
UCSCEnsembl (ENSG00000168481)