Gene: TCTEX1D4
chr1: 45271584-45272347Expression Profile
(log scale)
Graphical Connections
Distribution of linked clusters:
You may find it interesting if many of the connected DHS sites belong to the same cluster.| Cluster Profile | Cluster ID | Number of DHS sites in this cluster |
|---|---|---|
 | 421 | 2 |
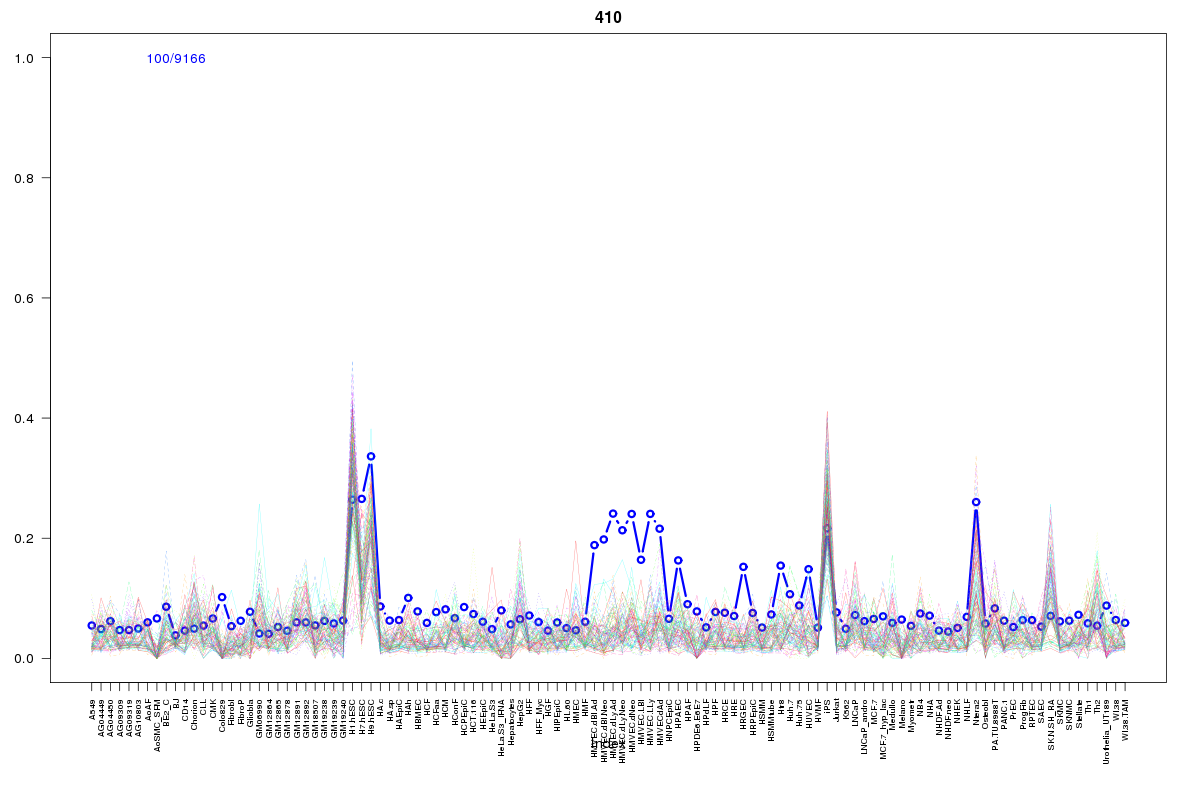 | 410 | 2 |
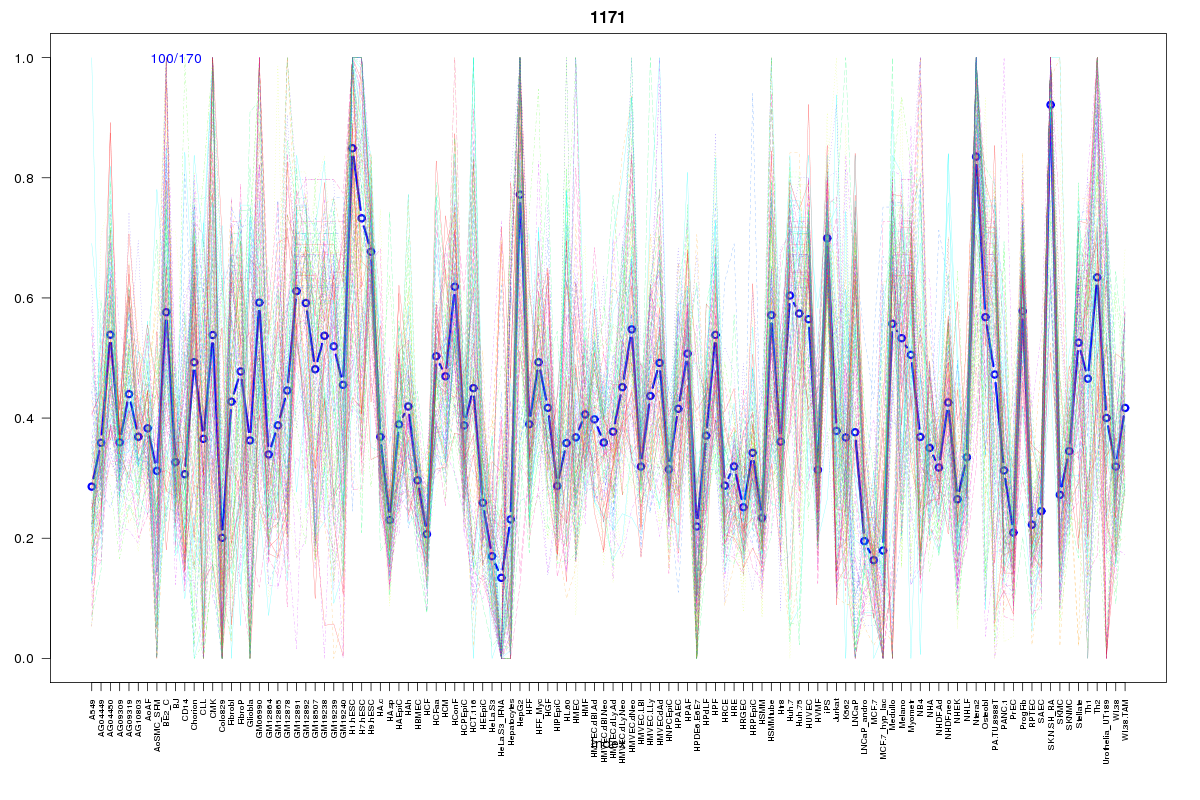 | 1171 | 2 |
 | 10 | 2 |
 | 655 | 2 |
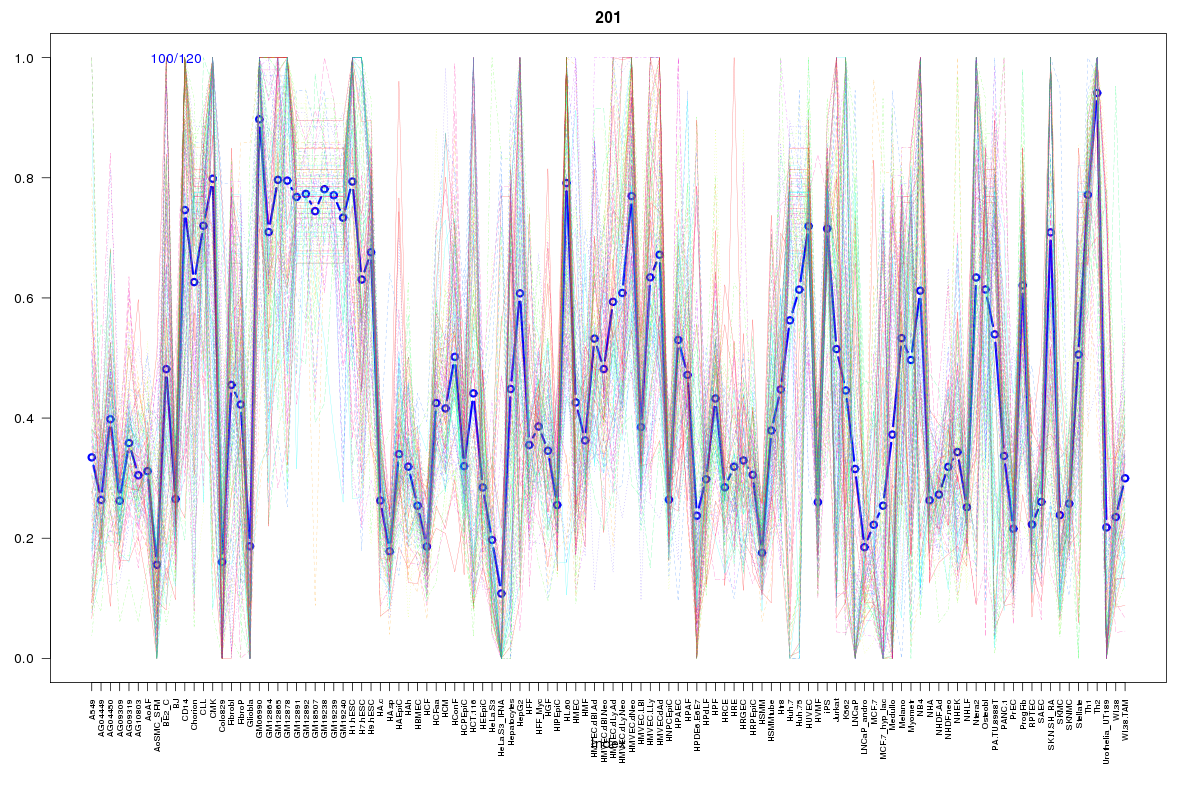 | 201 | 1 |
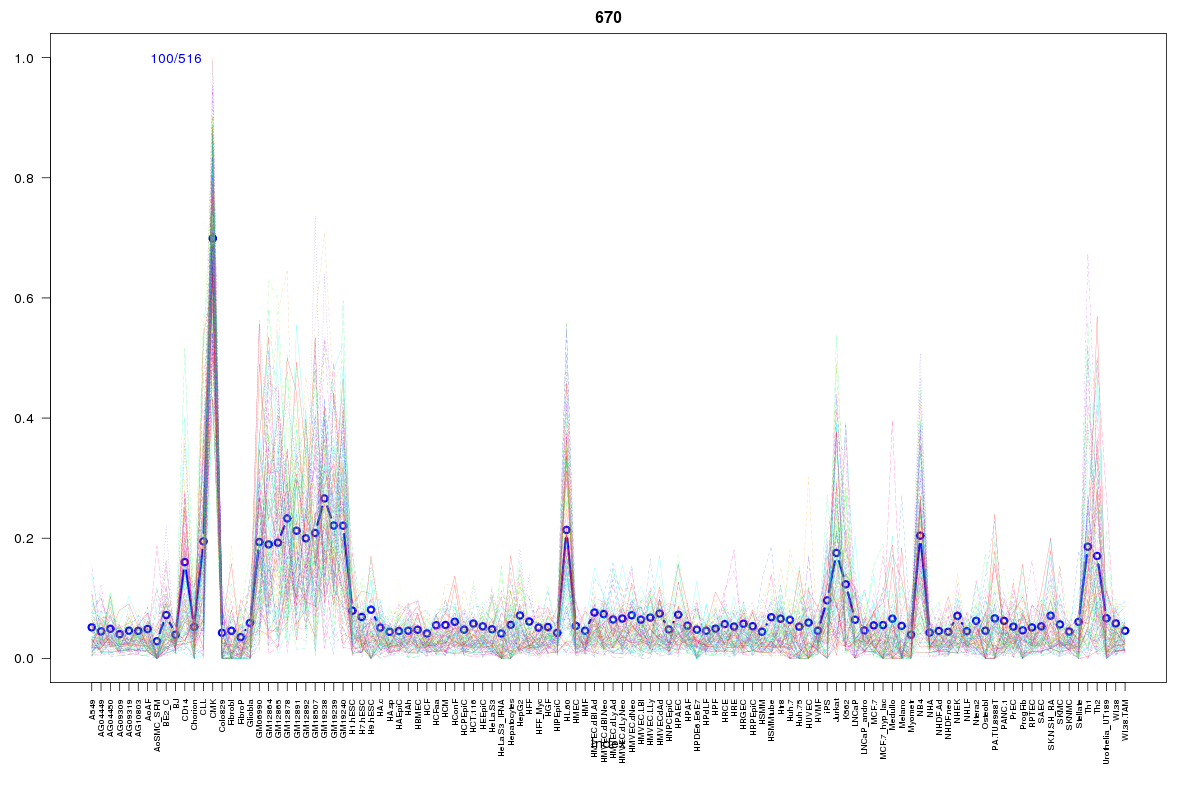 | 670 | 1 |
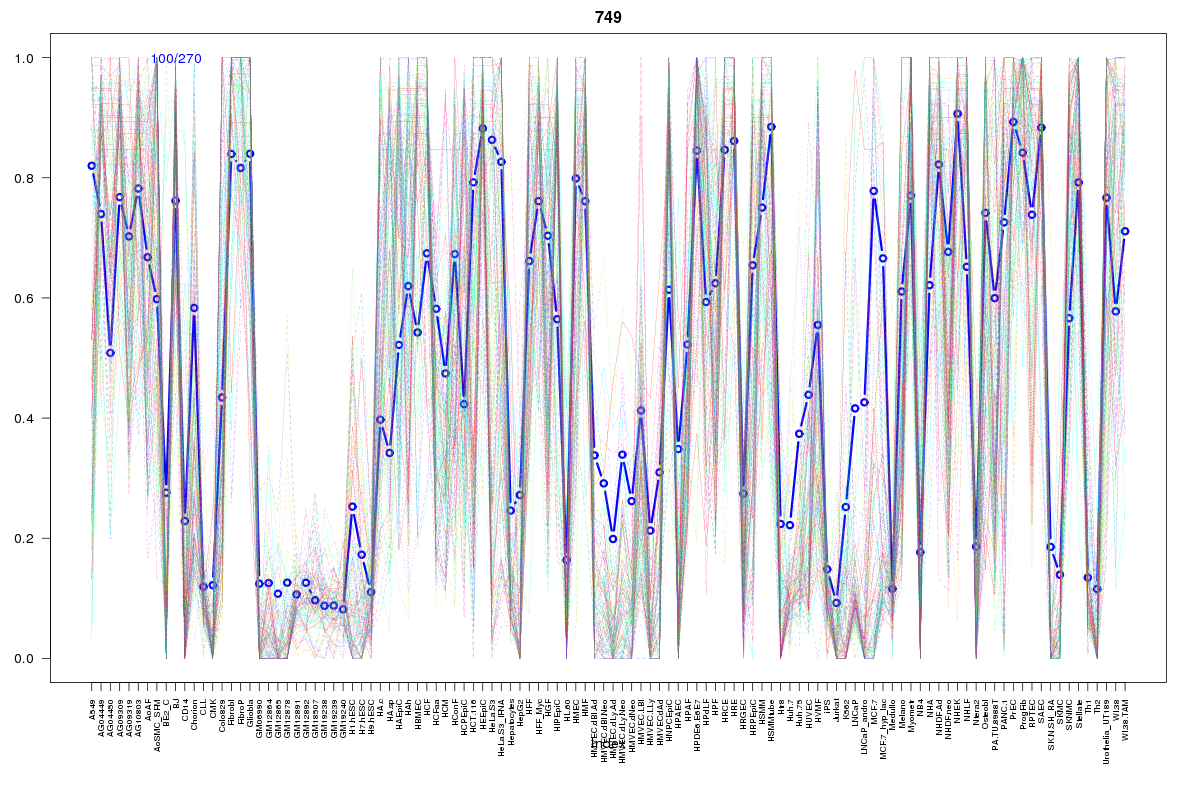 | 749 | 1 |
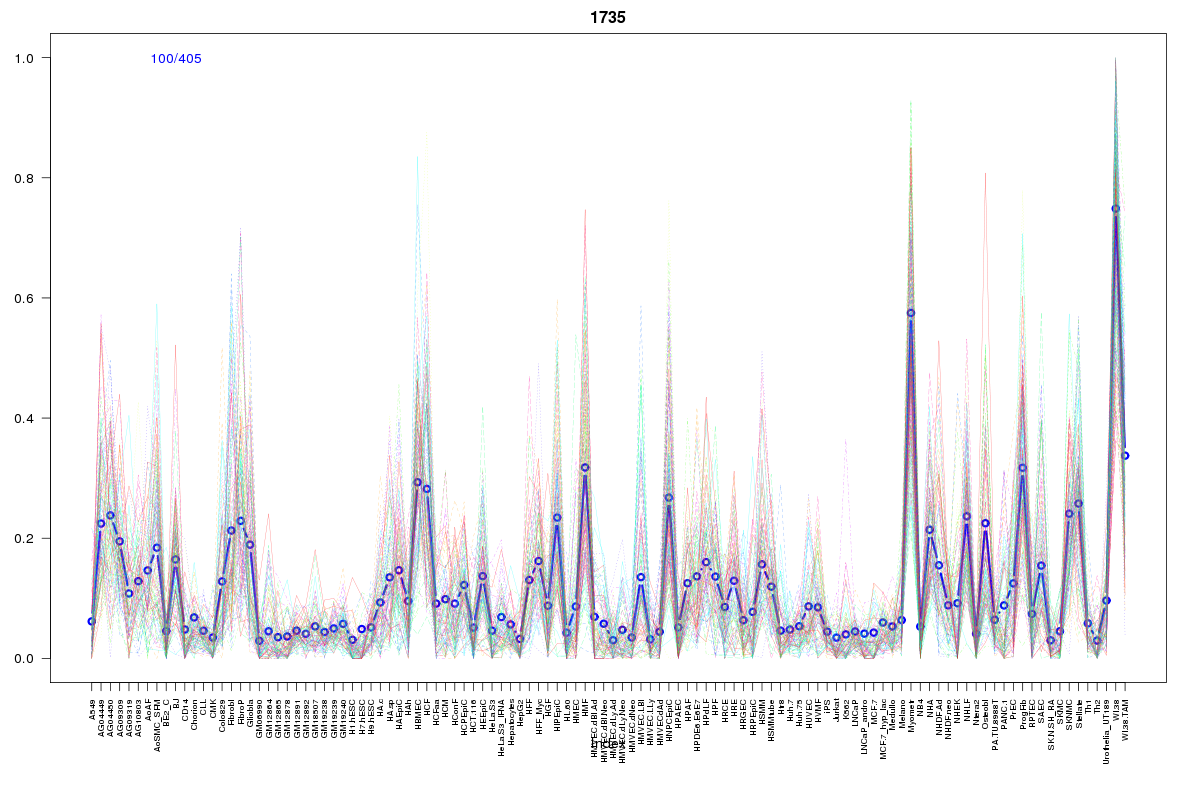 | 1735 | 1 |
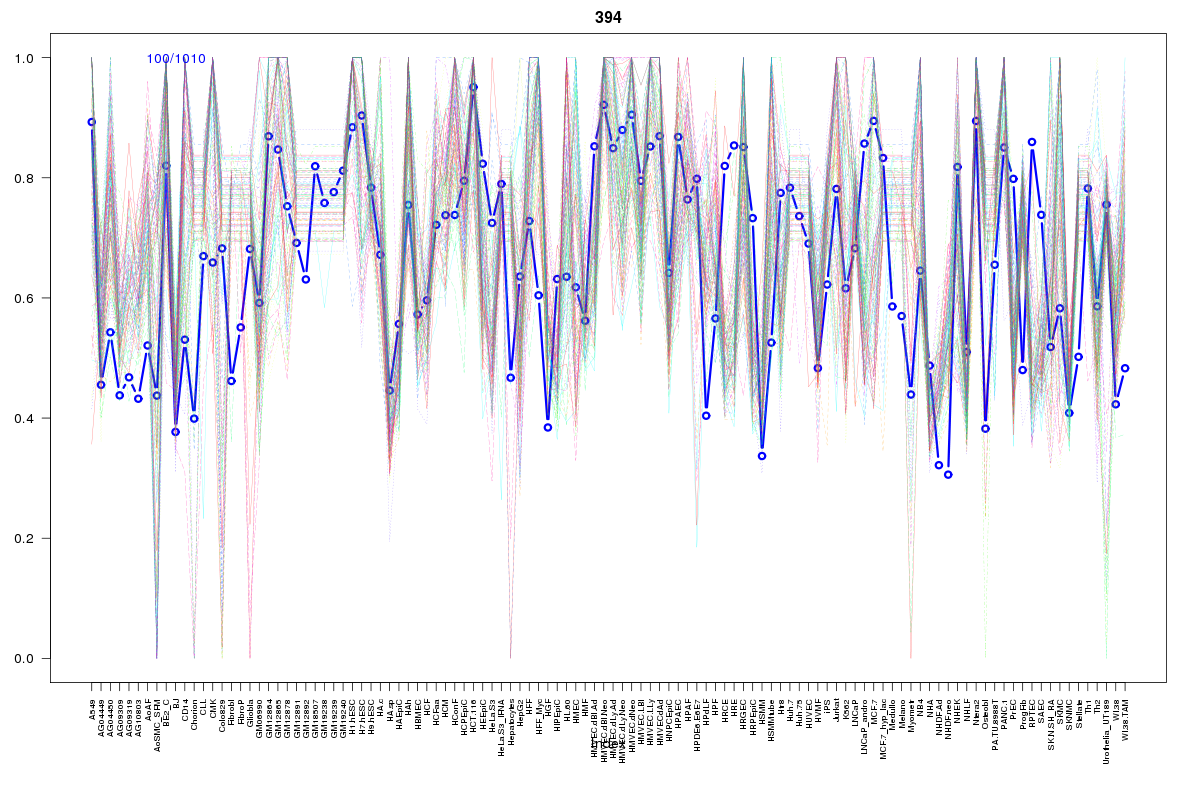 | 394 | 1 |
 | 186 | 1 |
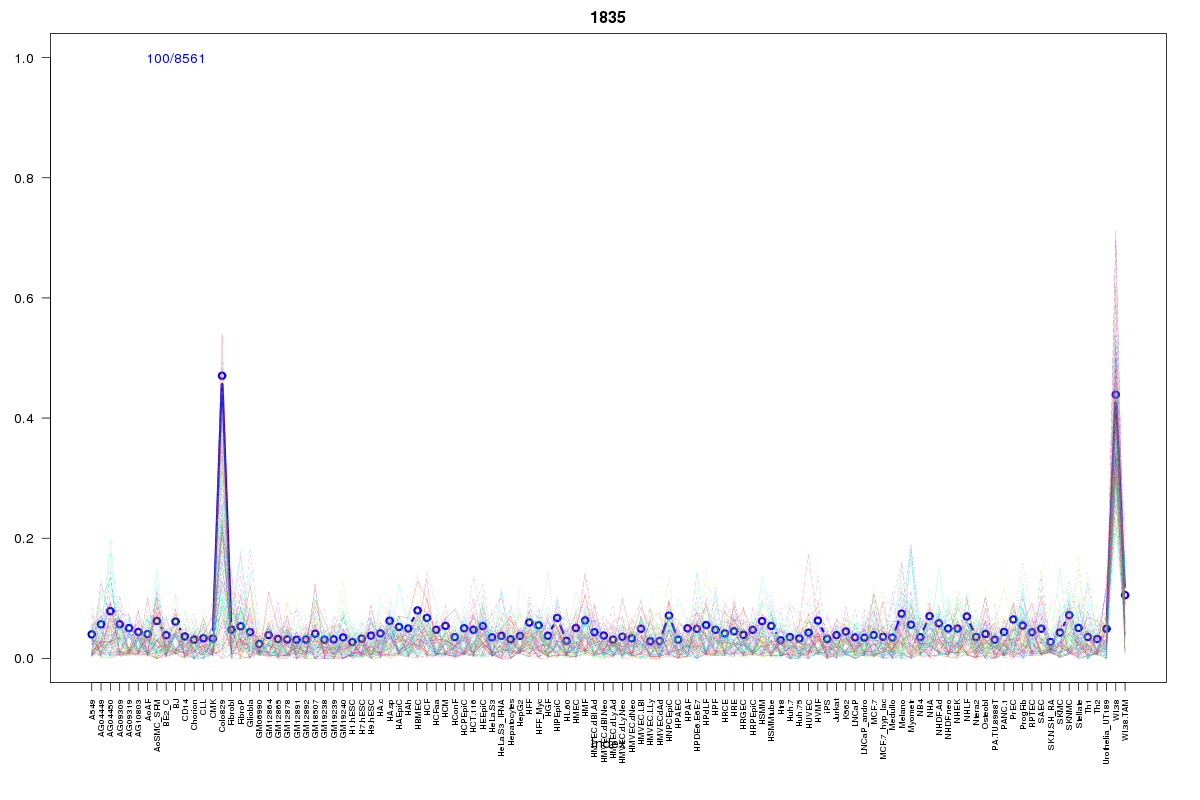 | 1835 | 1 |
 | 282 | 1 |
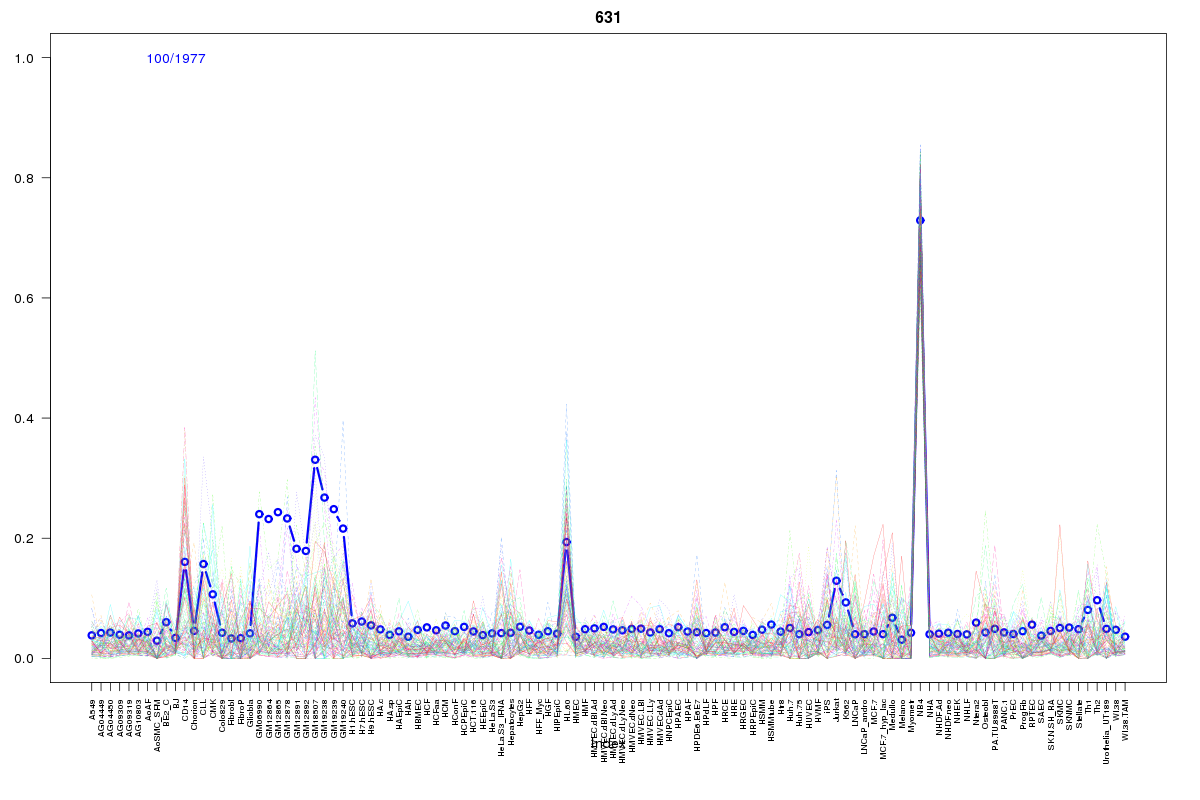 | 631 | 1 |
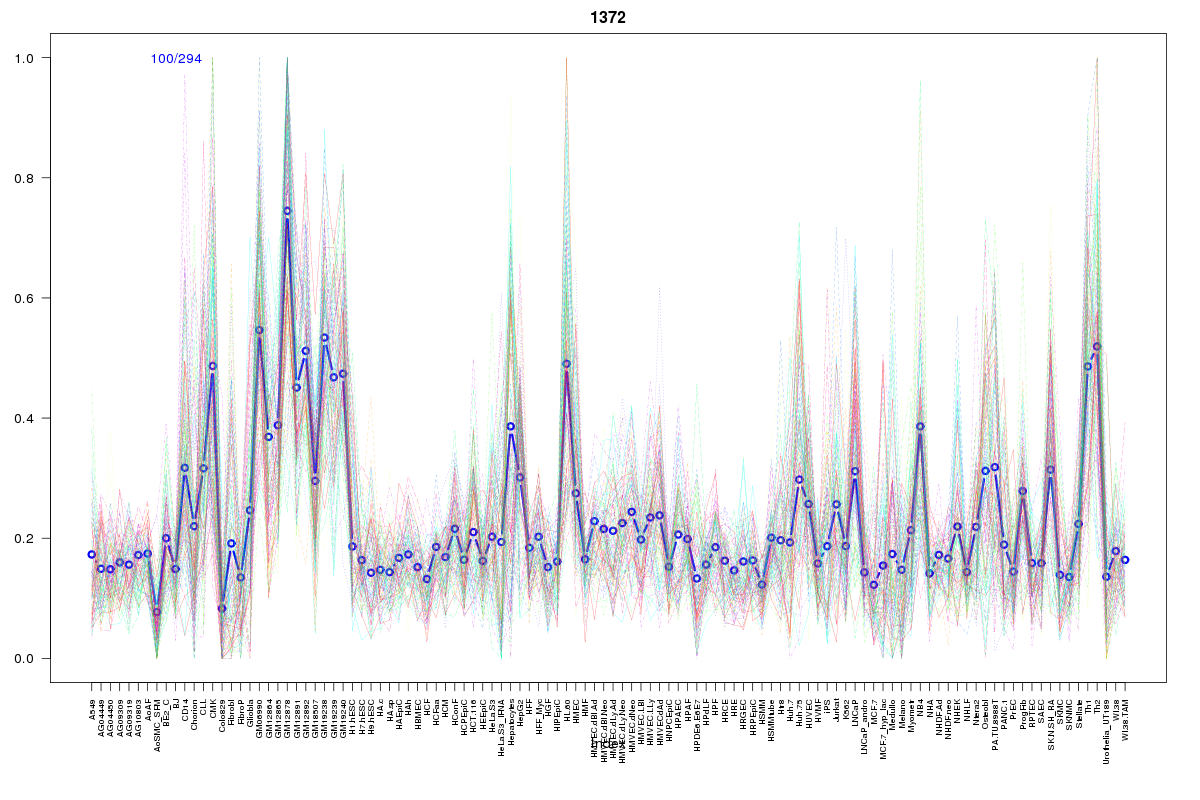 | 1372 | 1 |
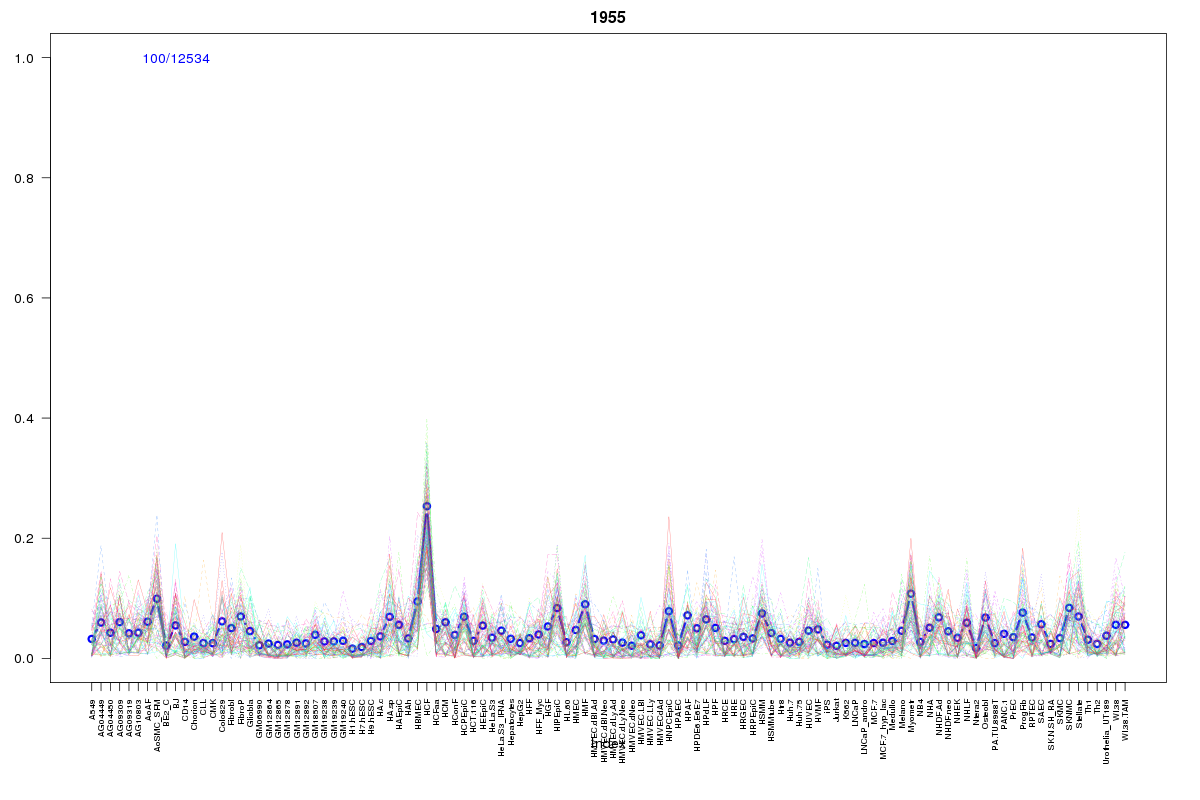 | 1955 | 1 |
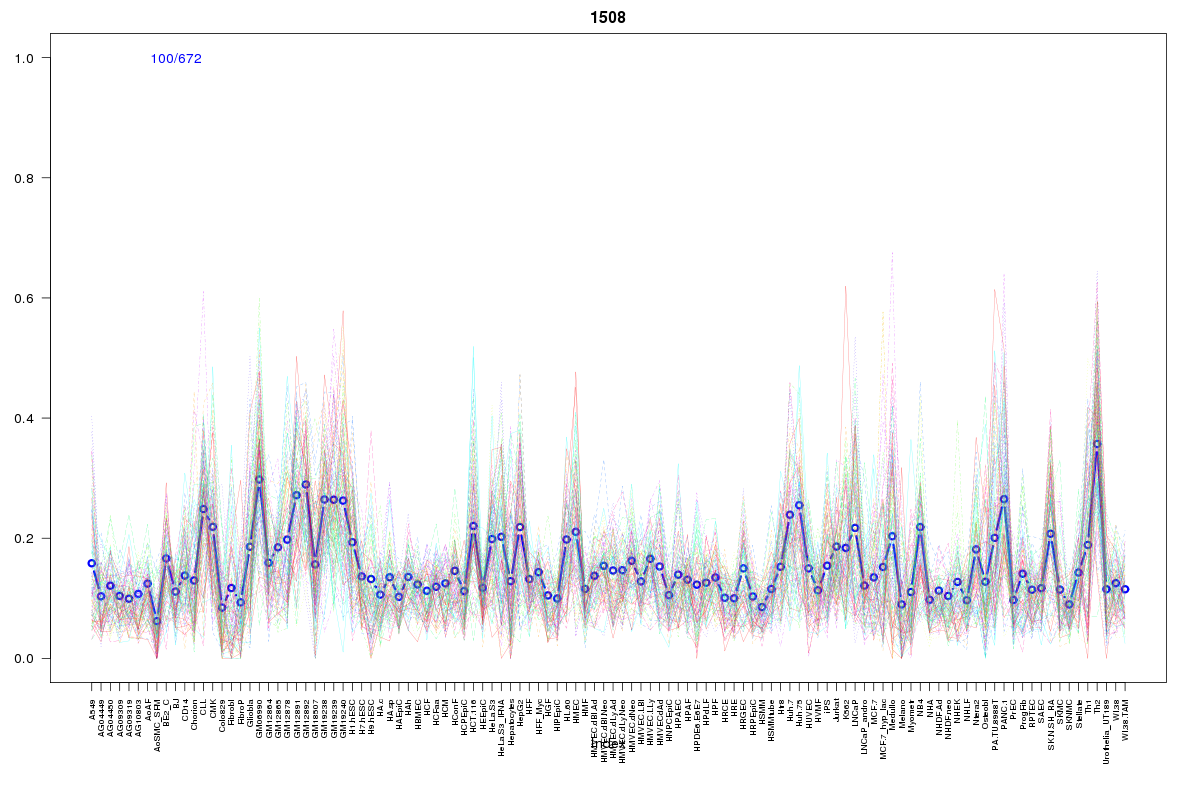 | 1508 | 1 |
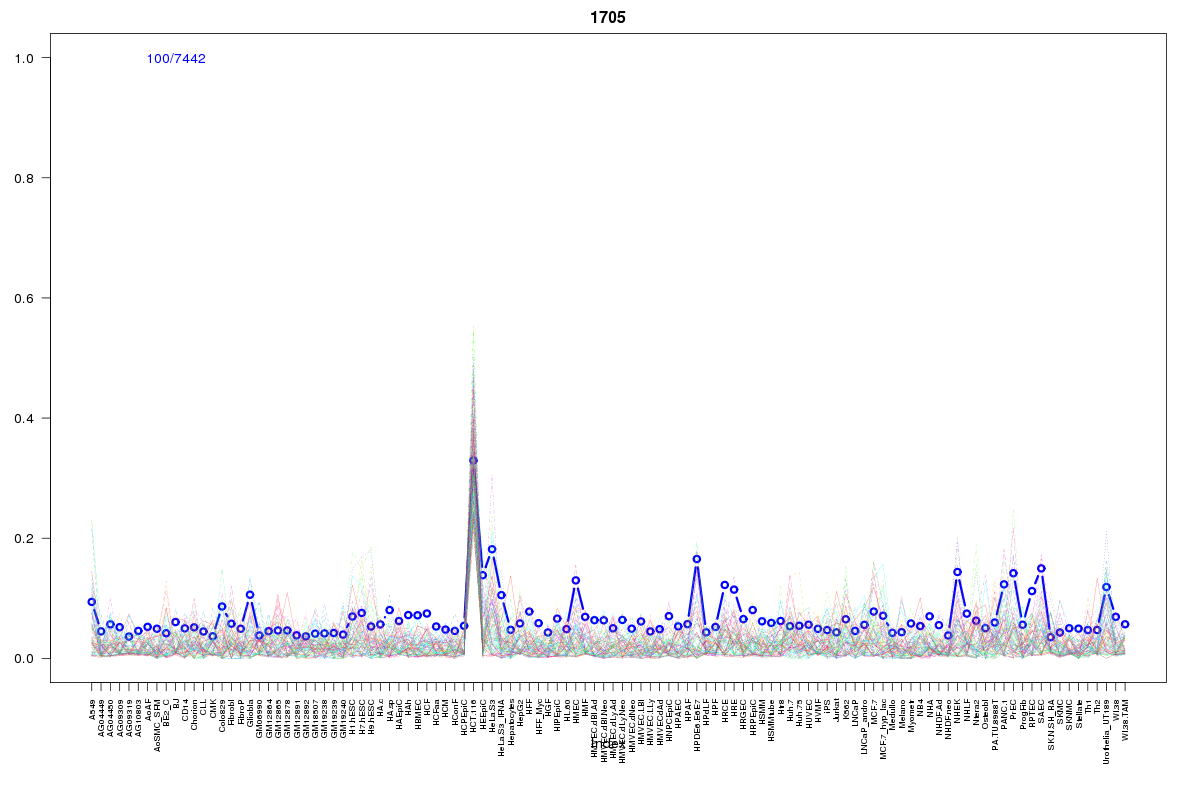 | 1705 | 1 |
 | 430 | 1 |
 | 862 | 1 |
 | 615 | 1 |
 | 626 | 1 |
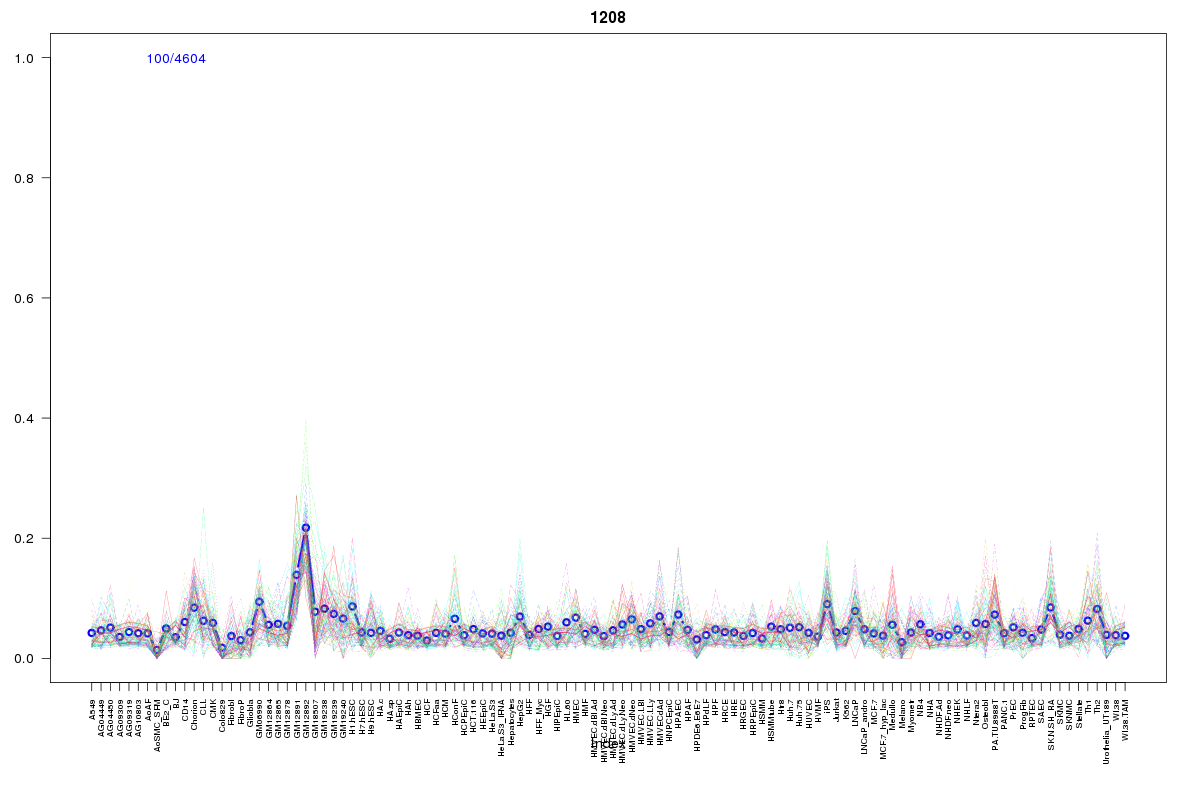 | 1208 | 1 |
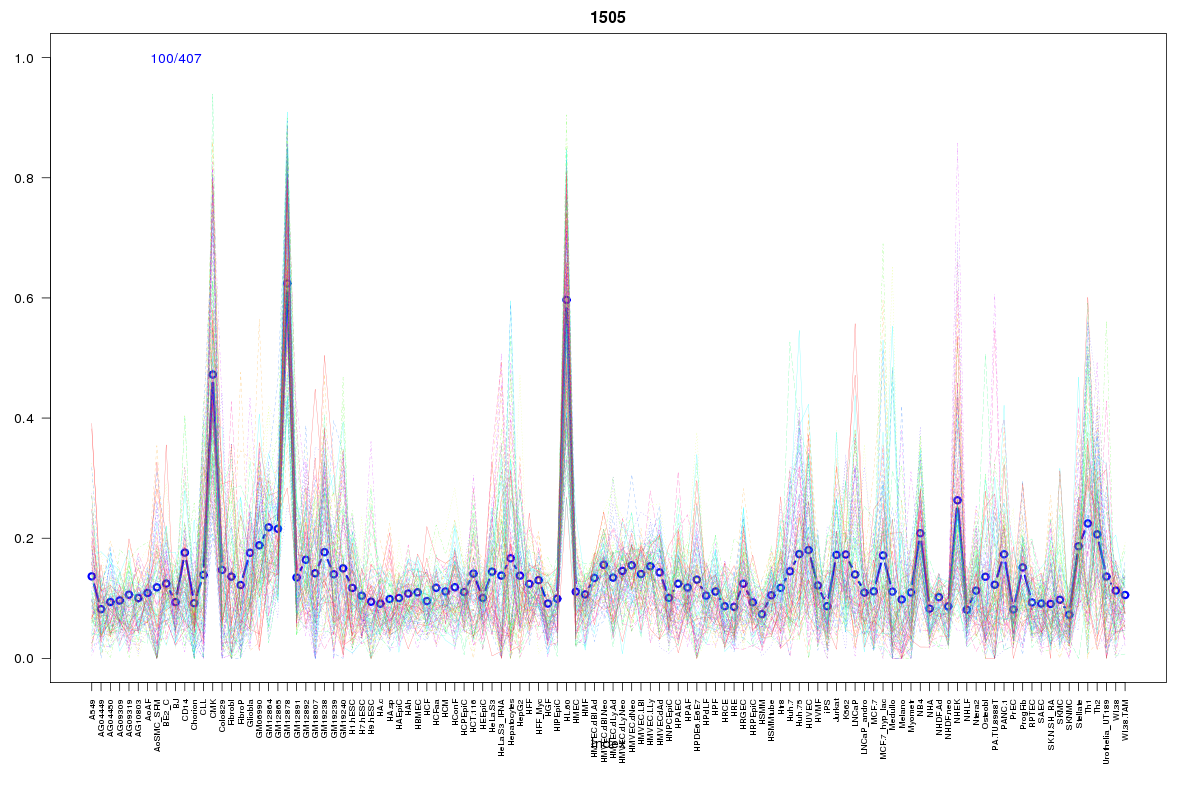 | 1505 | 1 |
 | 927 | 1 |
 | 2055 | 1 |
 | 2052 | 1 |
 | 1818 | 1 |
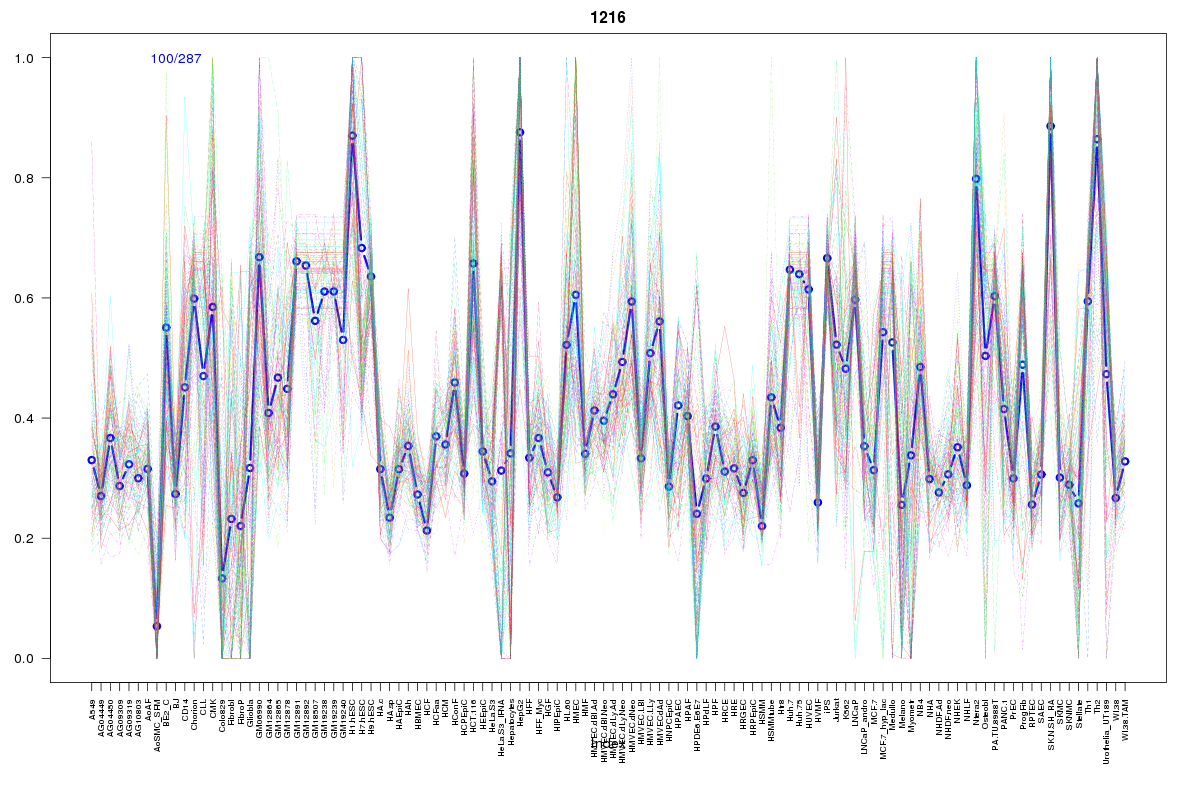 | 1216 | 1 |
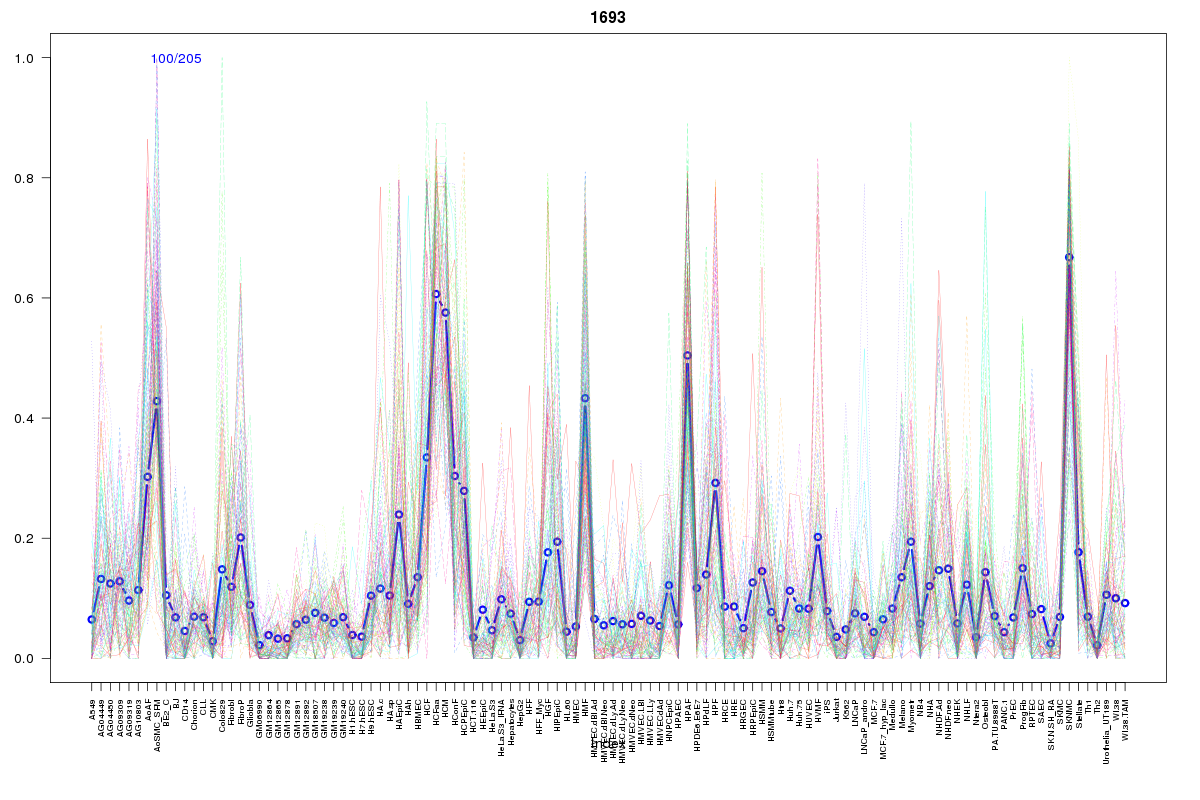 | 1693 | 1 |
Resources
BED file downloads
Connects to 35 DHS sitesTop 10 Correlated DHS Sites
p-values indiciate significant higher or lower correlation| Location | Cluster | P-value |
|---|---|---|
| chr1:45184520-45184670 | 1835 | 0.001 |
| chr1:45328820-45328970 | 1818 | 0.009 |
| chr1:45310545-45310695 | 927 | 0.01 |
| chr1:45277205-45277355 | 1735 | 0.011 |
| chr1:45198040-45198190 | 862 | 0.011 |
| chr1:45277565-45277715 | 186 | 0.012 |
| chr1:45369060-45369210 | 1693 | 0.012 |
| chr1:45192820-45192970 | 1955 | 0.012 |
| chr1:45323265-45323415 | 2055 | 0.012 |
| chr1:45172900-45173050 | 749 | 0.013 |
| chr1:45197880-45198030 | 1705 | 0.014 |
External Databases
UCSCEnsembl (ENSG00000188396)