Gene: ATP1A2
chr1: 160085548-160106992Expression Profile
(log scale)
Graphical Connections
Distribution of linked clusters:
You may find it interesting if many of the connected DHS sites belong to the same cluster.| Cluster Profile | Cluster ID | Number of DHS sites in this cluster |
|---|---|---|
 | 10 | 4 |
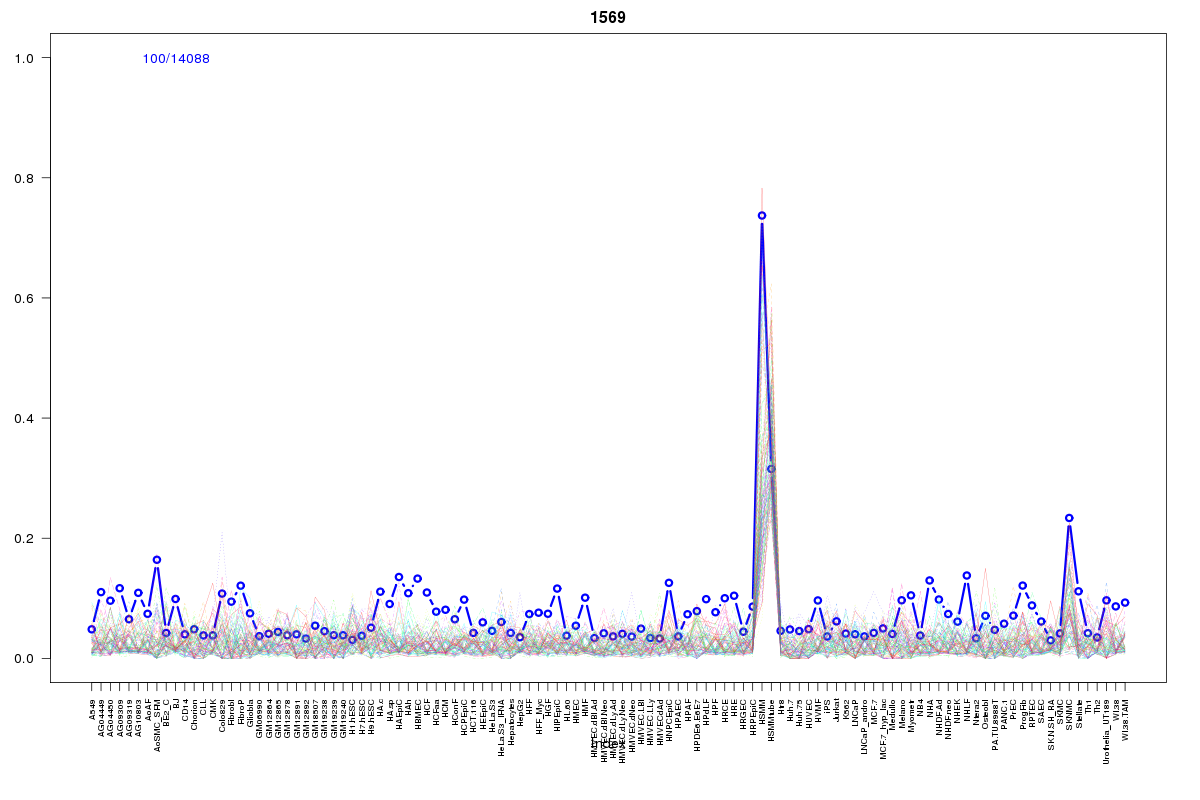 | 1569 | 4 |
 | 15 | 2 |
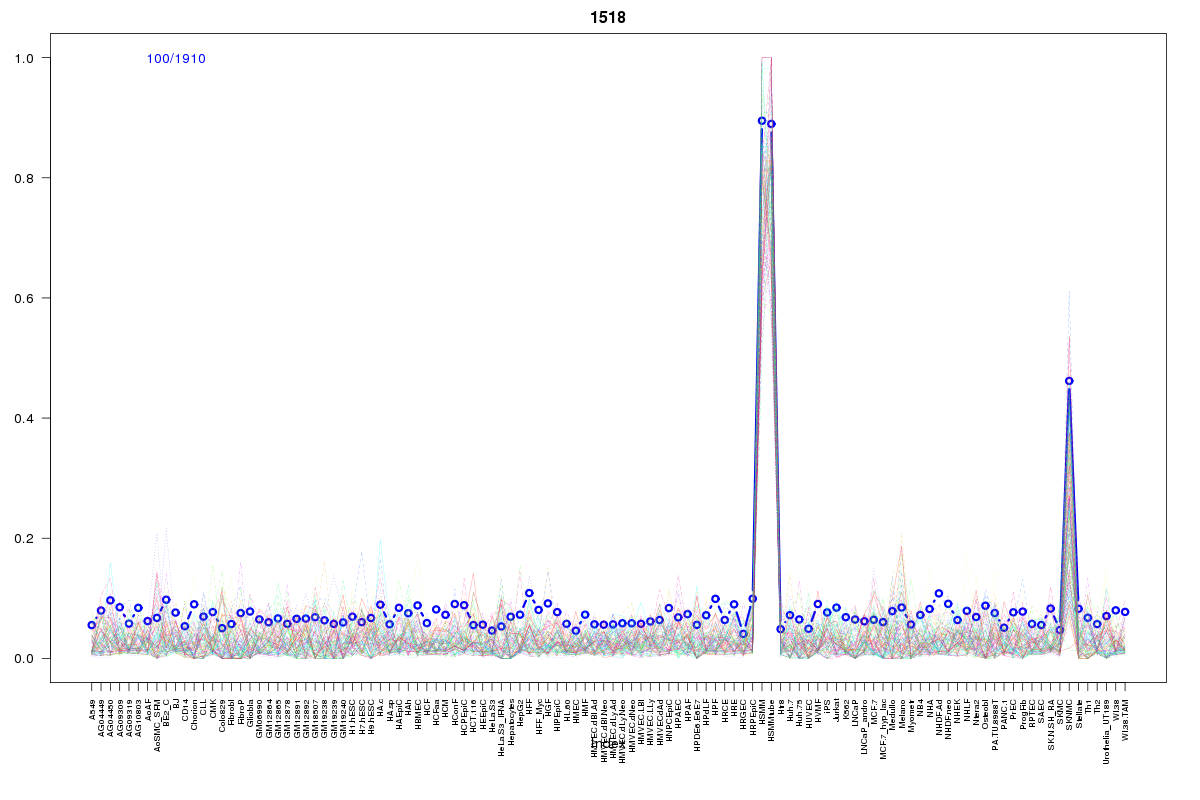 | 1518 | 2 |
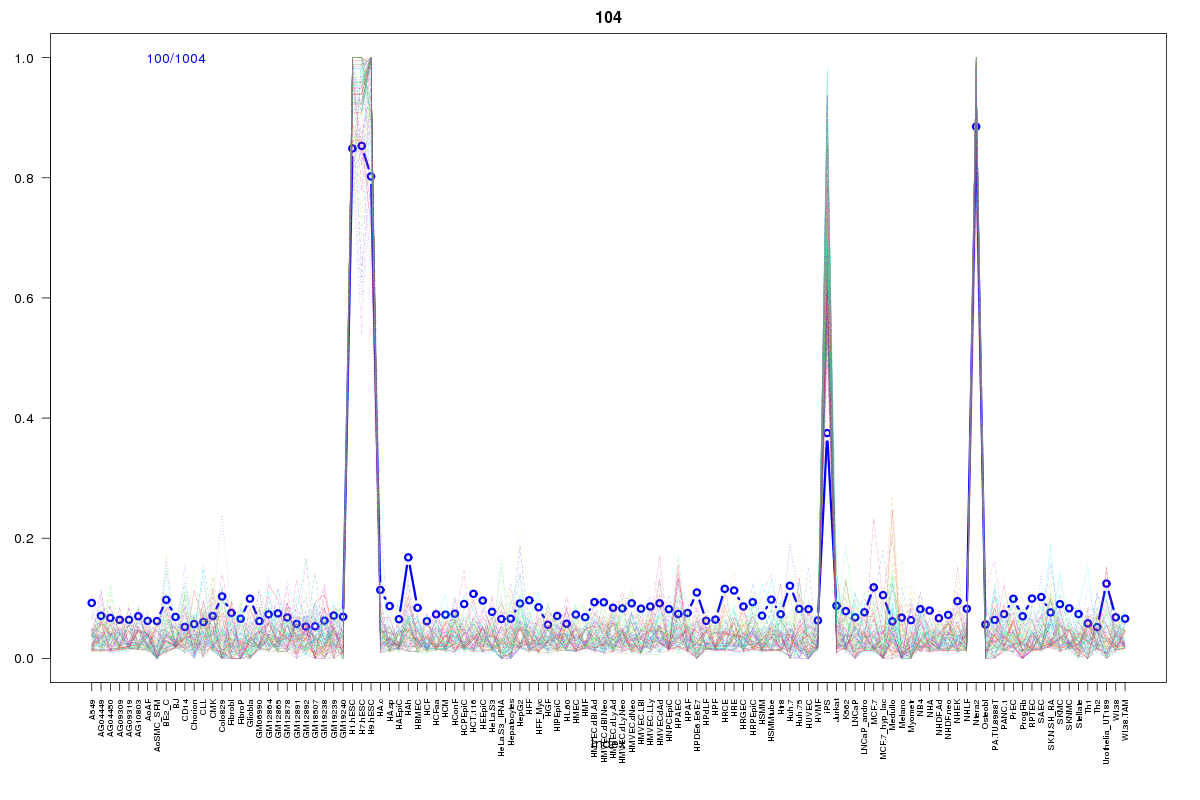 | 104 | 2 |
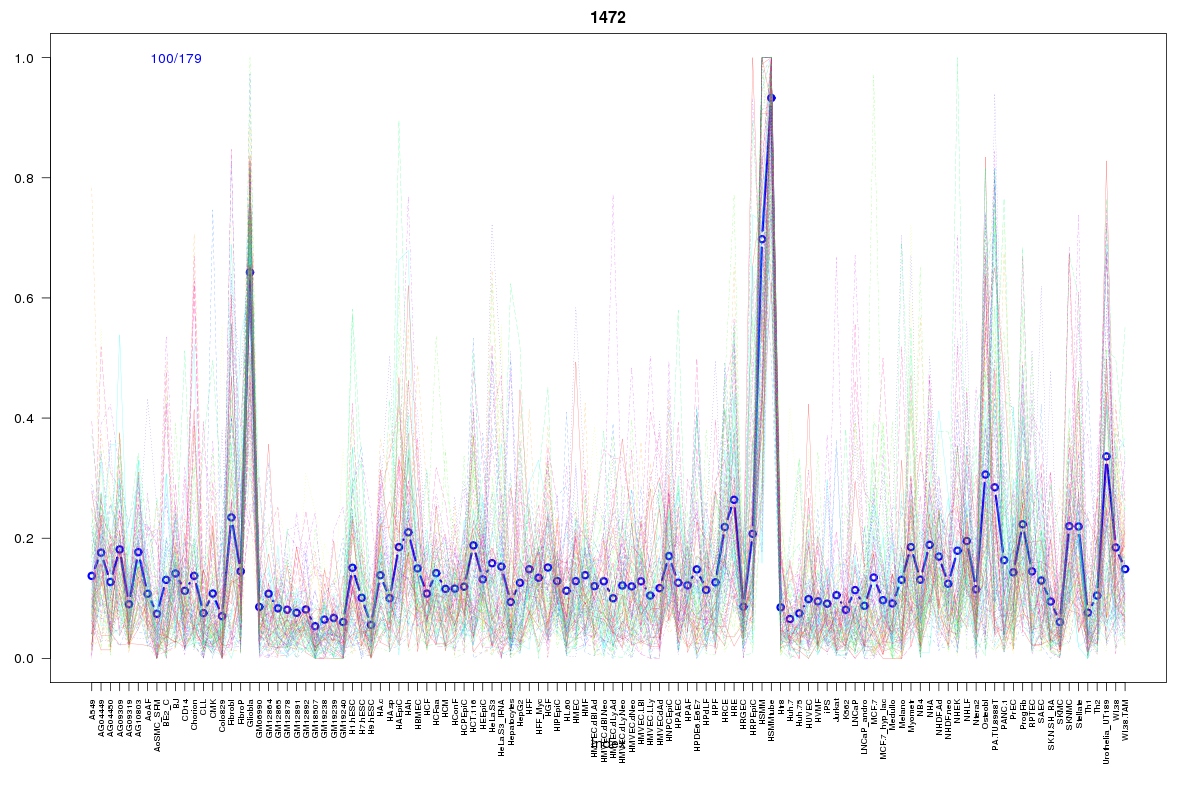 | 1472 | 1 |
 | 2107 | 1 |
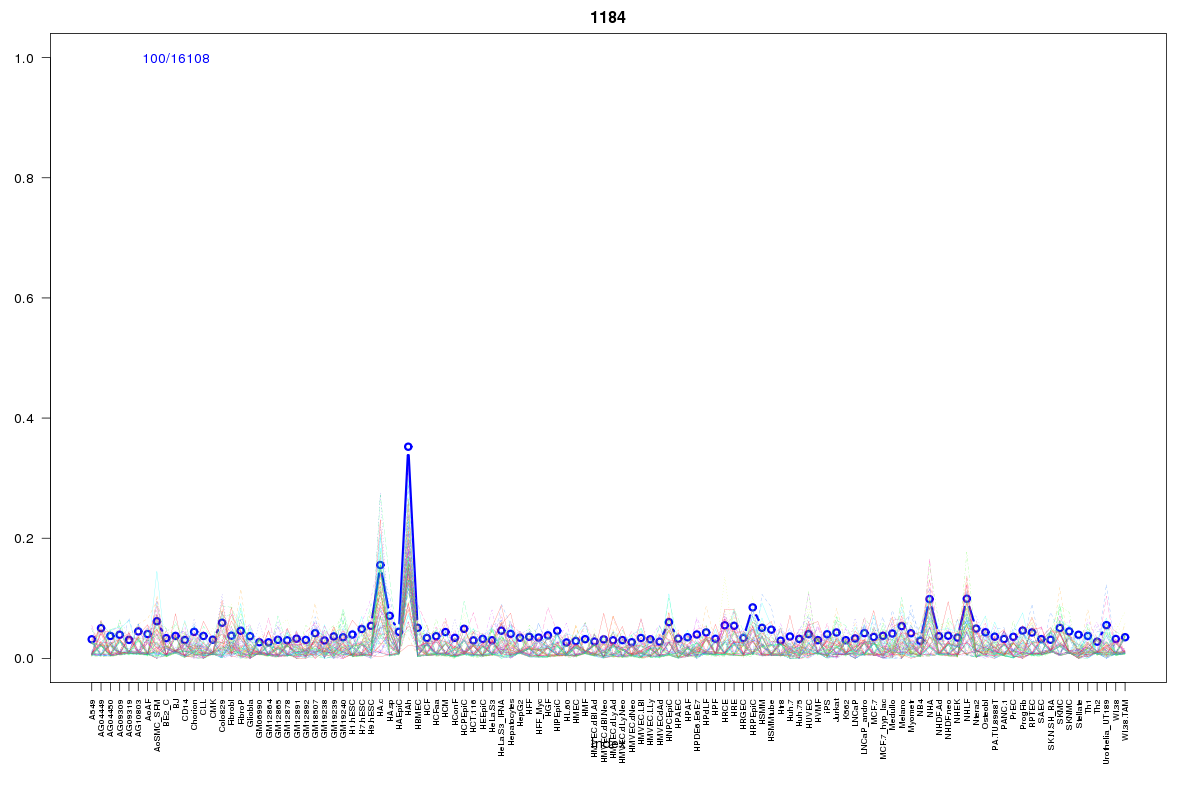 | 1184 | 1 |
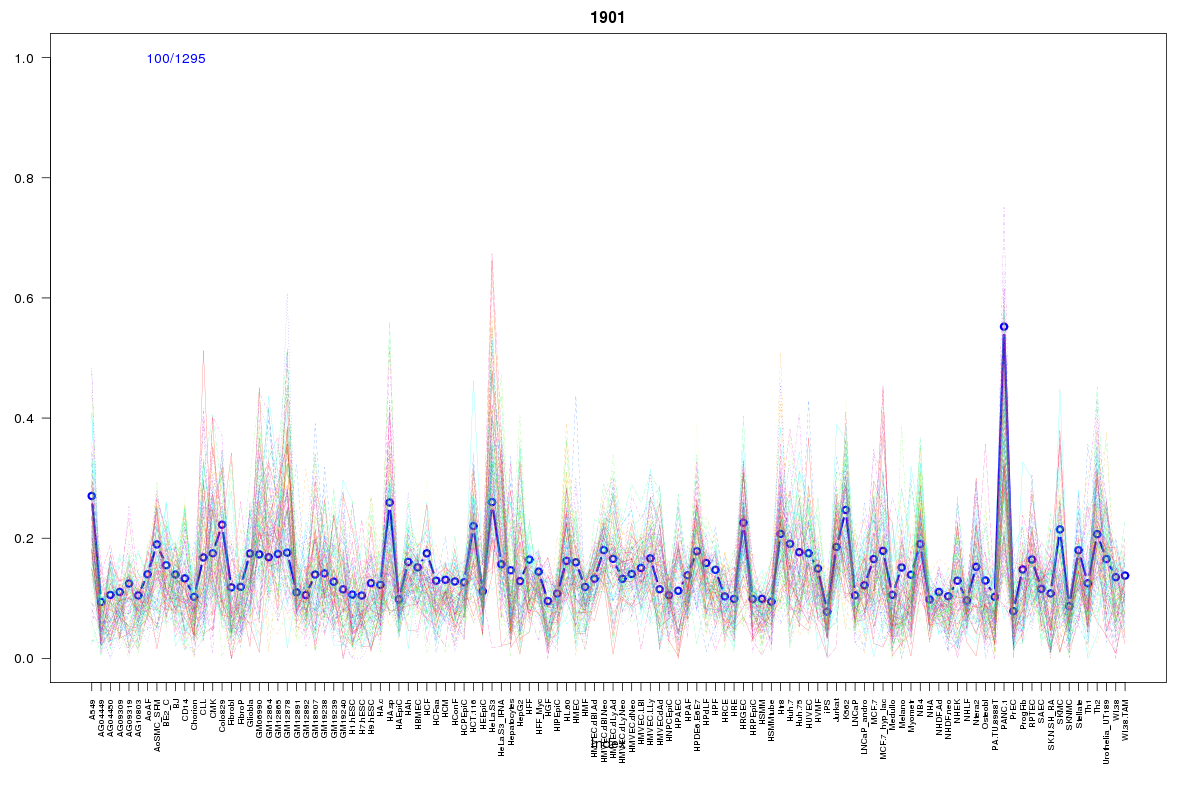 | 1901 | 1 |
 | 1056 | 1 |
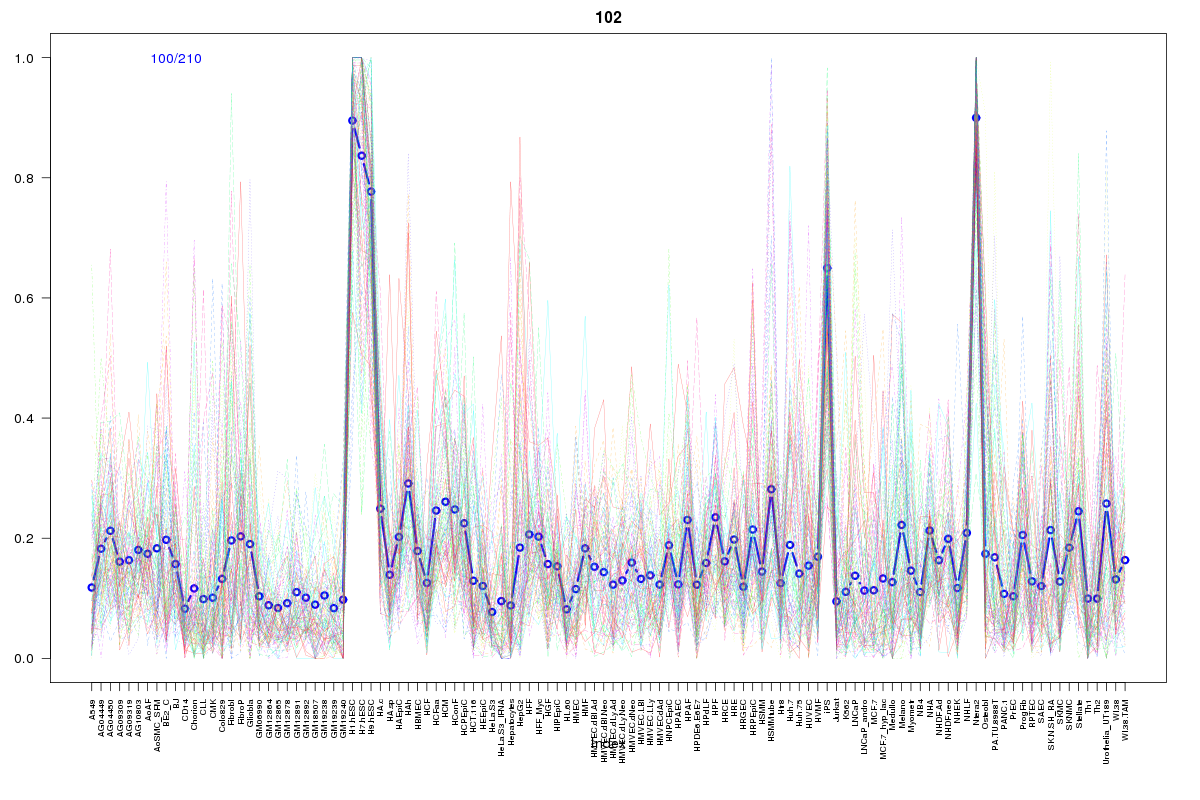 | 102 | 1 |
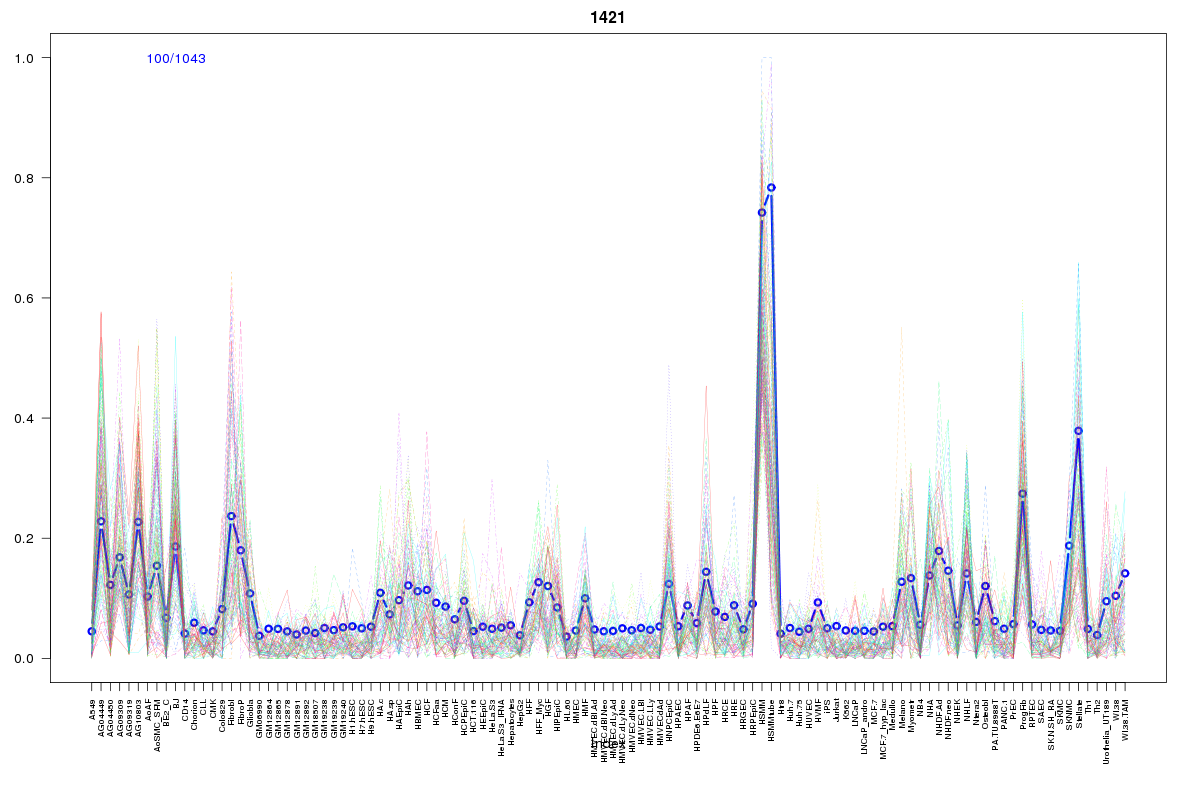 | 1421 | 1 |
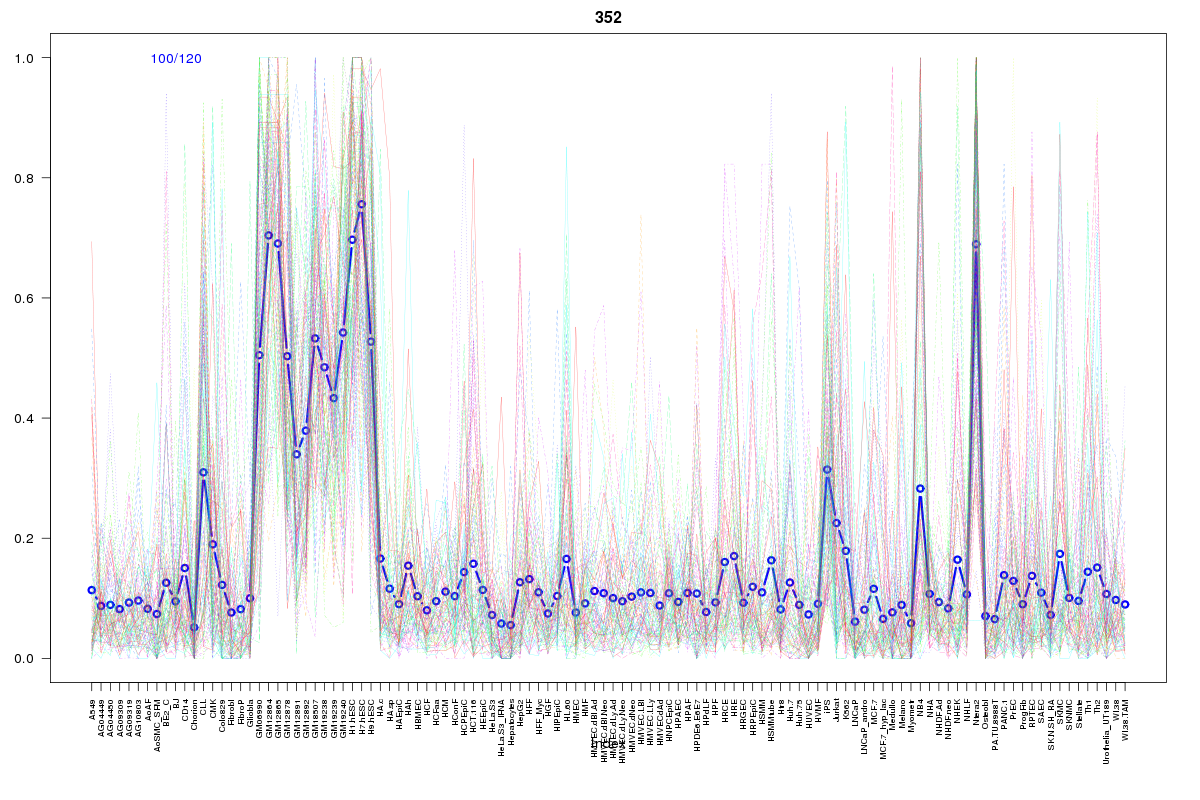 | 352 | 1 |
 | 1605 | 1 |
 | 103 | 1 |
 | 2211 | 1 |
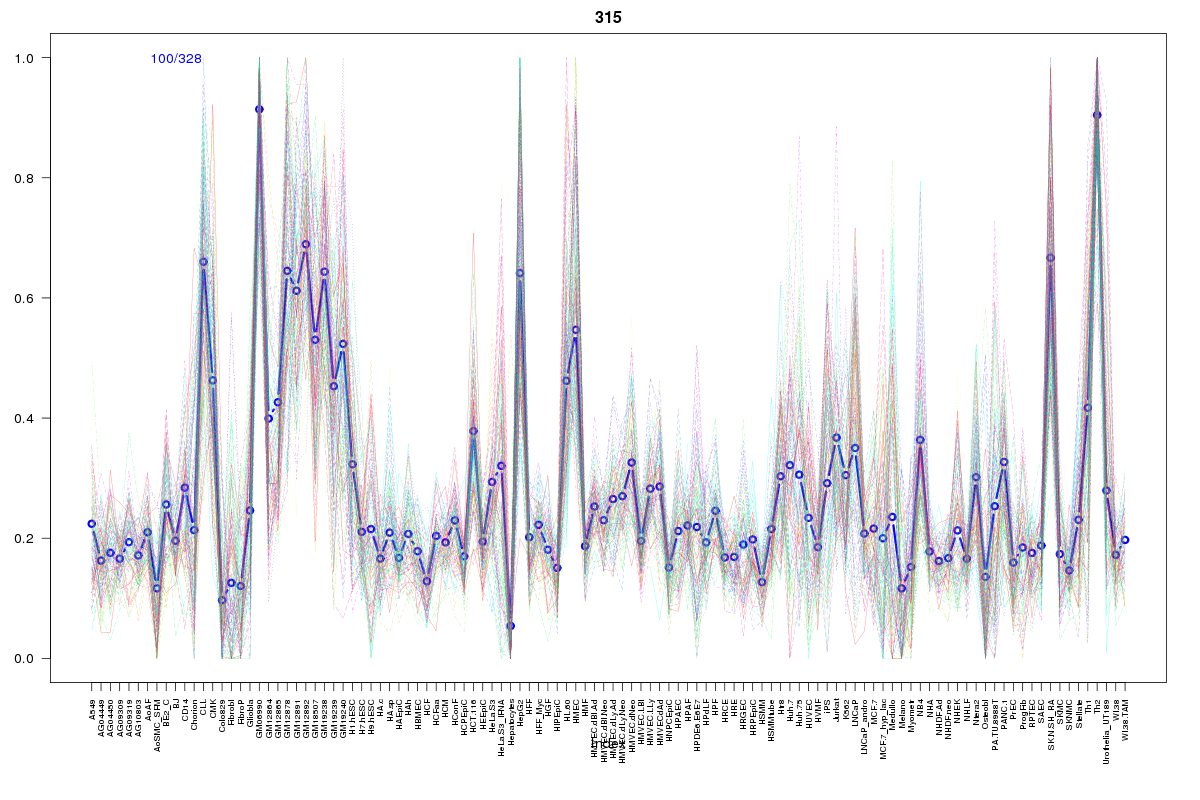 | 315 | 1 |
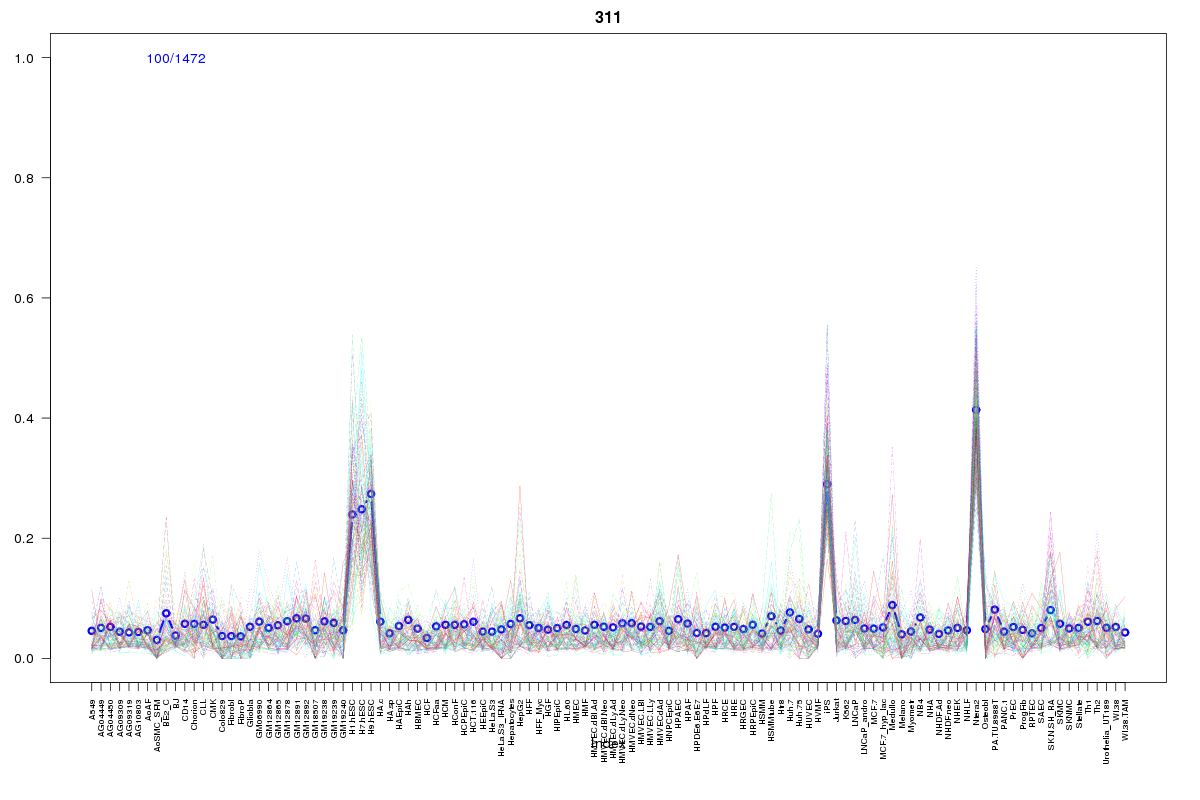 | 311 | 1 |
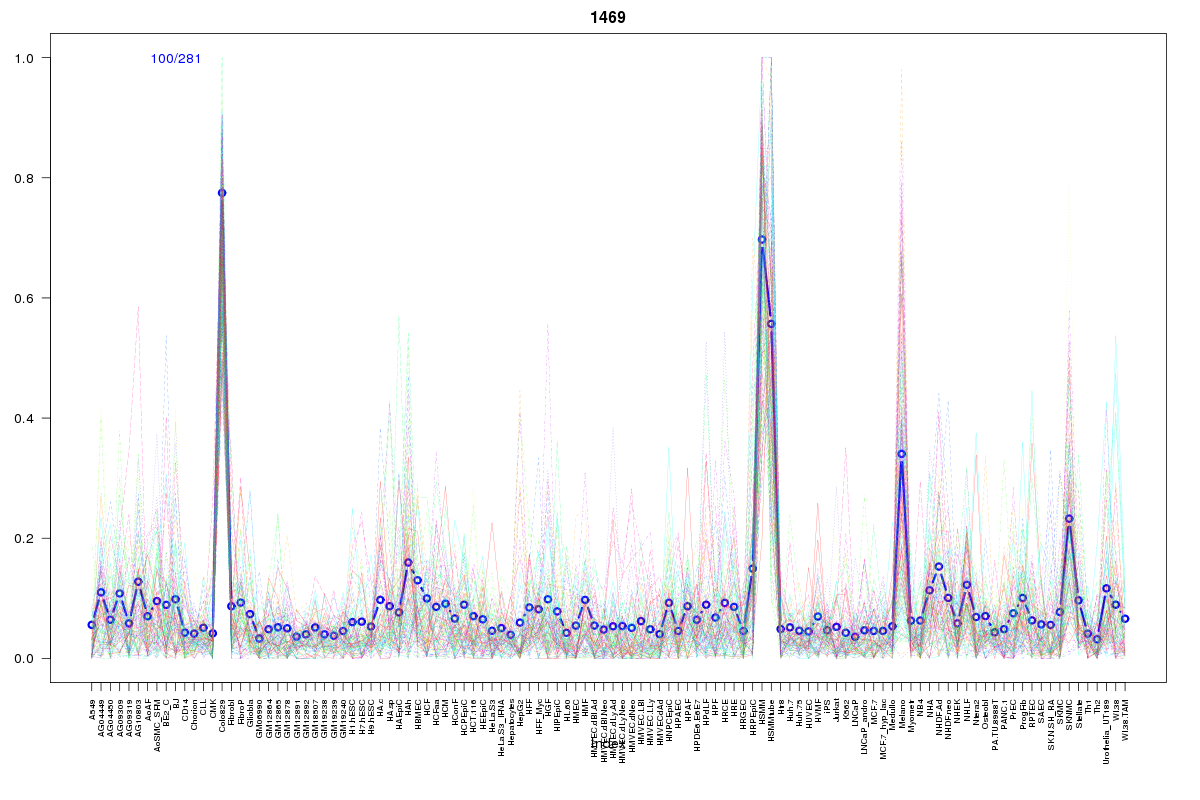 | 1469 | 1 |
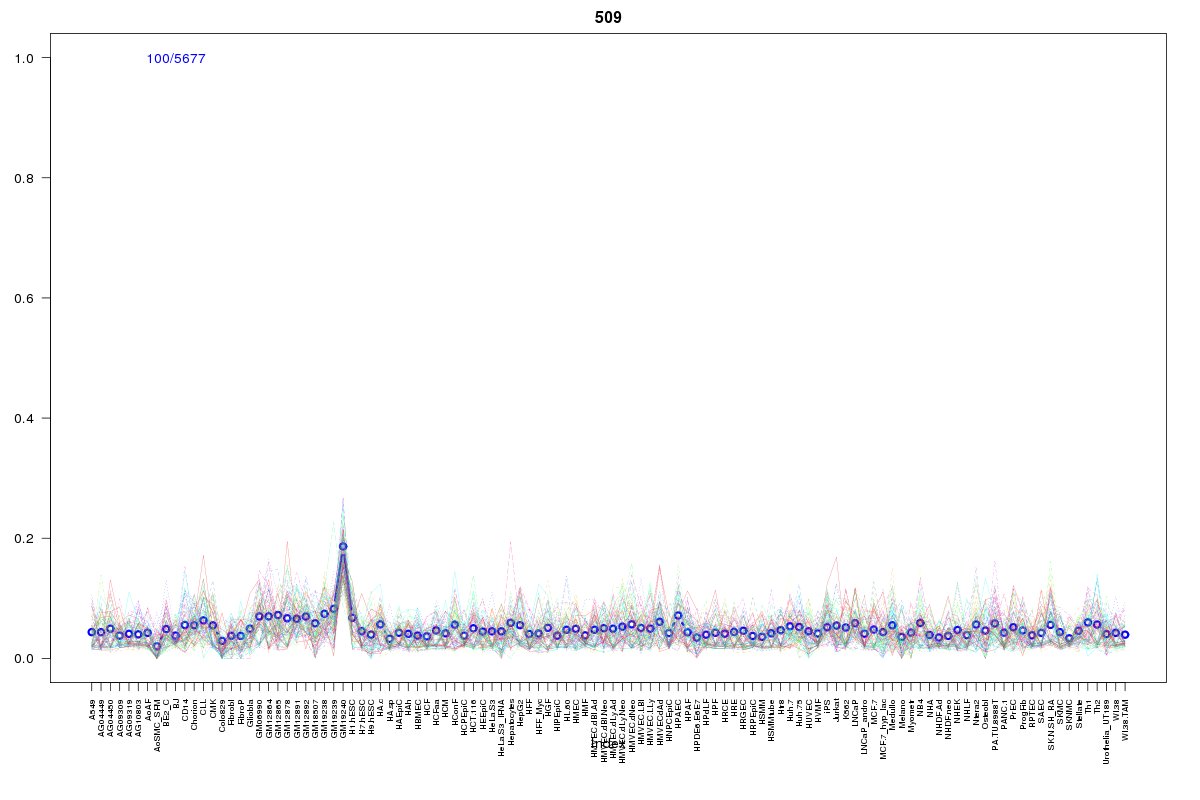 | 509 | 1 |
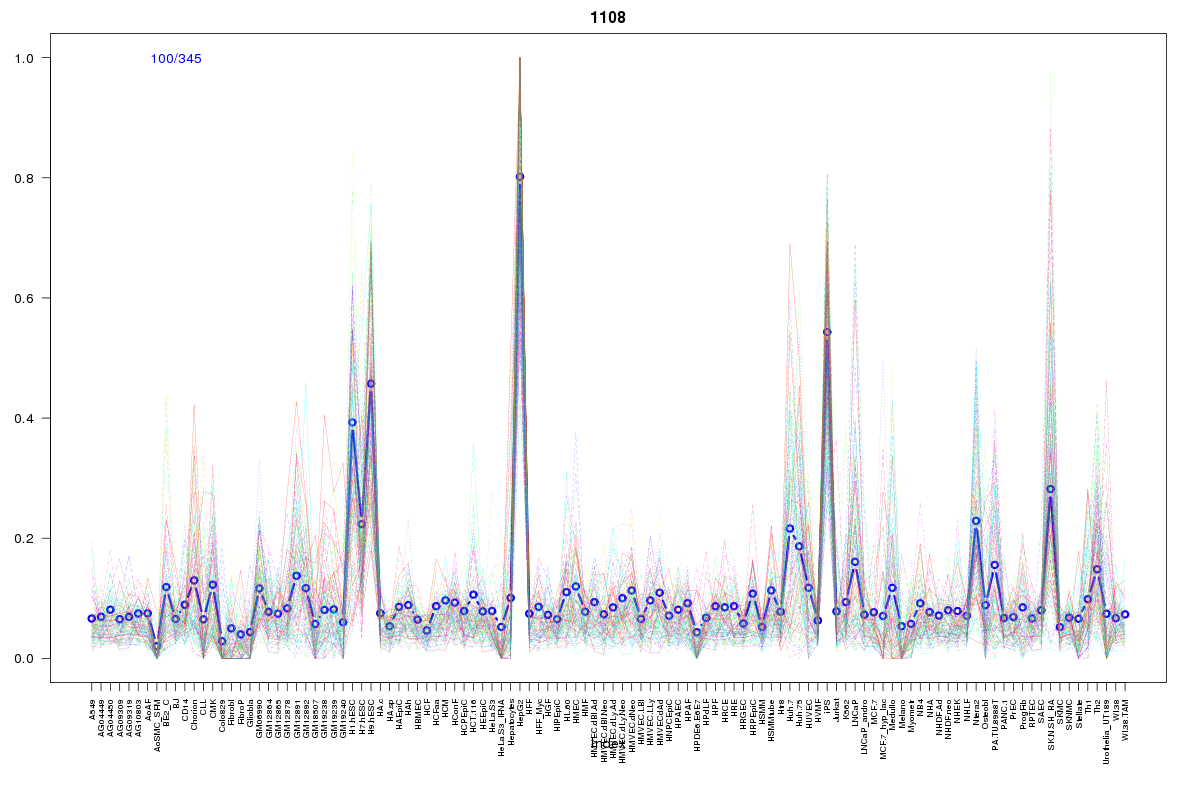 | 1108 | 1 |
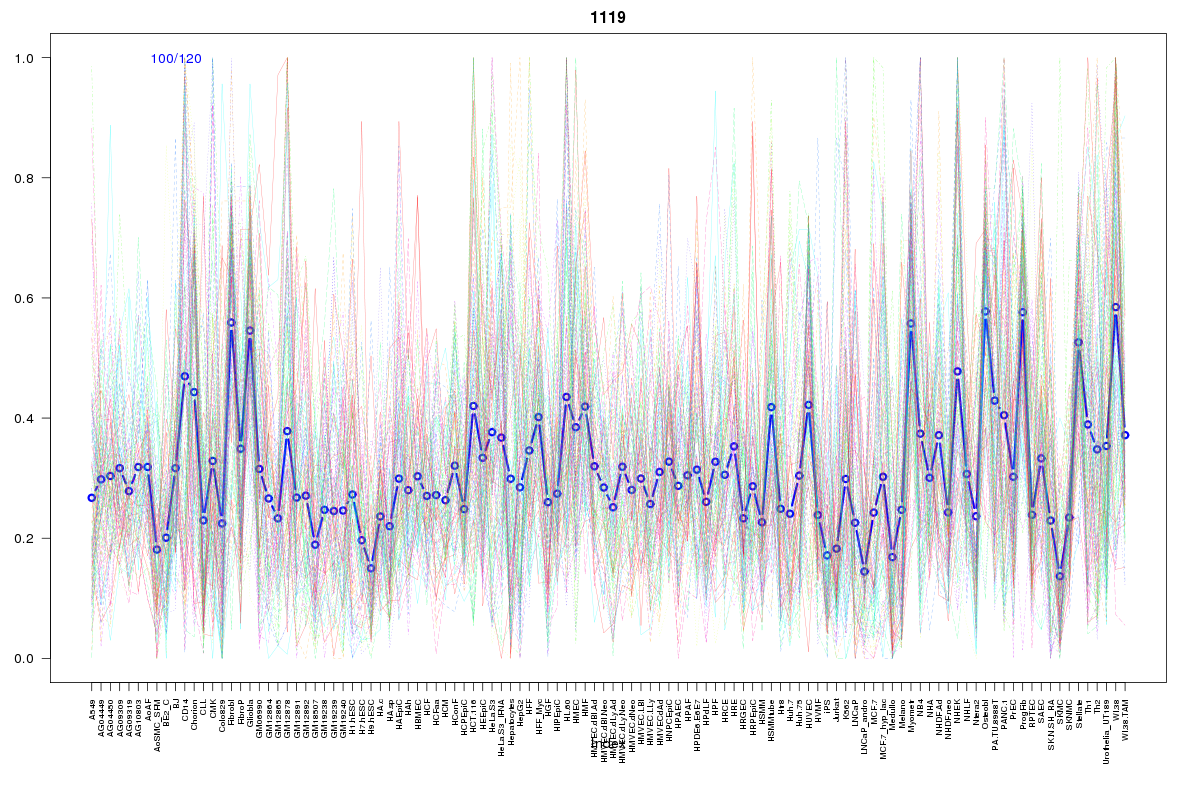 | 1119 | 1 |
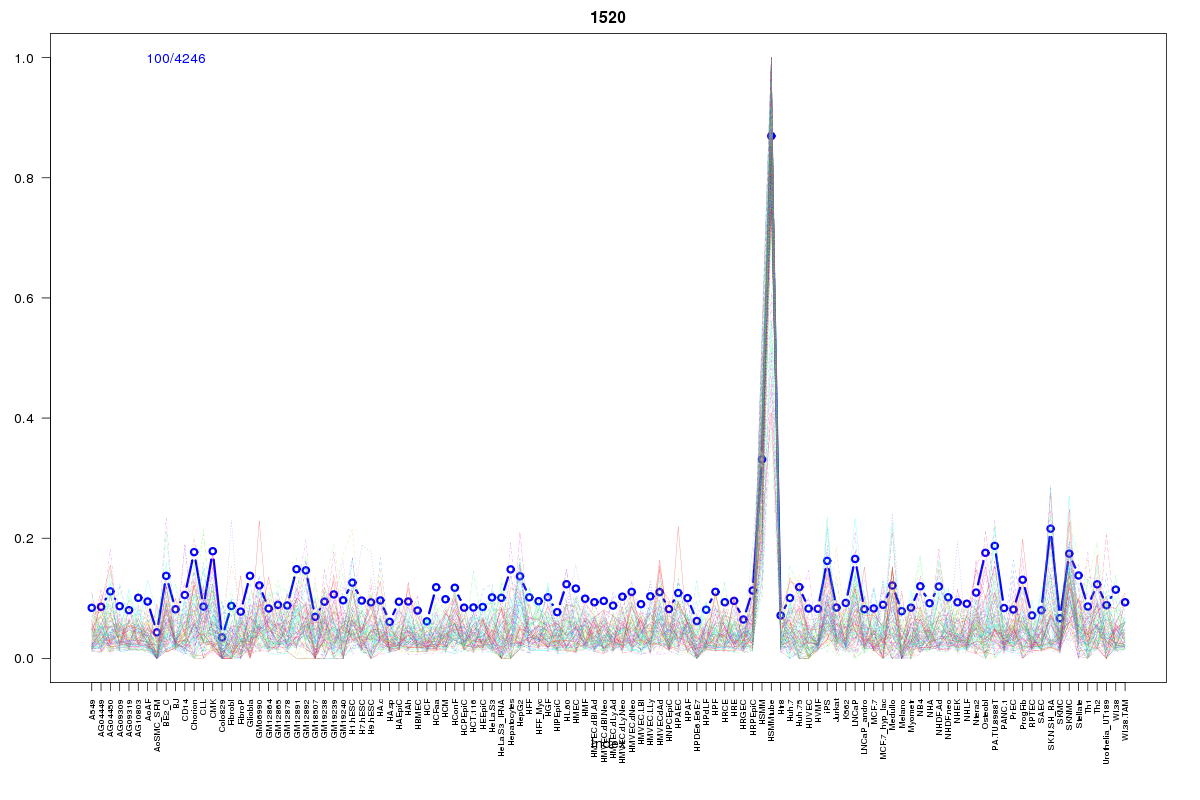 | 1520 | 1 |
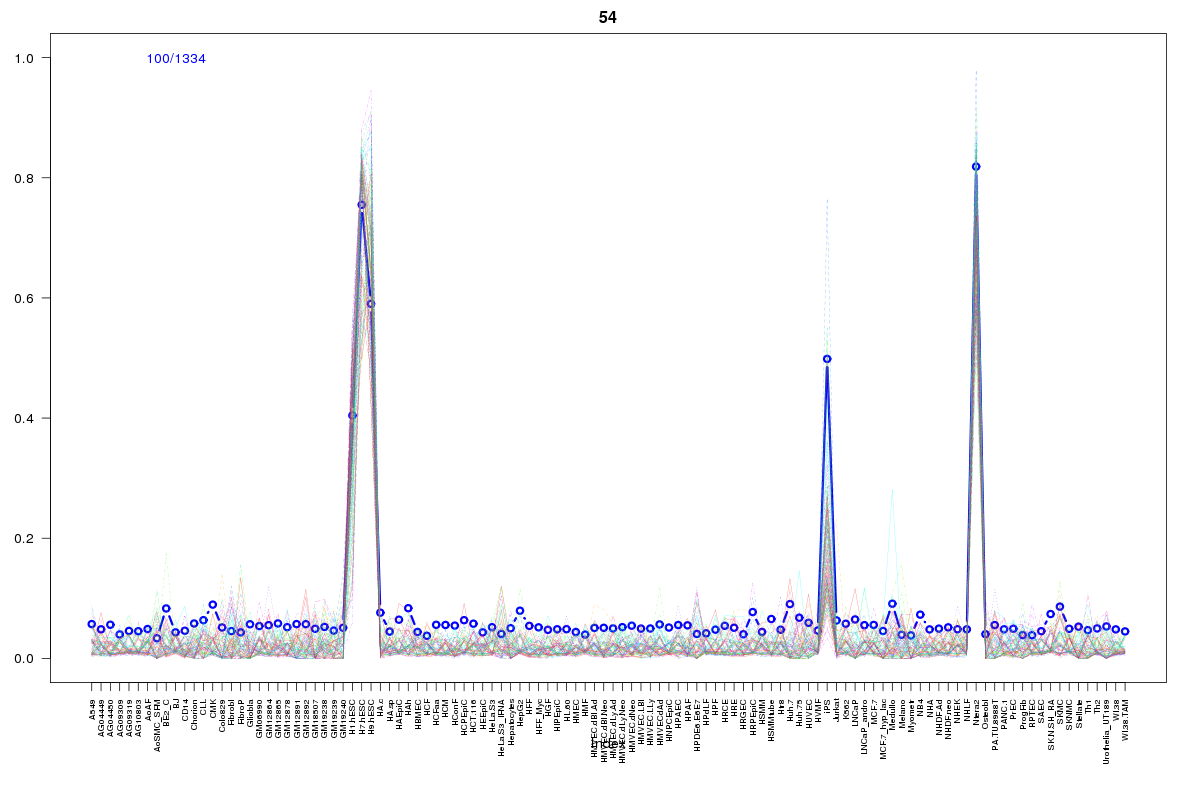 | 54 | 1 |
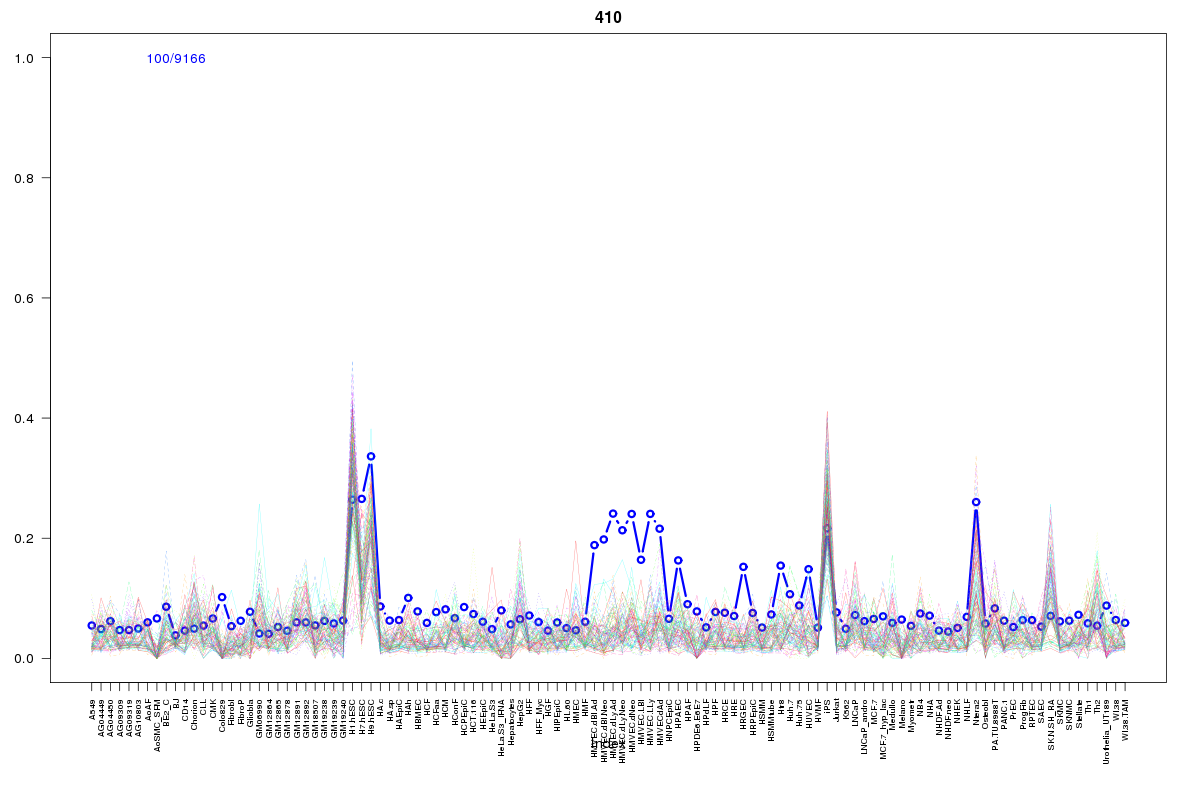 | 410 | 1 |
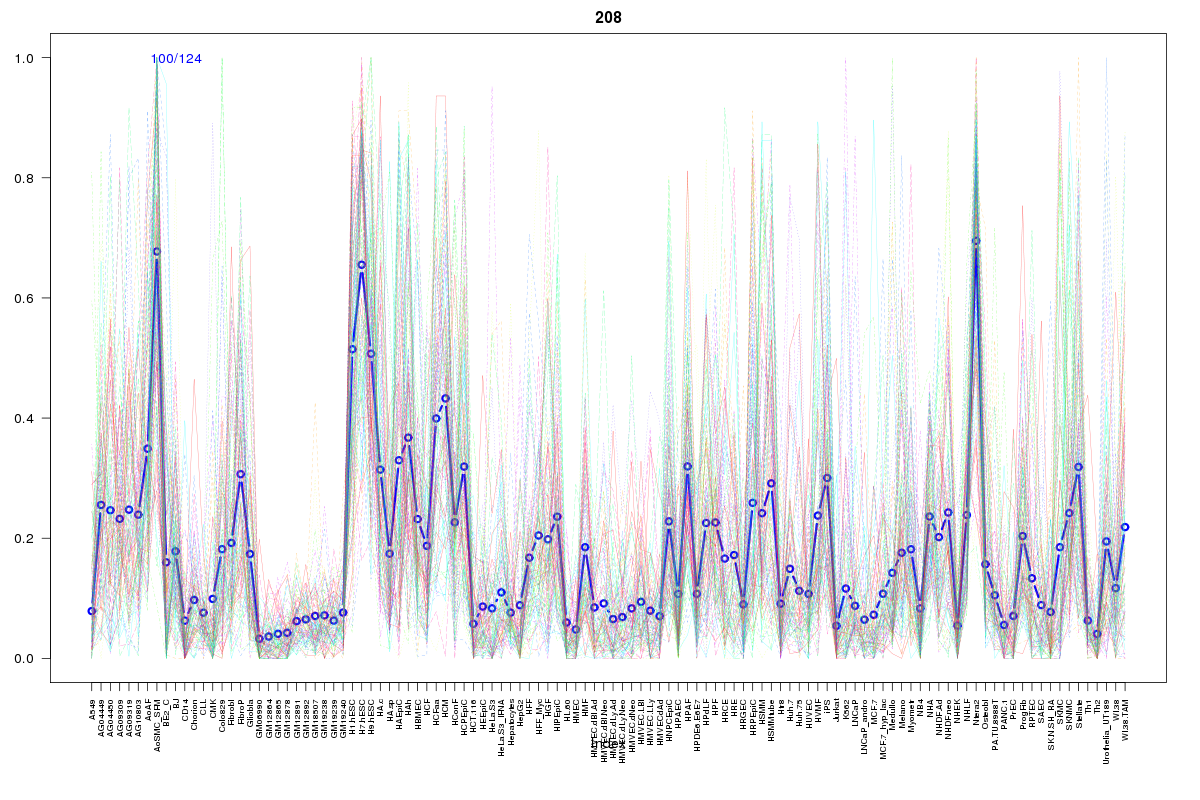 | 208 | 1 |
Resources
BED file downloads
Connects to 35 DHS sitesTop 10 Correlated DHS Sites
p-values indiciate significant higher or lower correlation| Location | Cluster | P-value |
|---|---|---|
| chr1:160085400-160085550 | 54 | 0.001 |
| chr1:160091280-160091430 | 1569 | 0.001 |
| chr1:160107420-160107570 | 1184 | 0.001 |
| chr1:160126280-160126430 | 1518 | 0.001 |
| chr1:160127960-160128110 | 1518 | 0.001 |
| chr1:160046200-160046350 | 1421 | 0.001 |
| chr1:160132200-160132350 | 102 | 0.001 |
| chr1:160139400-160139550 | 352 | 0.003 |
| chr1:160132400-160132550 | 1569 | 0.005 |
| chr1:160177640-160177790 | 1520 | 0.007 |
| chr1:160196580-160196730 | 15 | 0.01 |
External Databases
UCSCEnsembl (ENSG00000018625)