Gene: TMEM9
chr1: 201103899-201140702Expression Profile
(log scale)
Graphical Connections
Distribution of linked clusters:
You may find it interesting if many of the connected DHS sites belong to the same cluster.| Cluster Profile | Cluster ID | Number of DHS sites in this cluster |
|---|---|---|
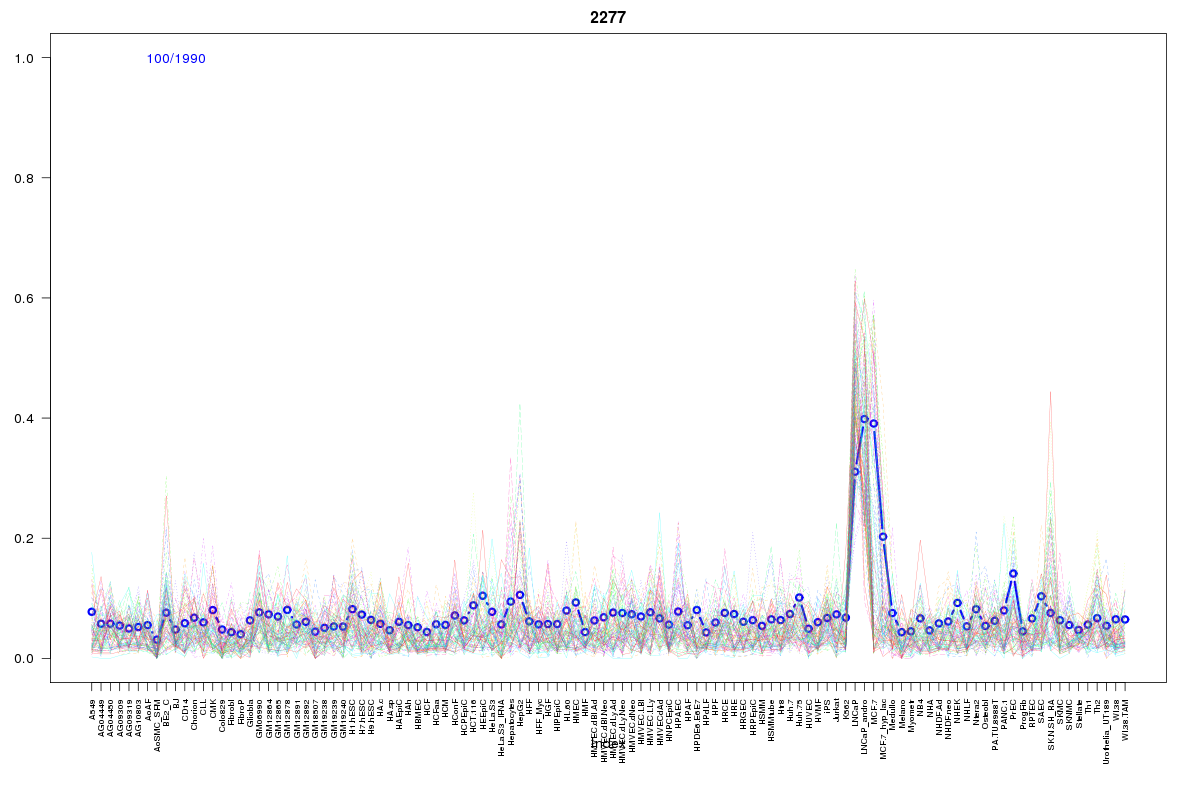 | 2277 | 3 |
 | 655 | 2 |
 | 416 | 2 |
 | 1605 | 2 |
 | 2052 | 1 |
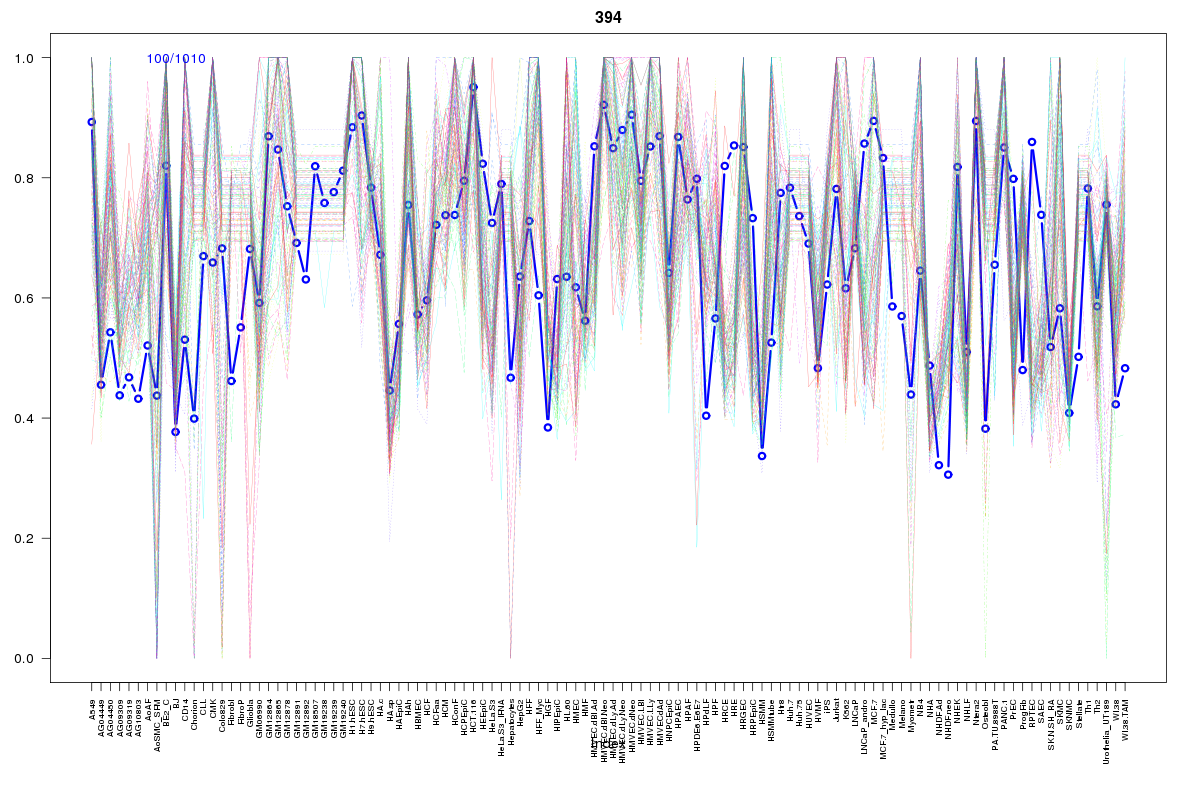 | 394 | 1 |
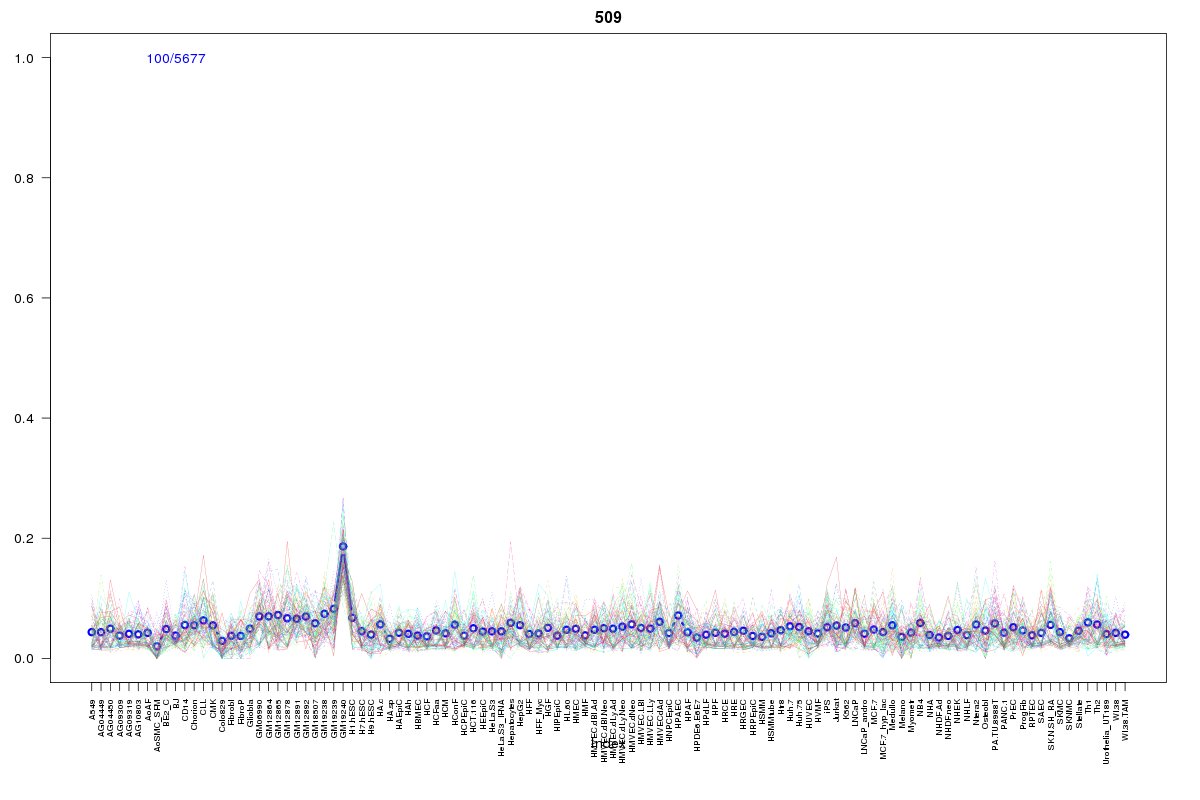 | 509 | 1 |
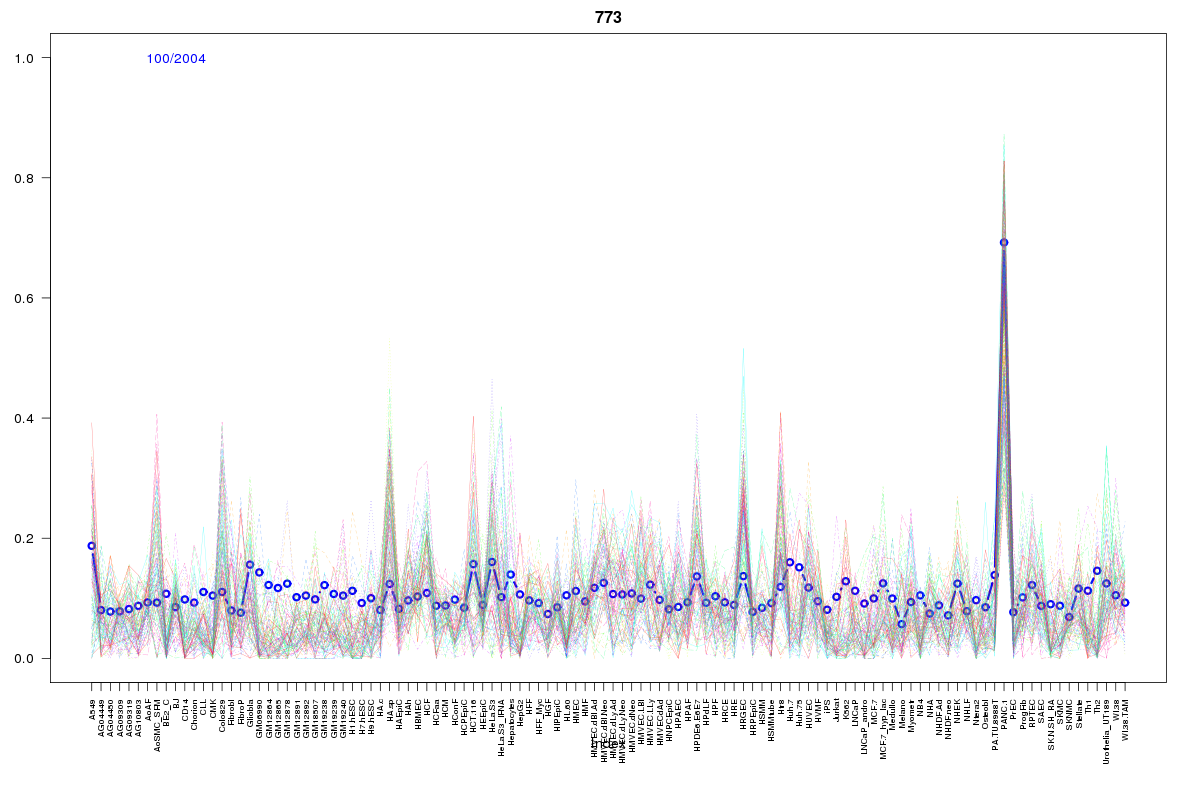 | 773 | 1 |
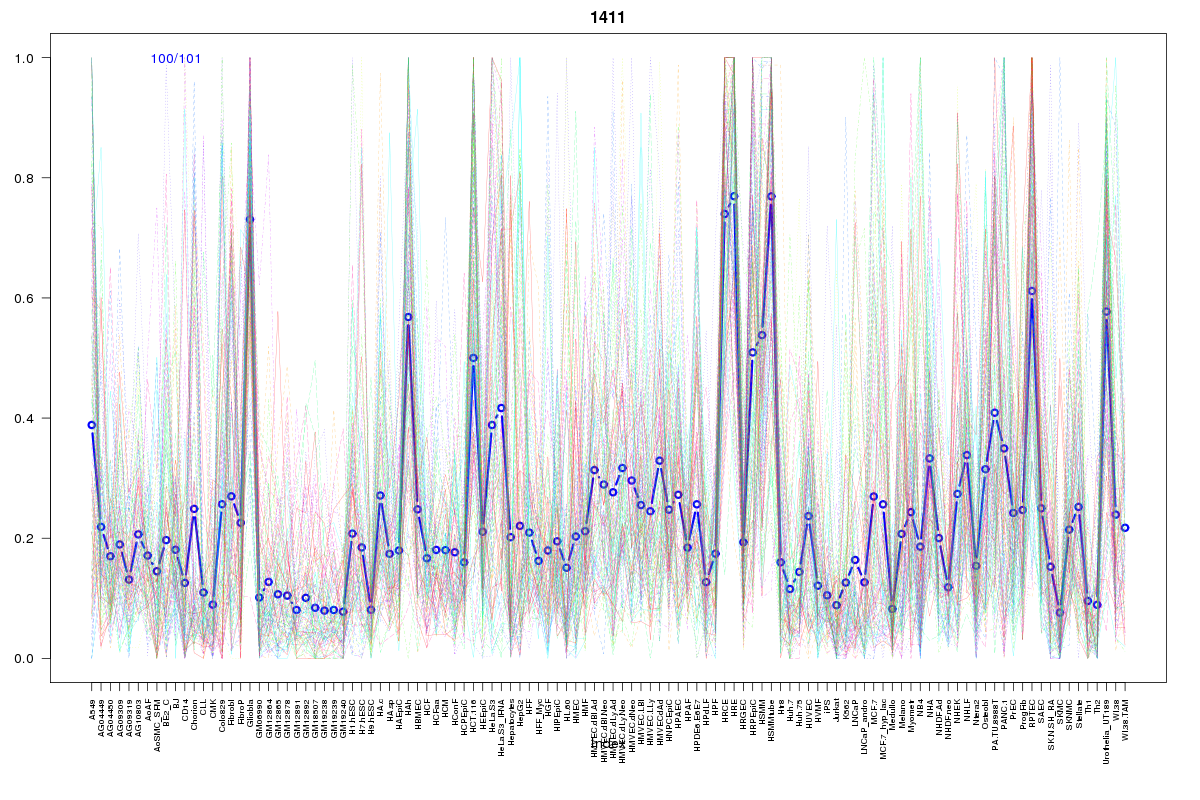 | 1411 | 1 |
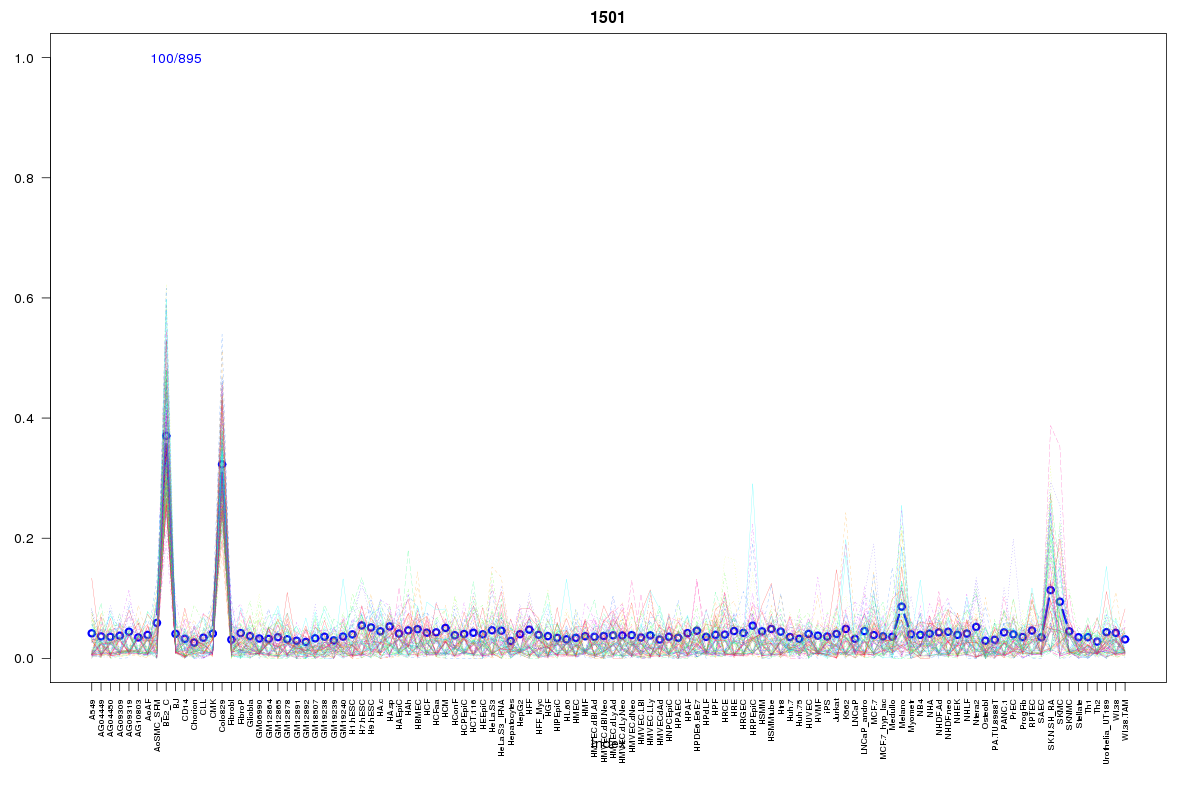 | 1501 | 1 |
 | 2055 | 1 |
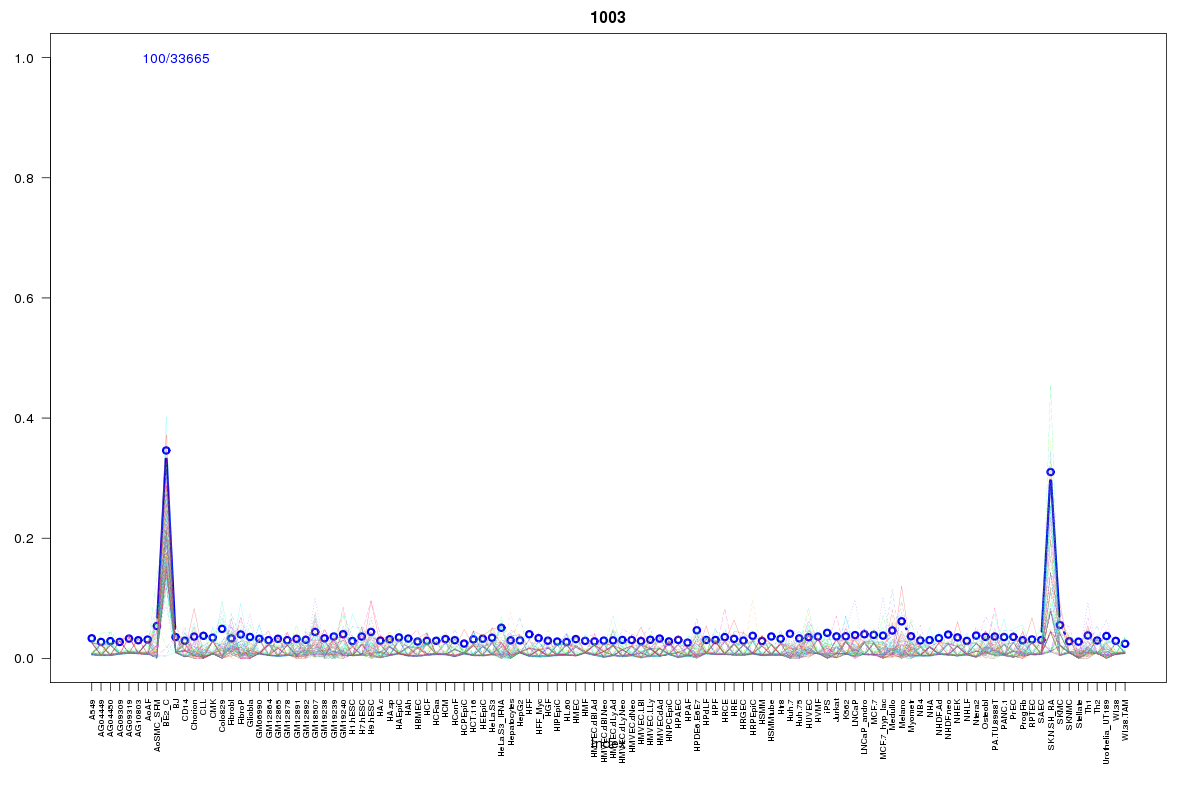 | 1003 | 1 |
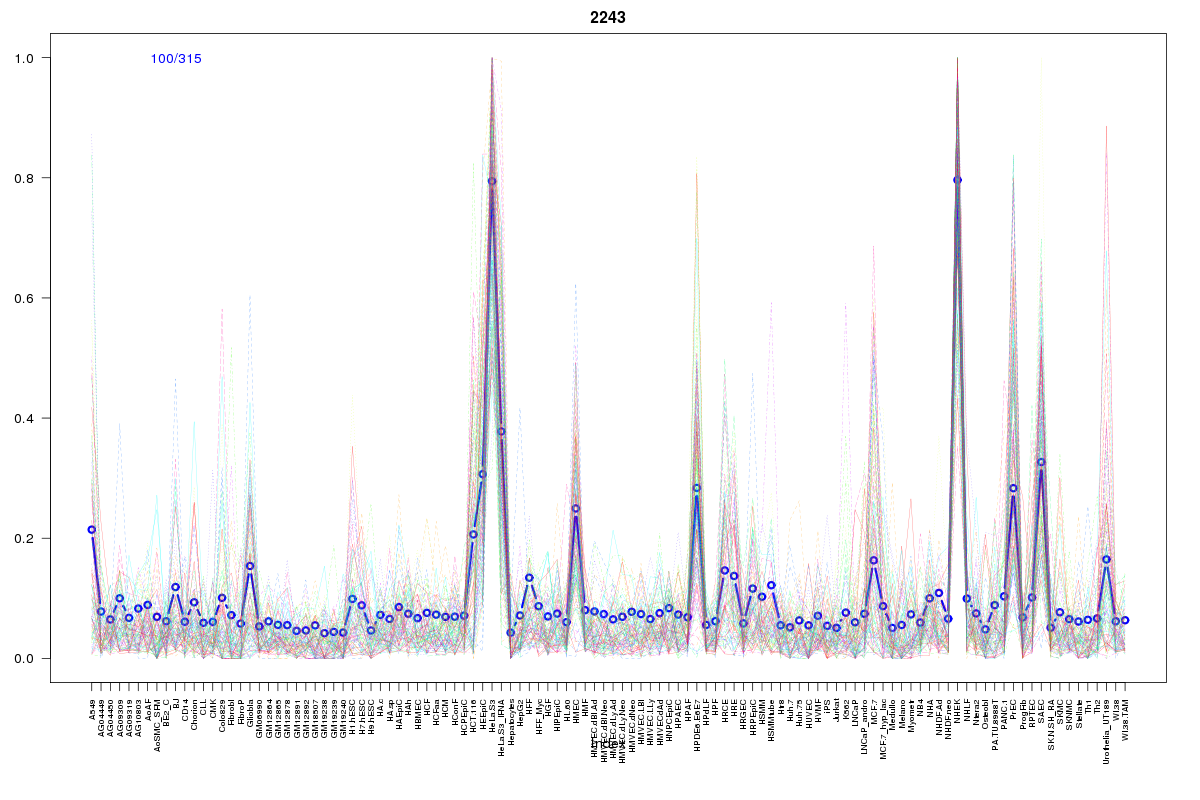 | 2243 | 1 |
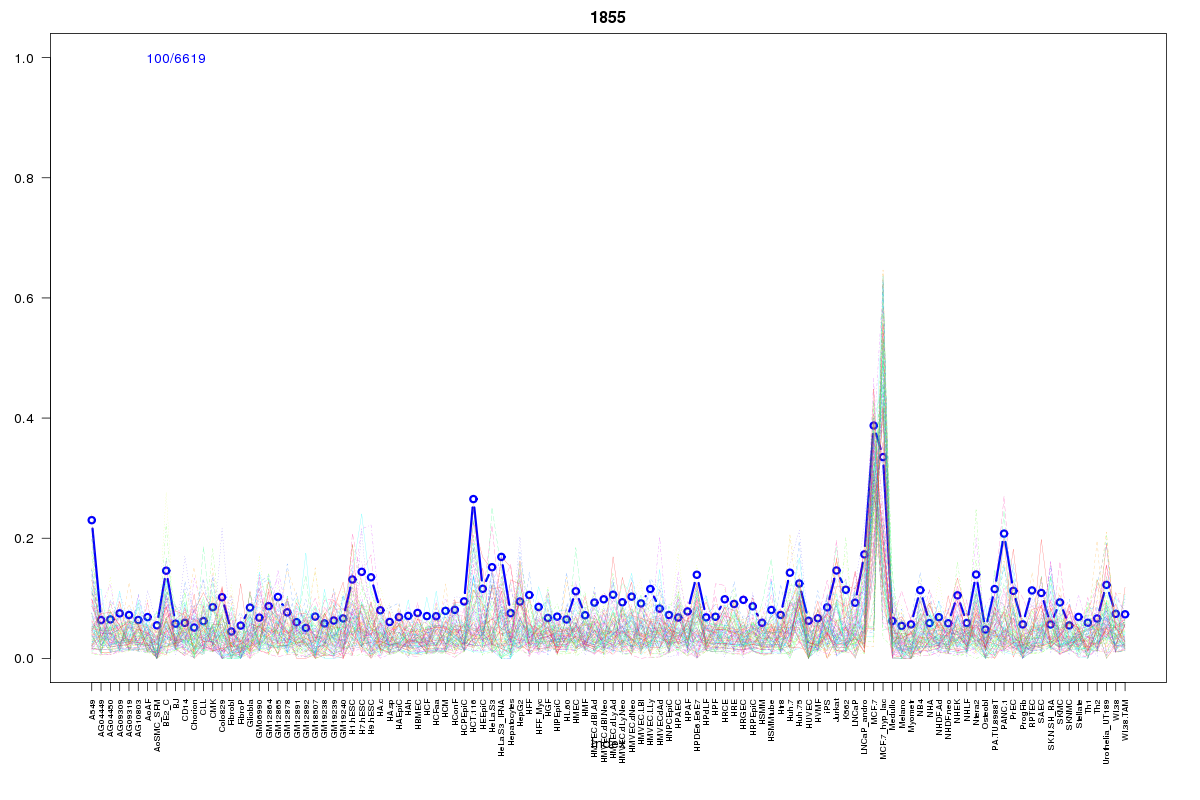 | 1855 | 1 |
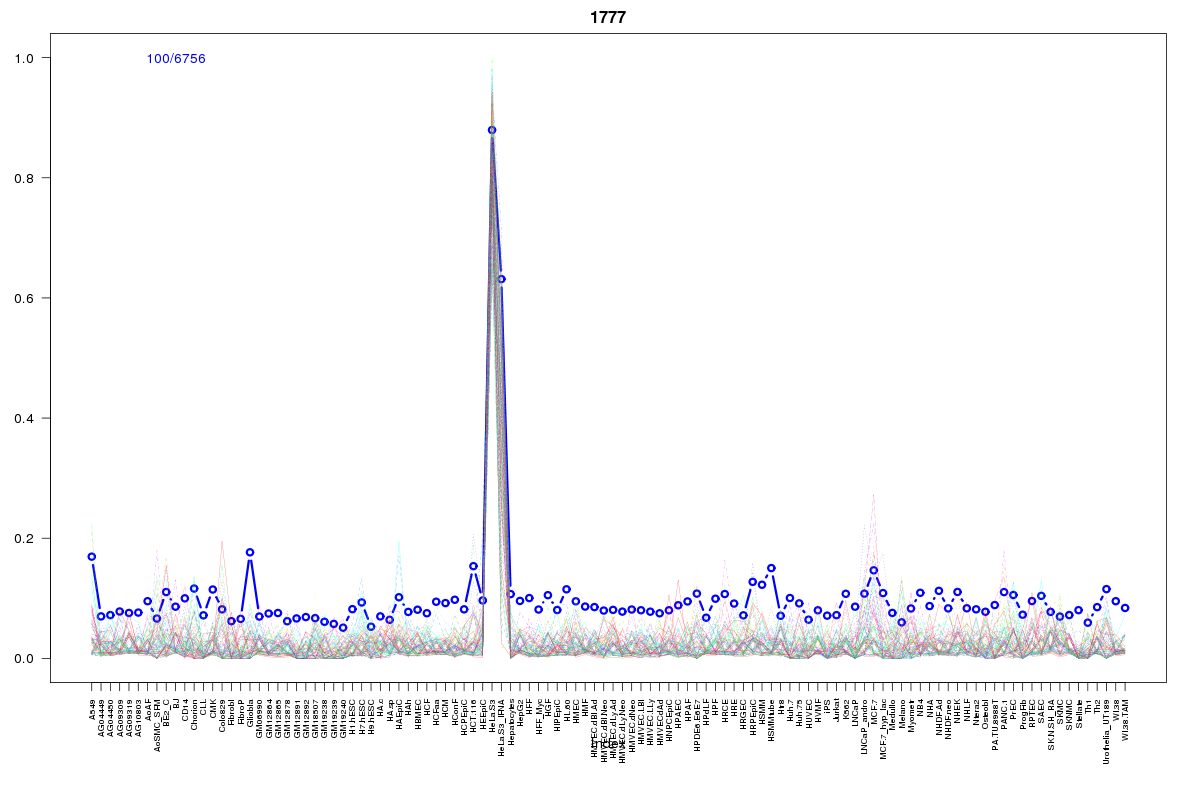 | 1777 | 1 |
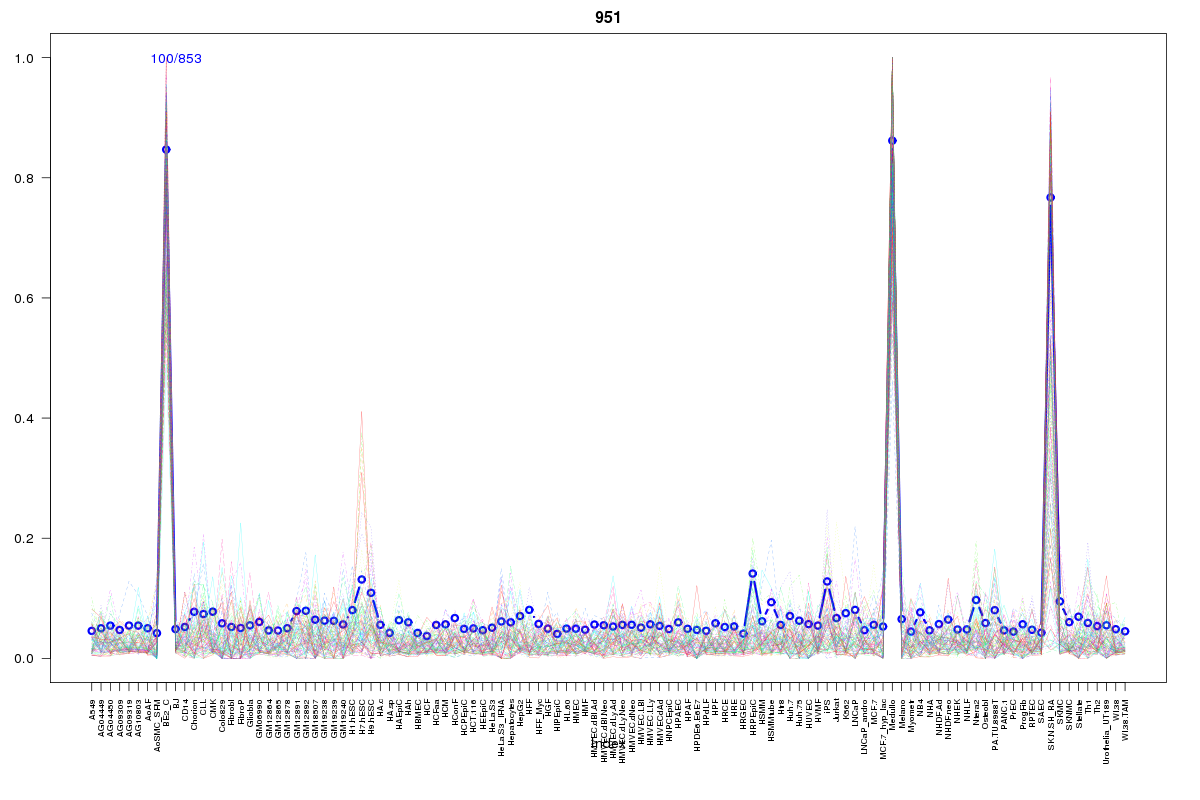 | 951 | 1 |
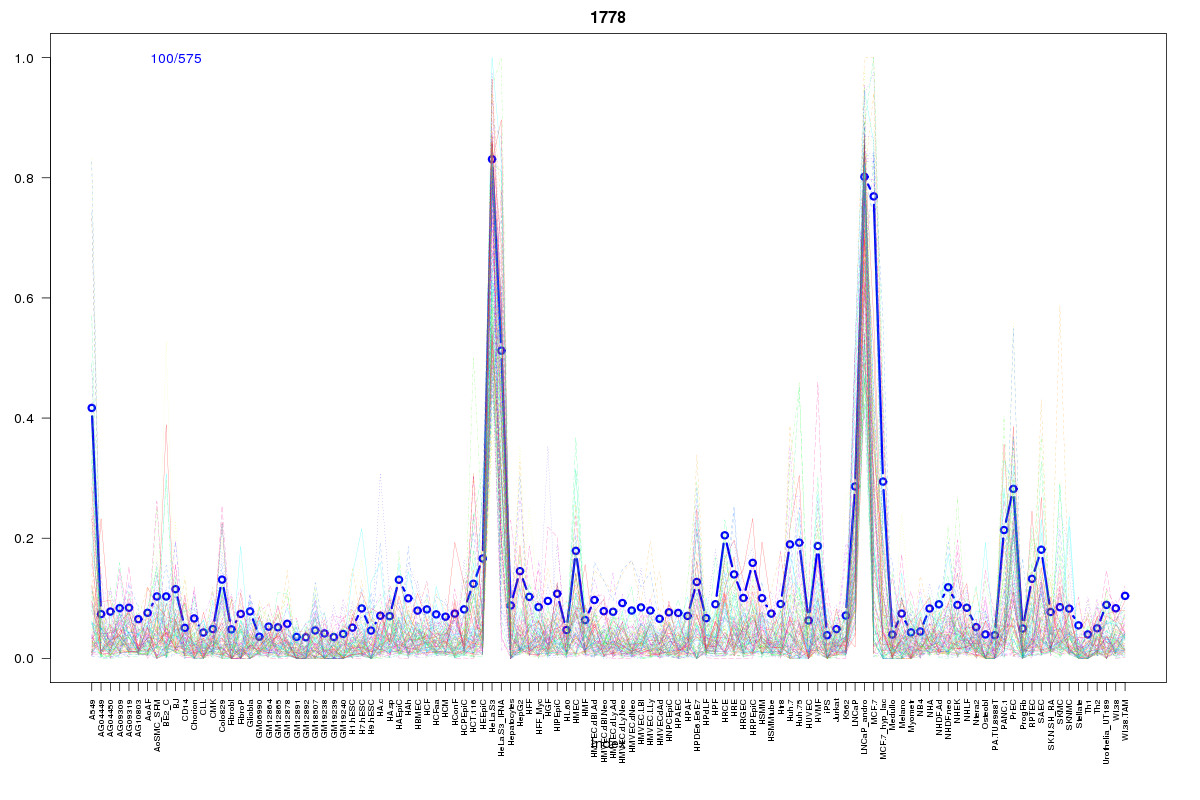 | 1778 | 1 |
 | 800 | 1 |
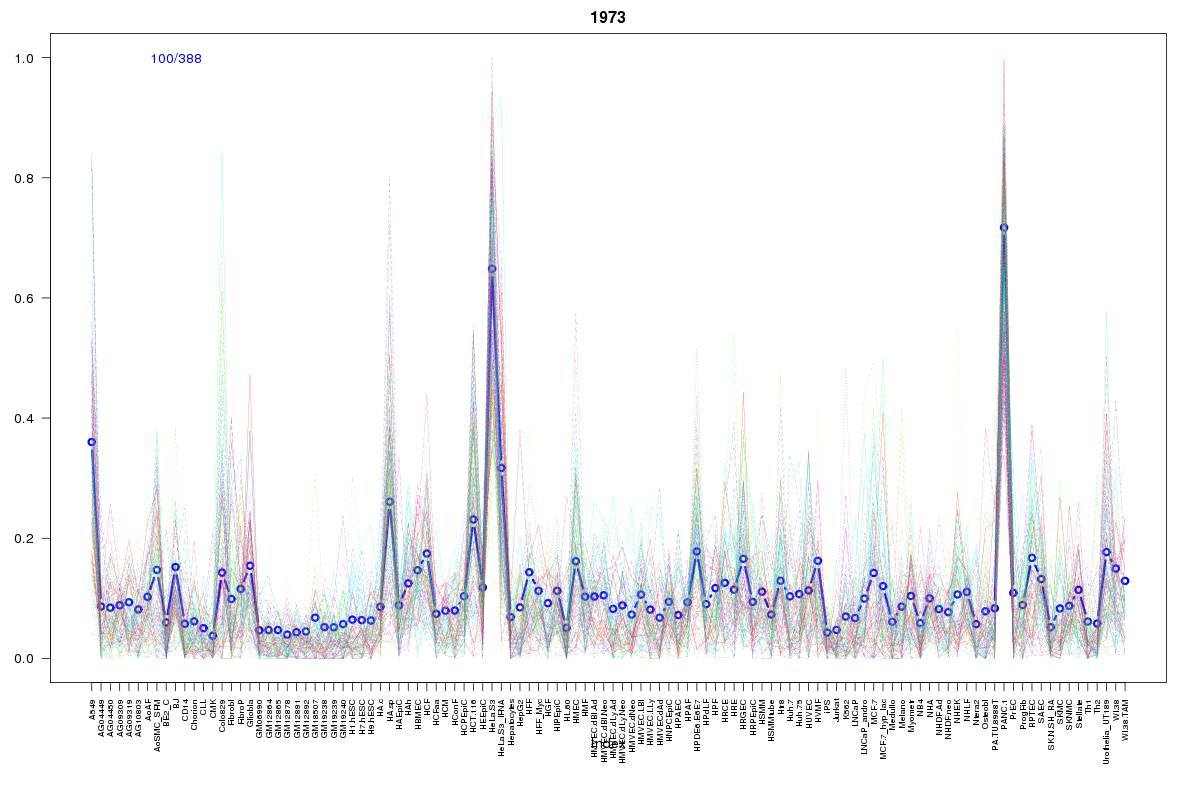 | 1973 | 1 |
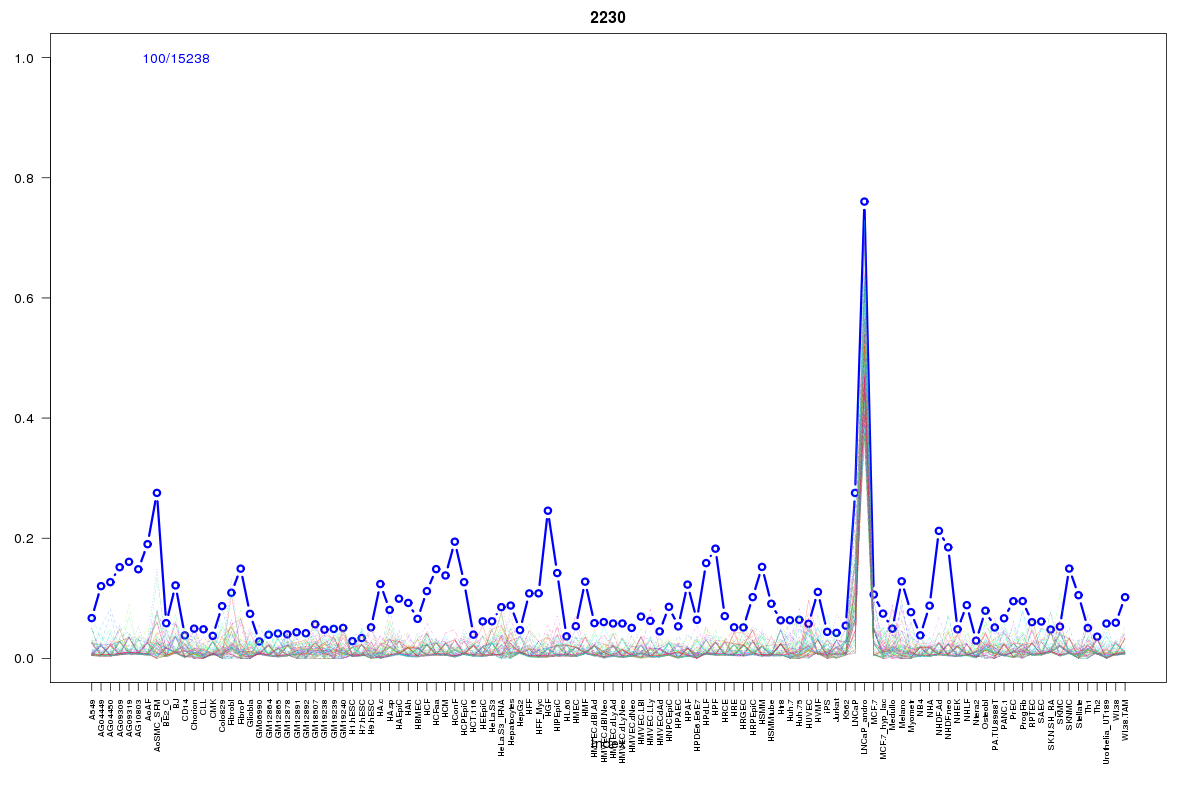 | 2230 | 1 |
 | 1724 | 1 |
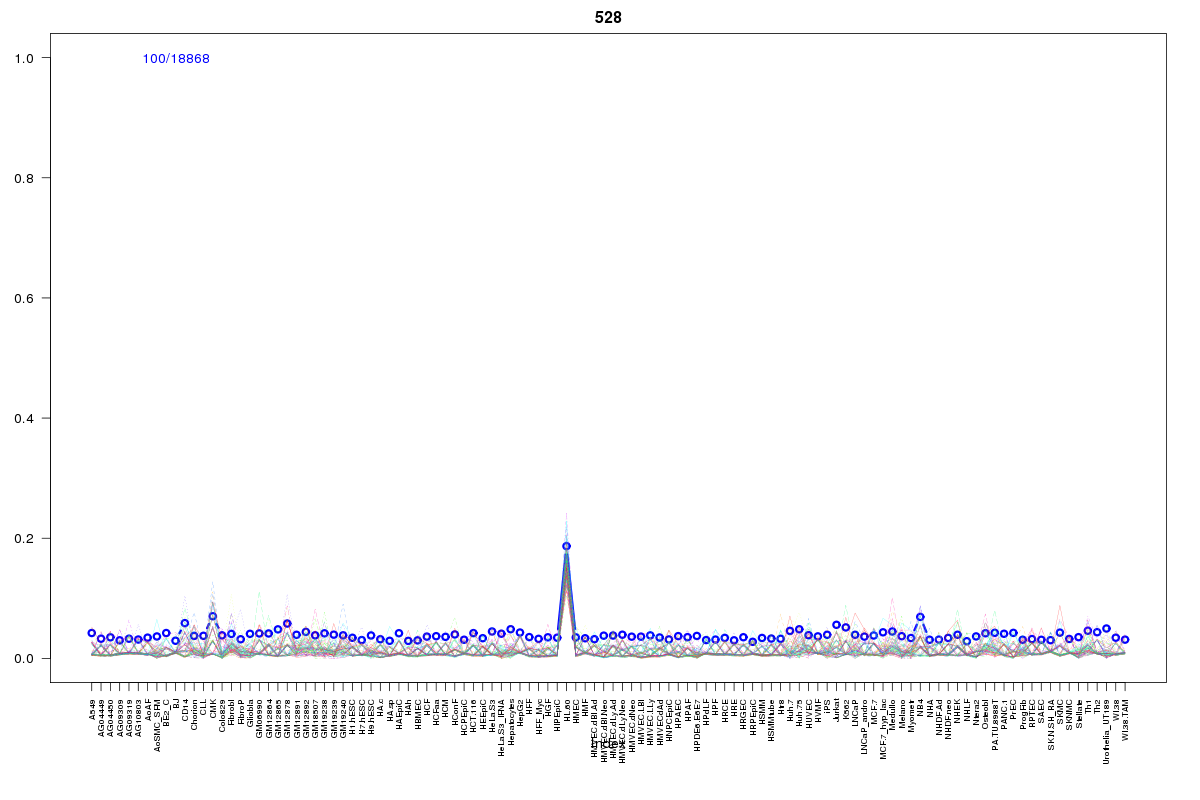 | 528 | 1 |
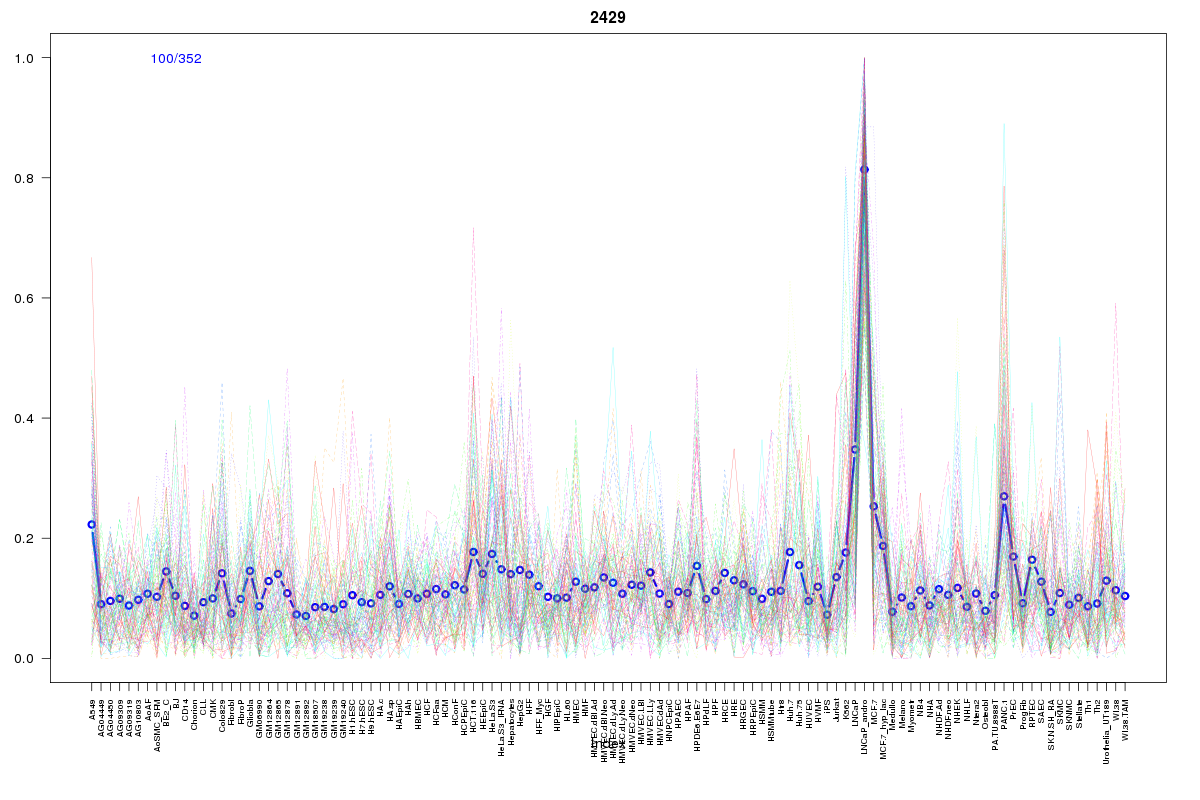 | 2429 | 1 |
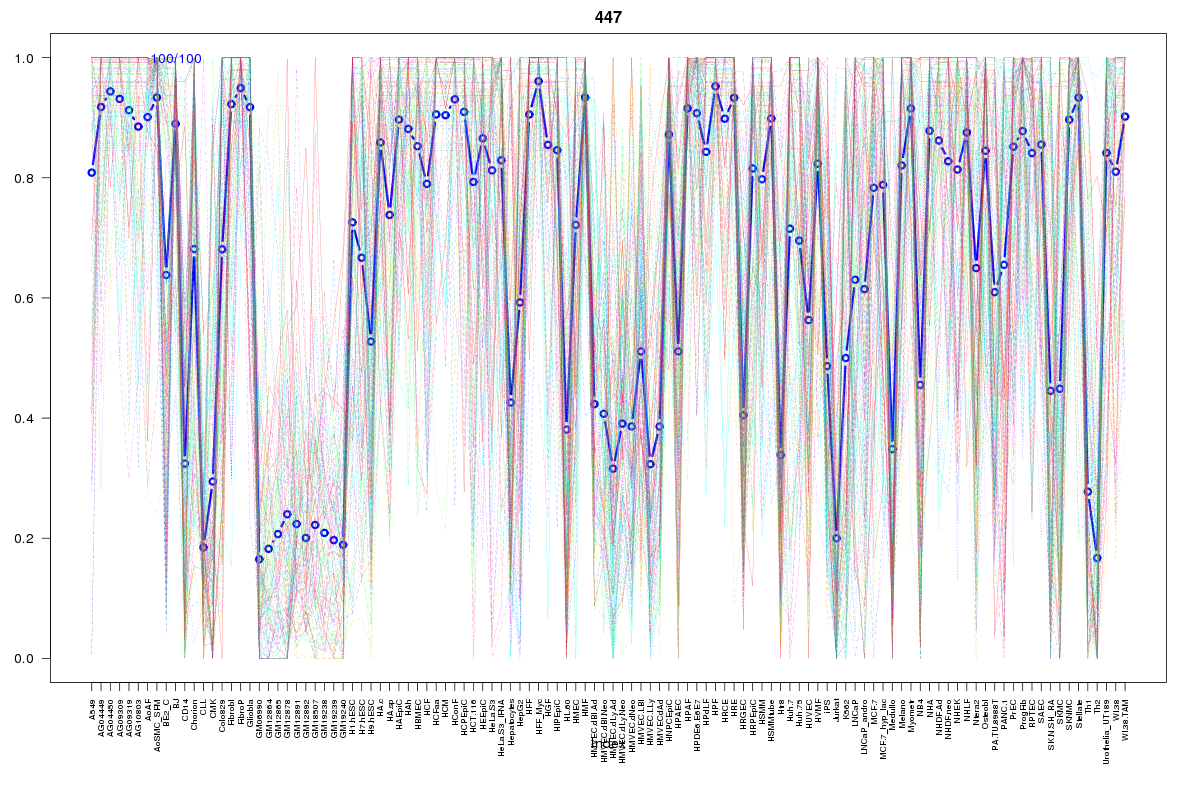 | 447 | 1 |
 | 430 | 1 |
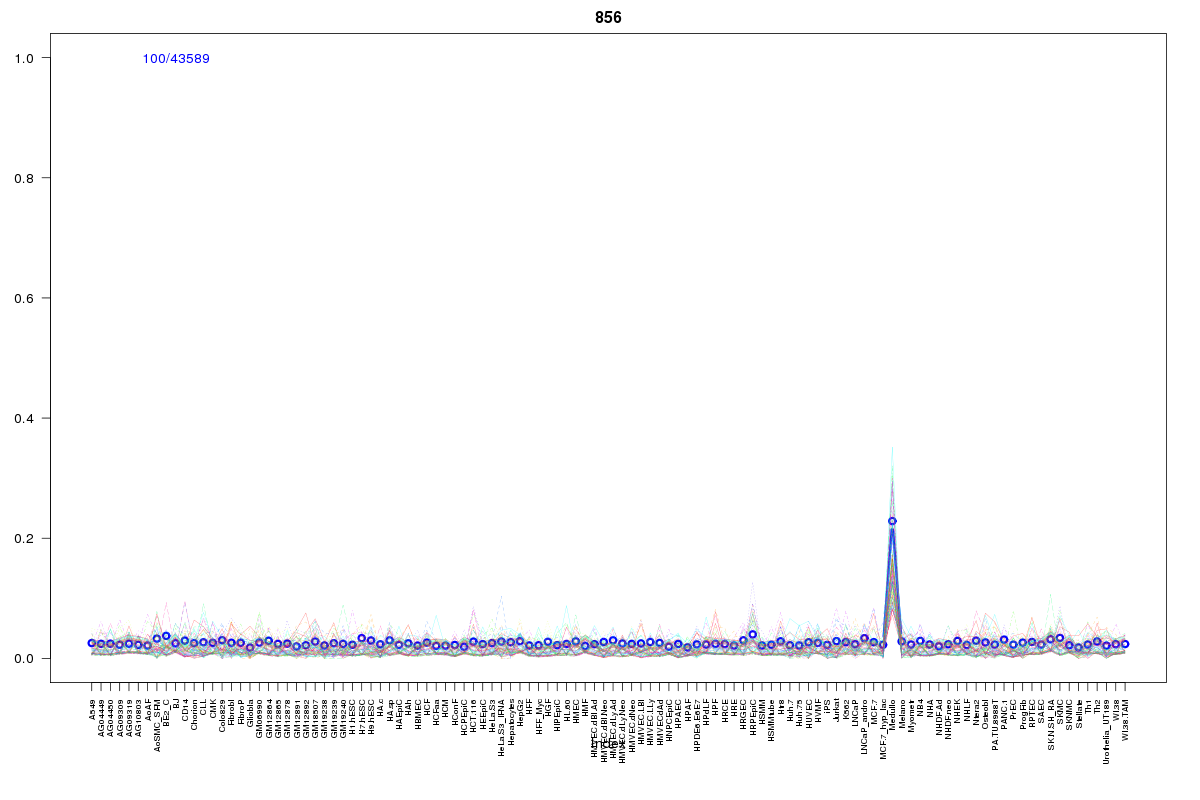 | 856 | 1 |
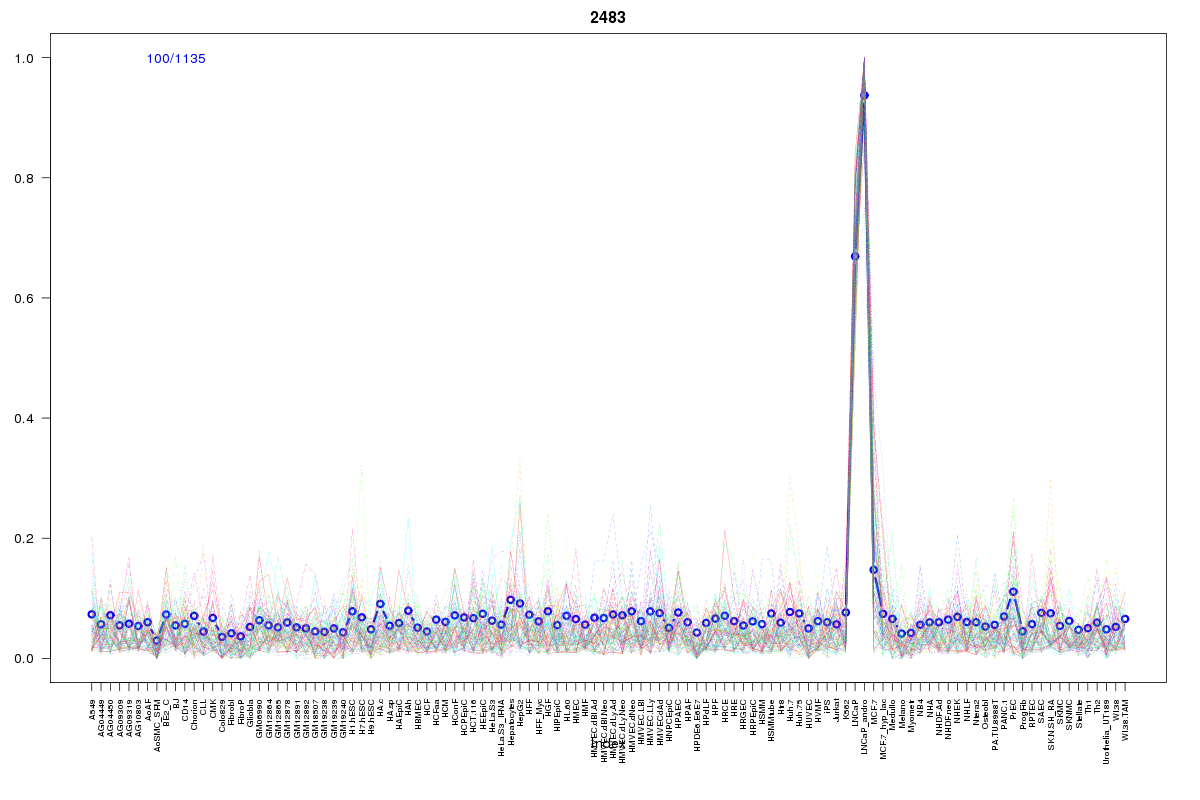 | 2483 | 1 |
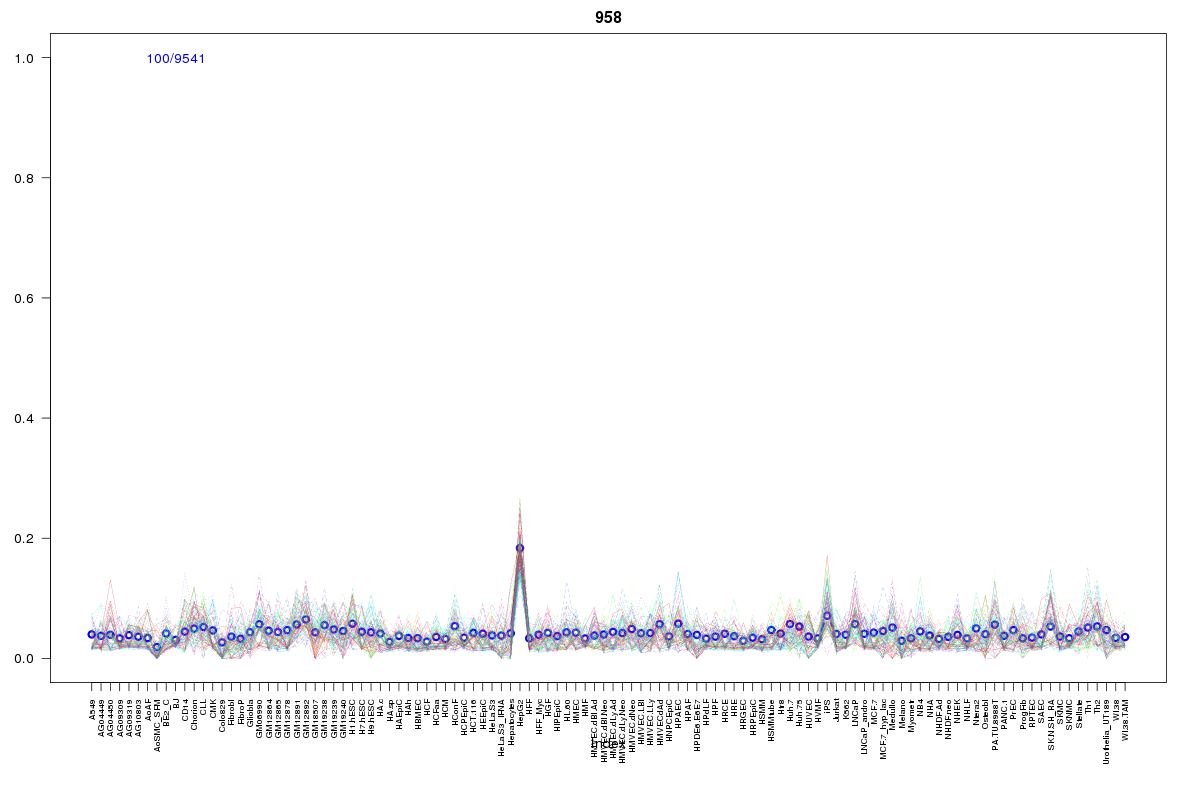 | 958 | 1 |
 | 2186 | 1 |
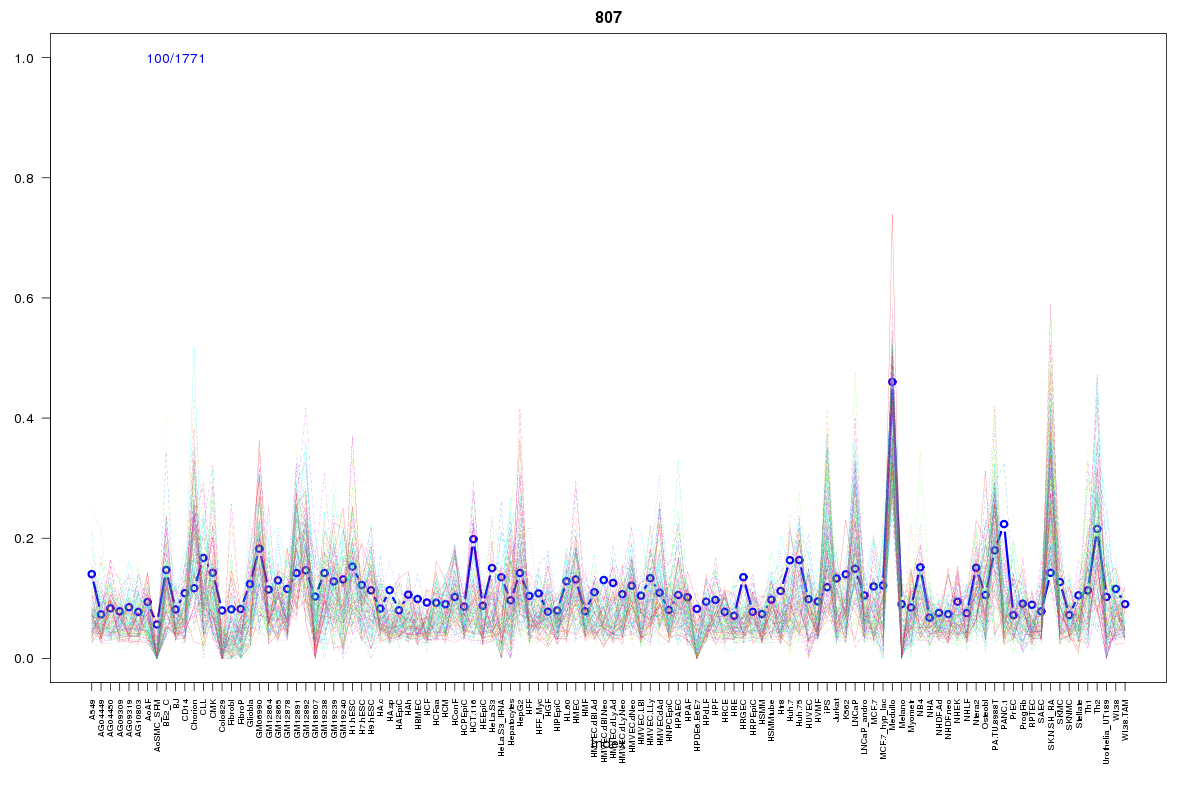 | 807 | 1 |
Resources
BED file downloads
Connects to 35 DHS sitesTop 10 Correlated DHS Sites
p-values indiciate significant higher or lower correlation| Location | Cluster | P-value |
|---|---|---|
| chr1:201235720-201235870 | 1778 | 0 |
| chr1:201118865-201119015 | 1855 | 0 |
| chr1:201012400-201012550 | 2429 | 0.001 |
| chr1:201192100-201192250 | 394 | 0.001 |
| chr1:201191845-201191995 | 807 | 0.001 |
| chr1:201236500-201236650 | 2230 | 0.001 |
| chr1:201029085-201029235 | 1605 | 0.001 |
| chr1:201192325-201192475 | 773 | 0.003 |
| chr1:201236160-201236310 | 1973 | 0.003 |
| chr1:201154120-201154270 | 447 | 0.003 |
| chr1:201220525-201220675 | 1605 | 0.003 |
External Databases
UCSCEnsembl (ENSG00000116857)