Gene: TMEM115
chr3: 50392179-50397041Expression Profile
(log scale)
Graphical Connections
Distribution of linked clusters:
You may find it interesting if many of the connected DHS sites belong to the same cluster.| Cluster Profile | Cluster ID | Number of DHS sites in this cluster |
|---|---|---|
 | 130 | 2 |
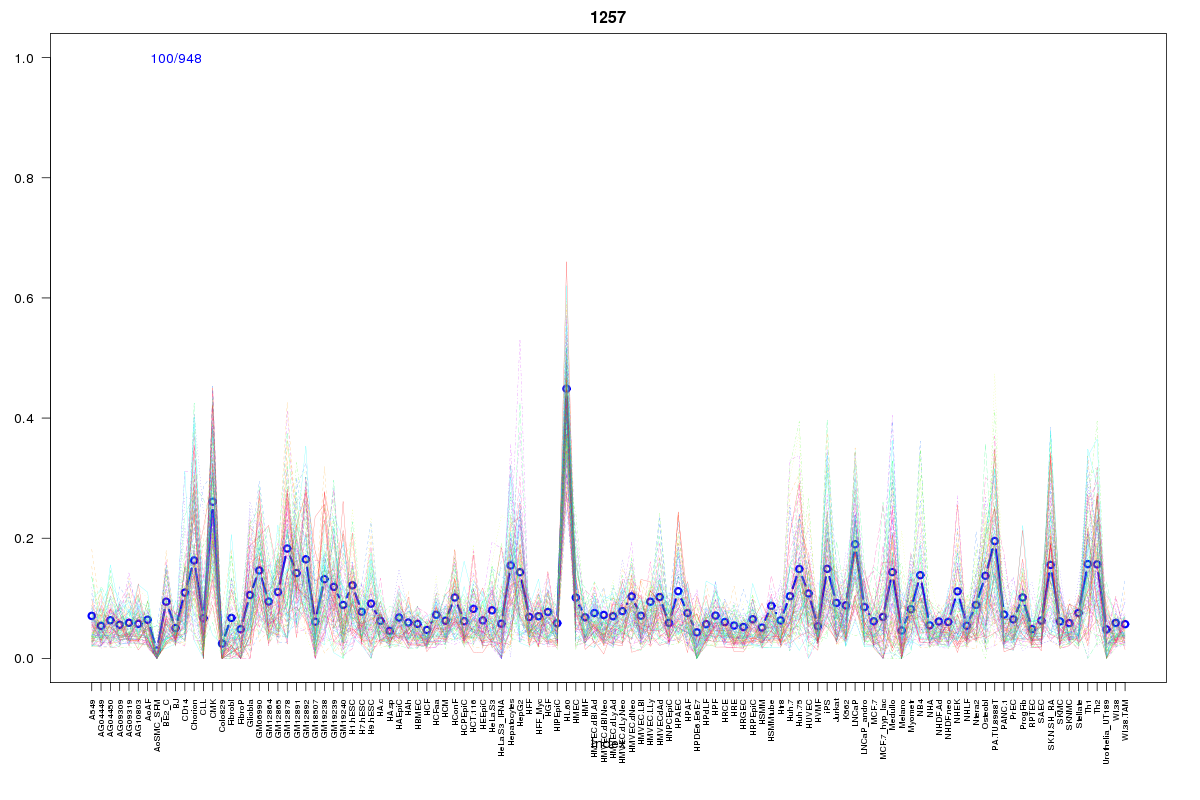 | 1257 | 2 |
 | 570 | 2 |
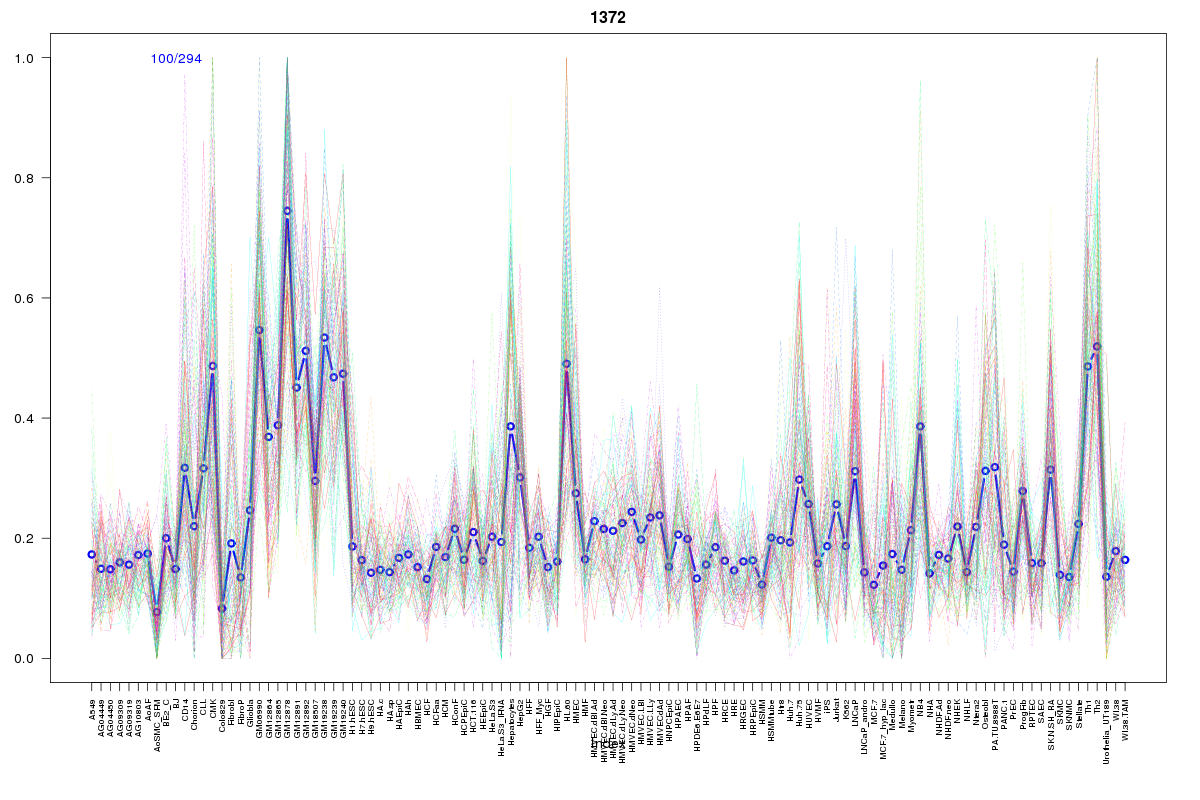 | 1372 | 2 |
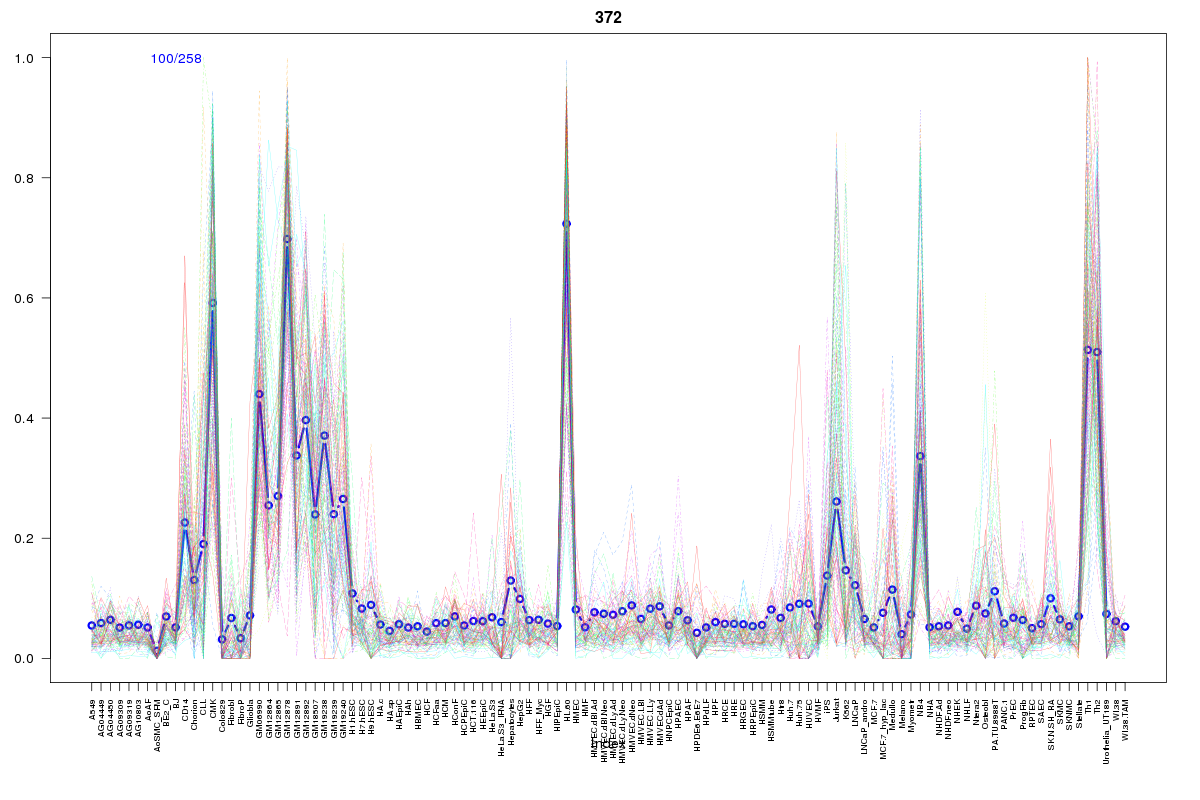 | 372 | 2 |
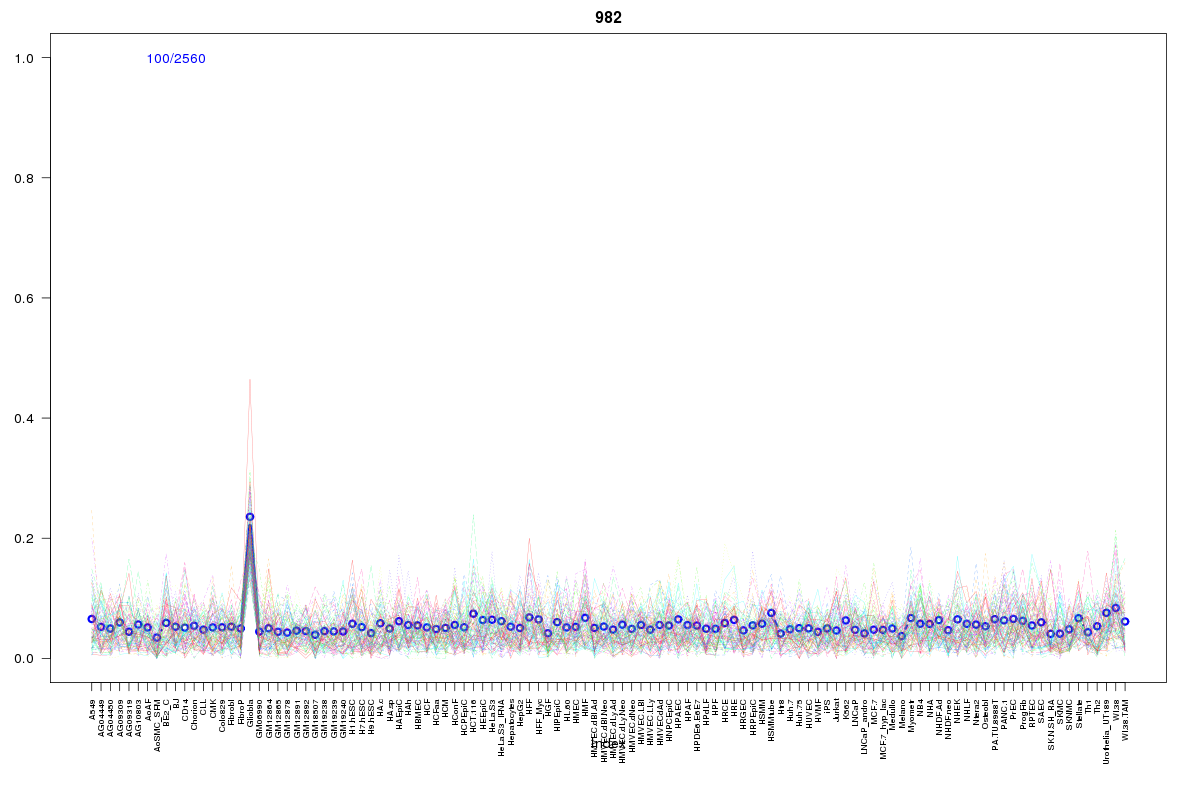 | 982 | 1 |
 | 1078 | 1 |
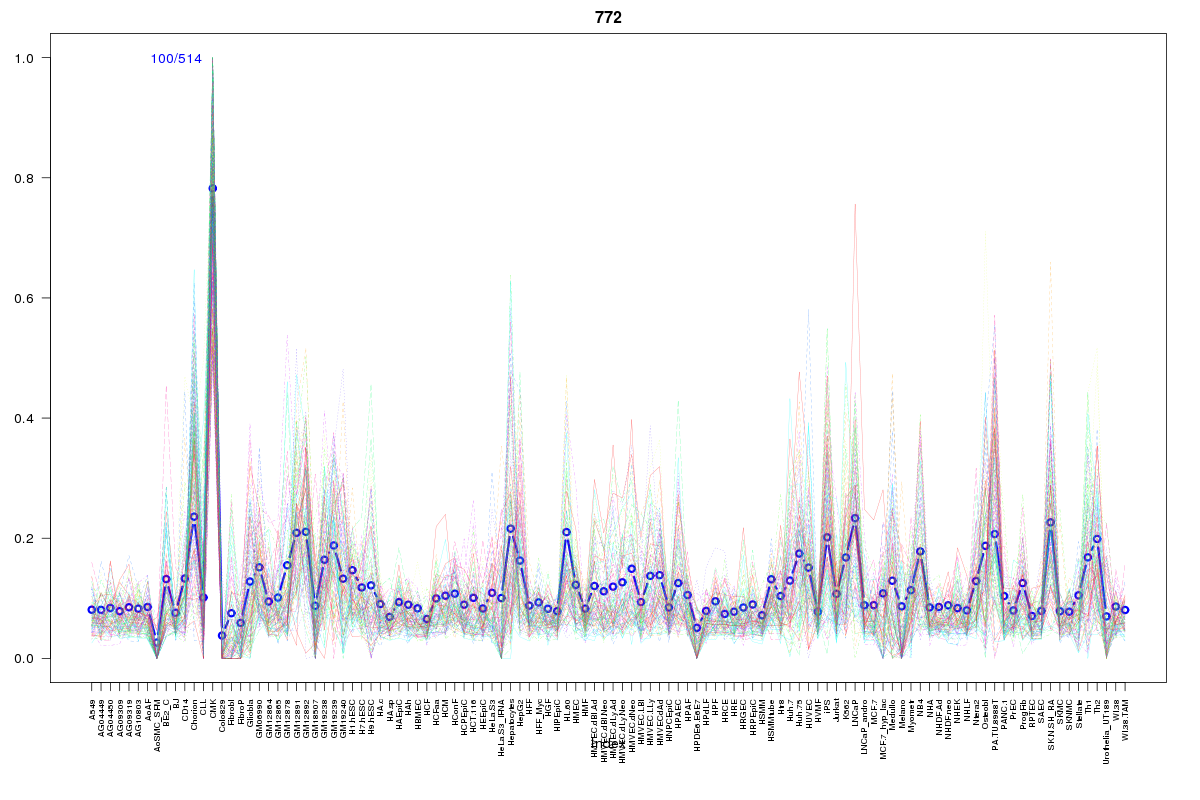 | 772 | 1 |
 | 192 | 1 |
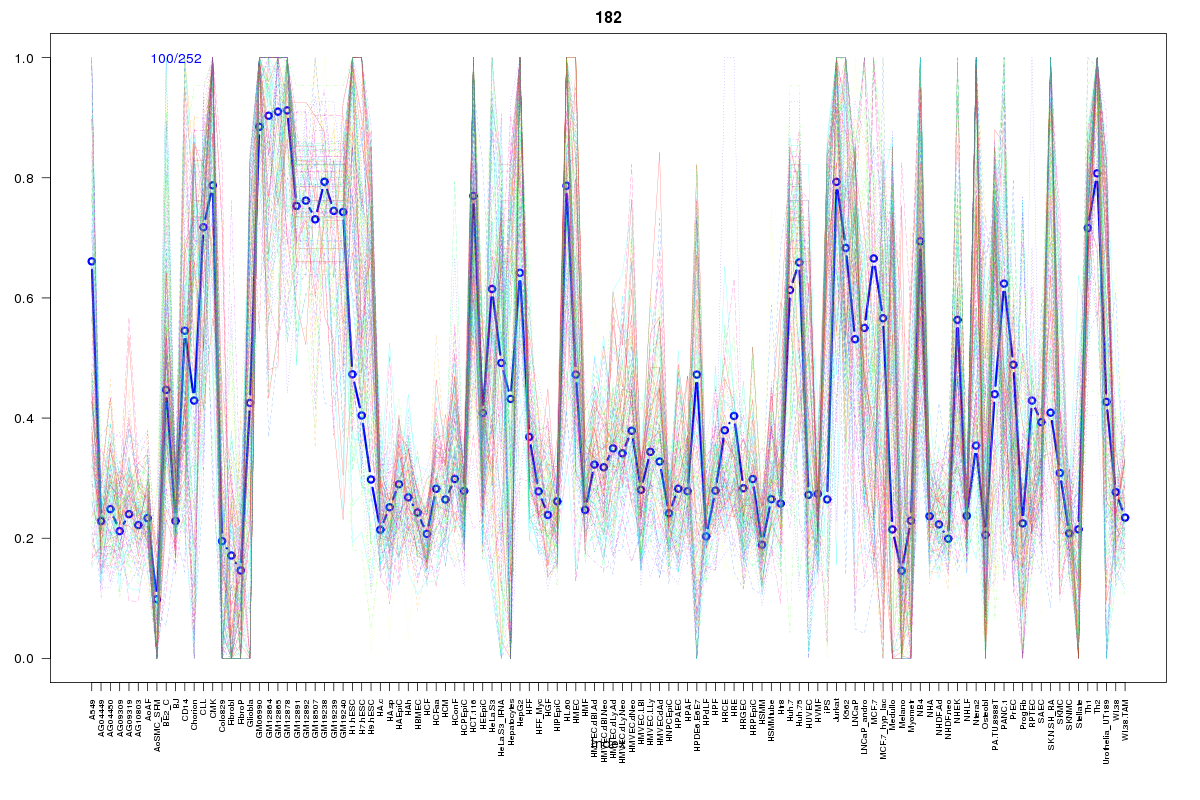 | 182 | 1 |
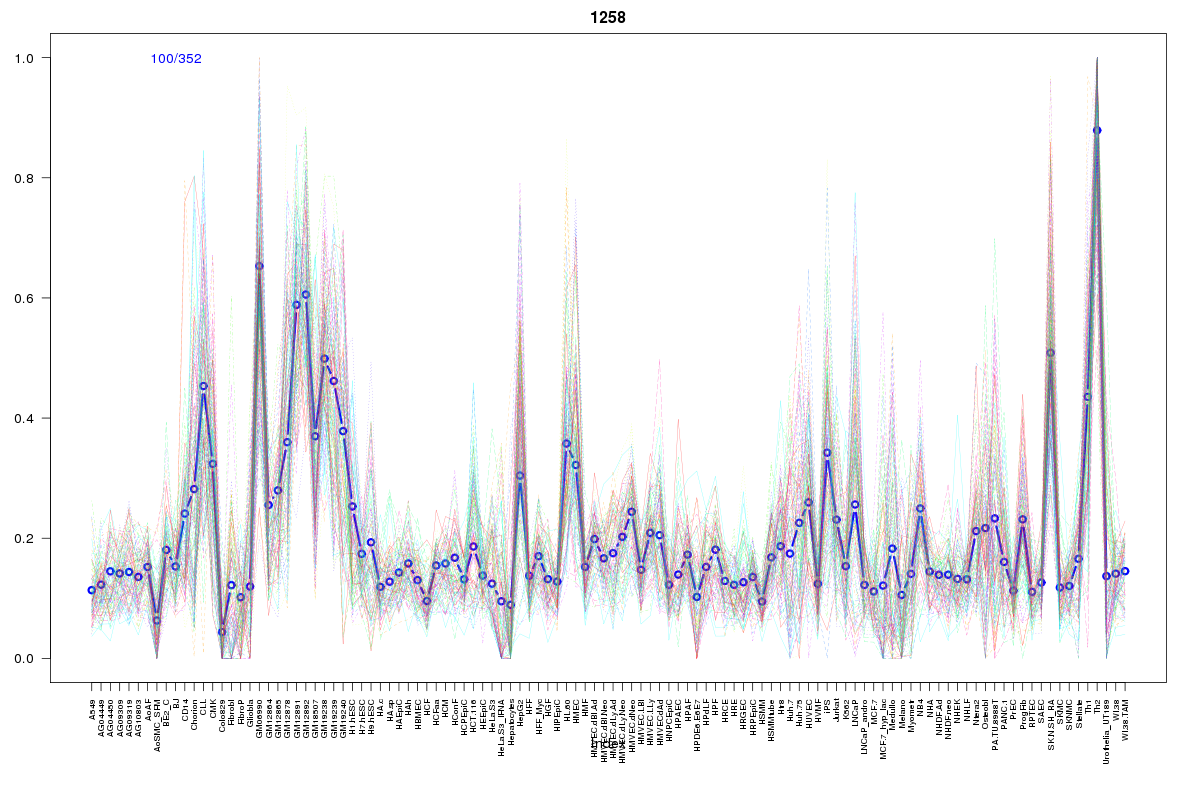 | 1258 | 1 |
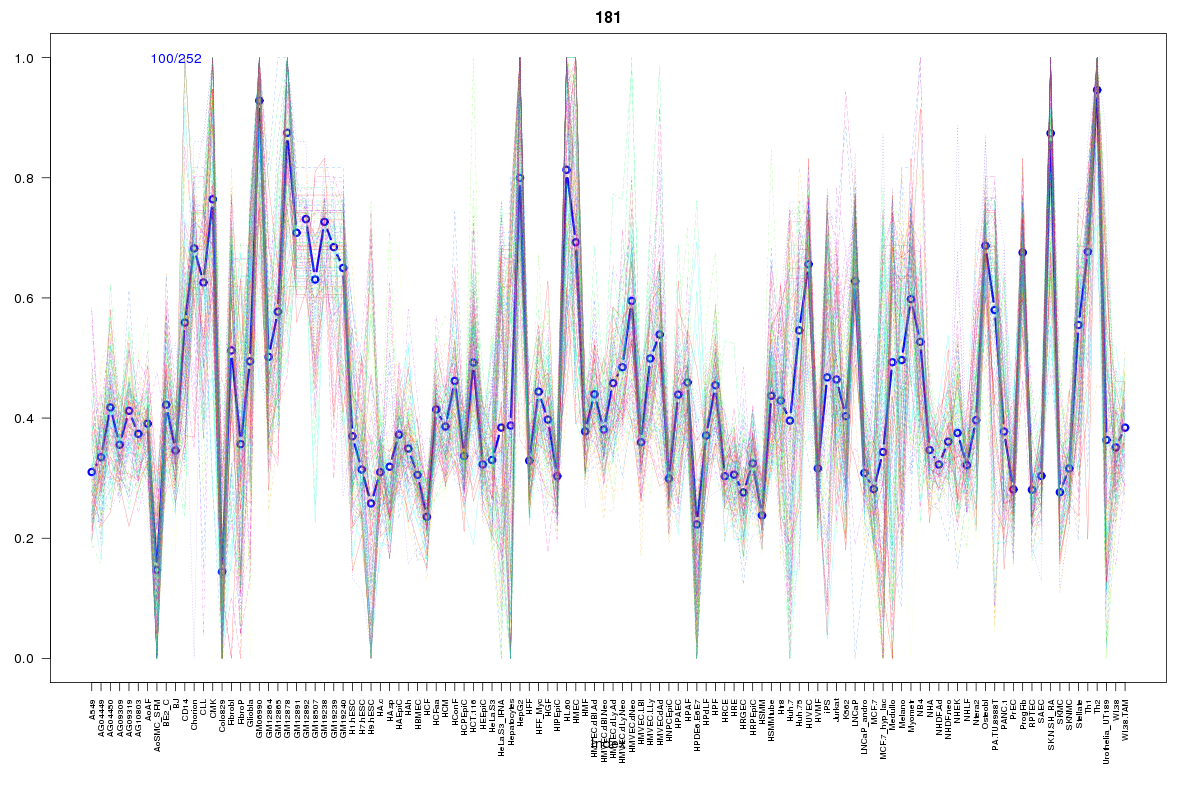 | 181 | 1 |
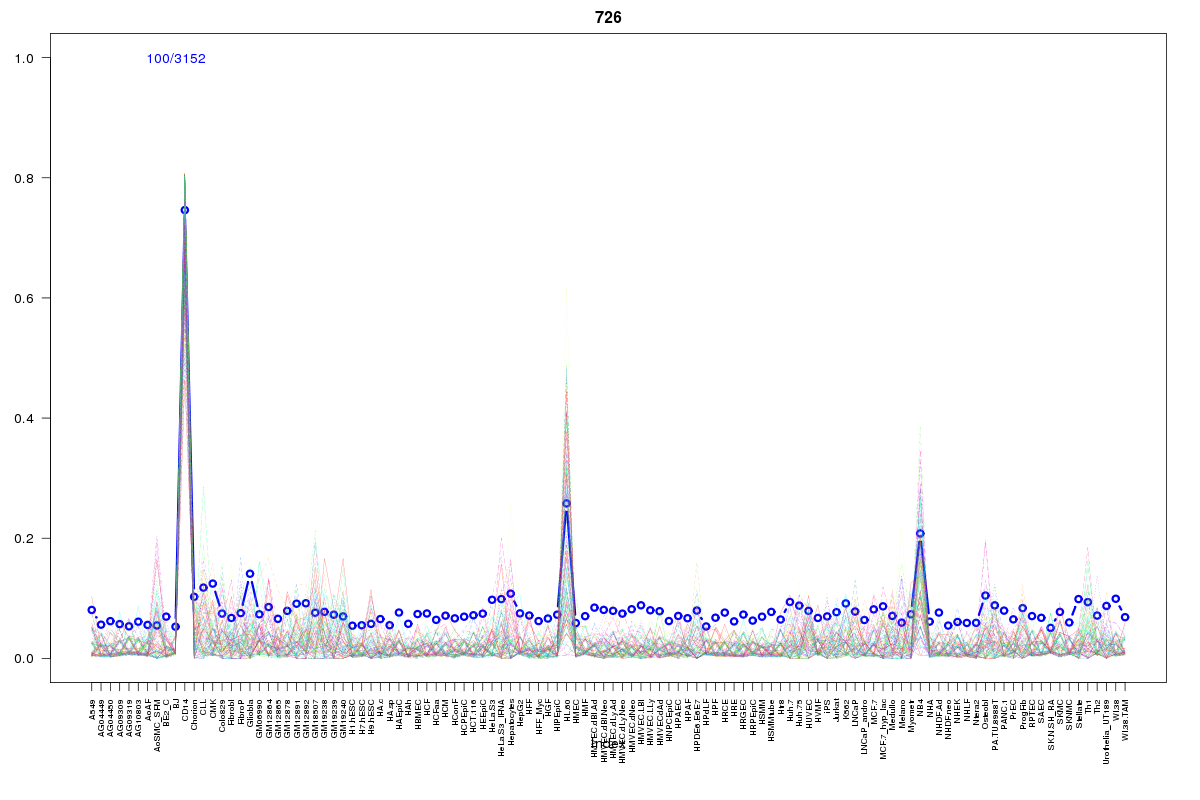 | 726 | 1 |
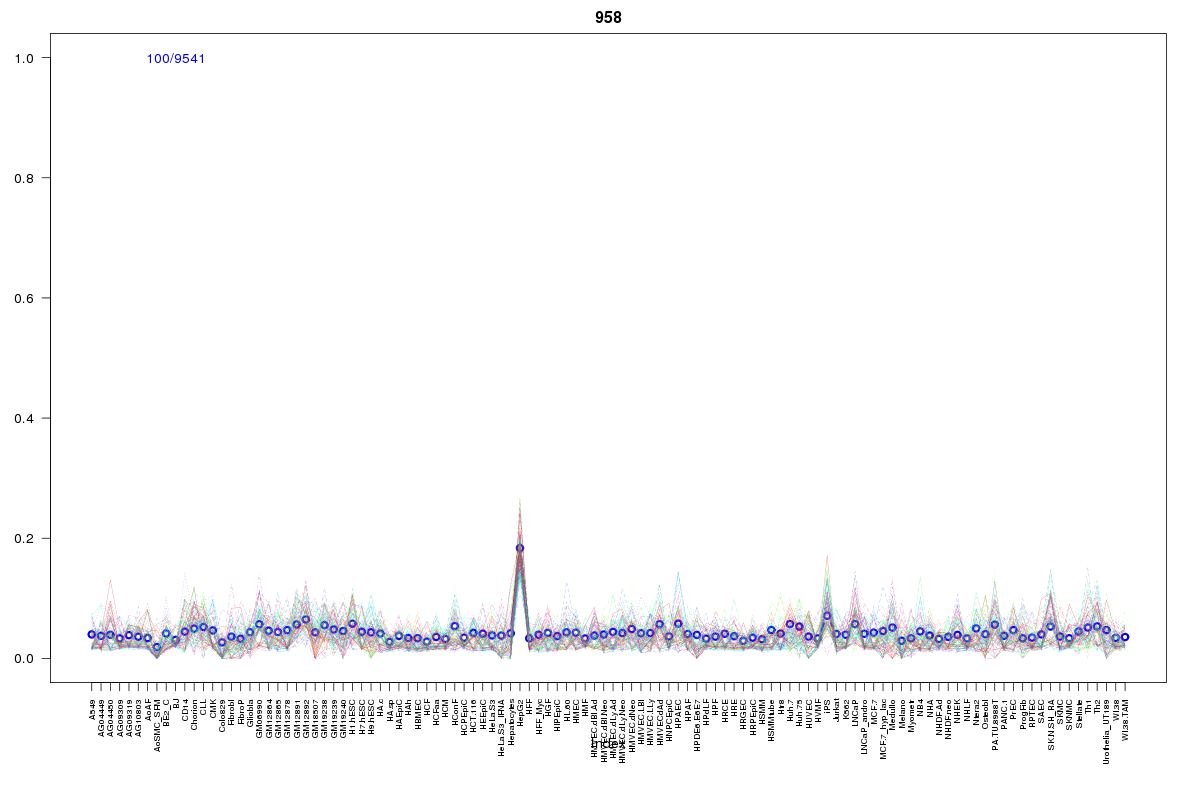 | 958 | 1 |
 | 2055 | 1 |
 | 1509 | 1 |
 | 568 | 1 |
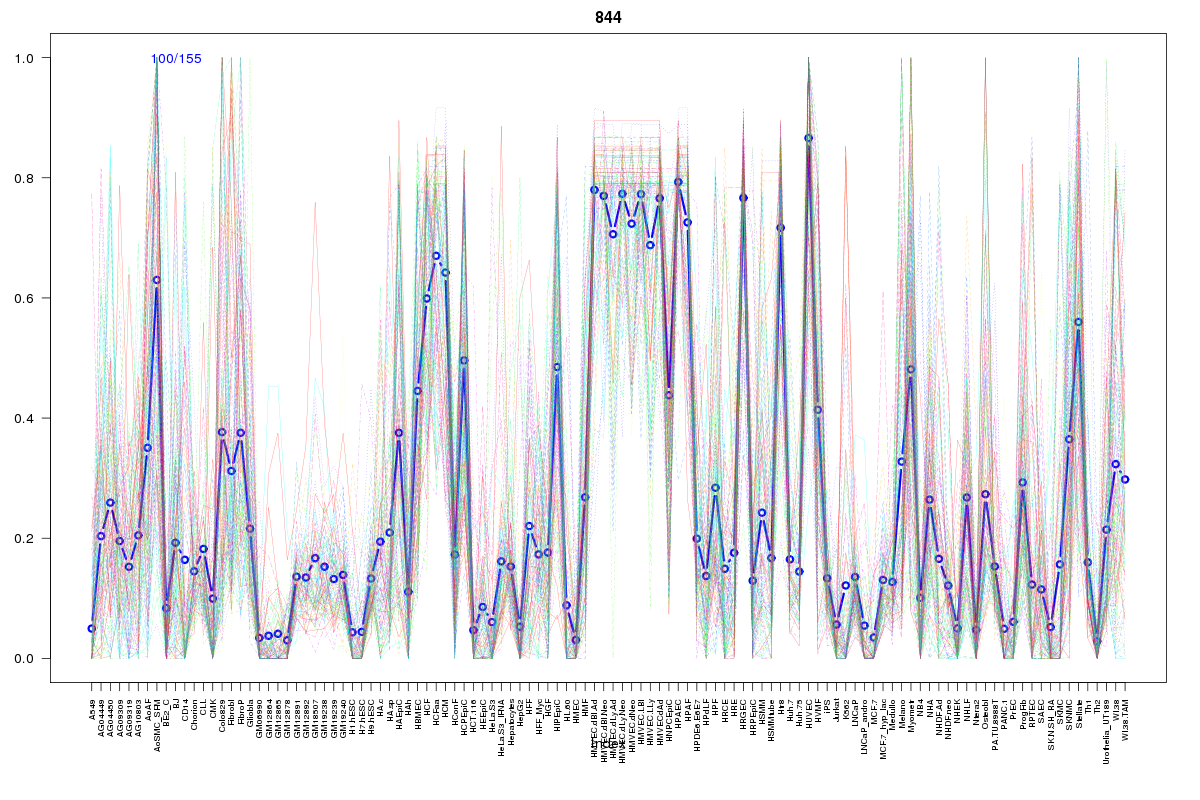 | 844 | 1 |
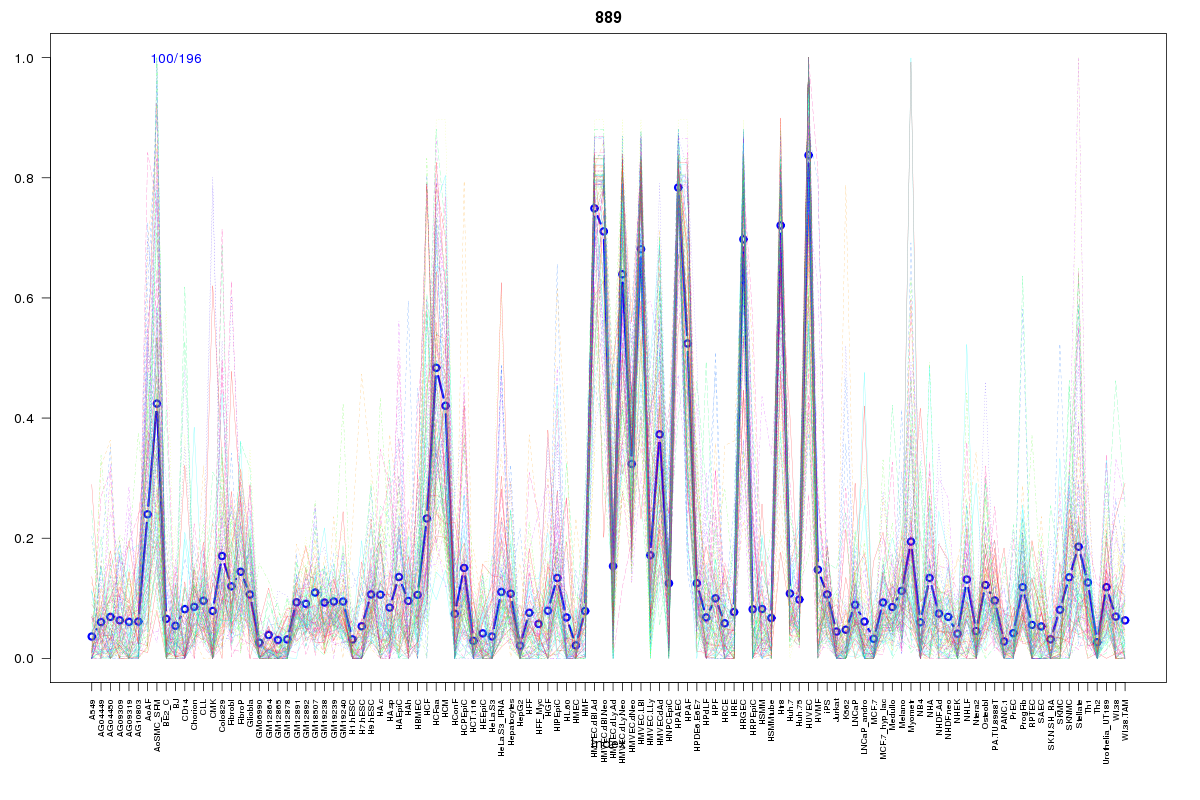 | 889 | 1 |
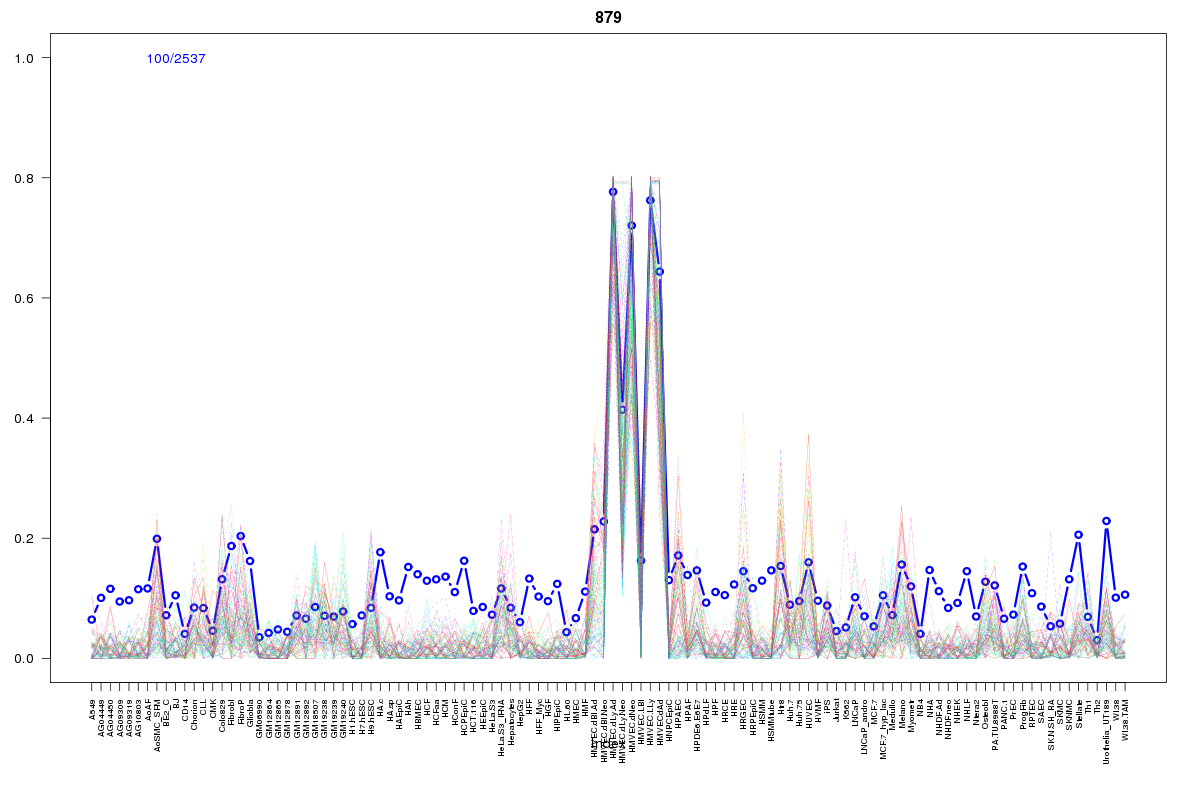 | 879 | 1 |
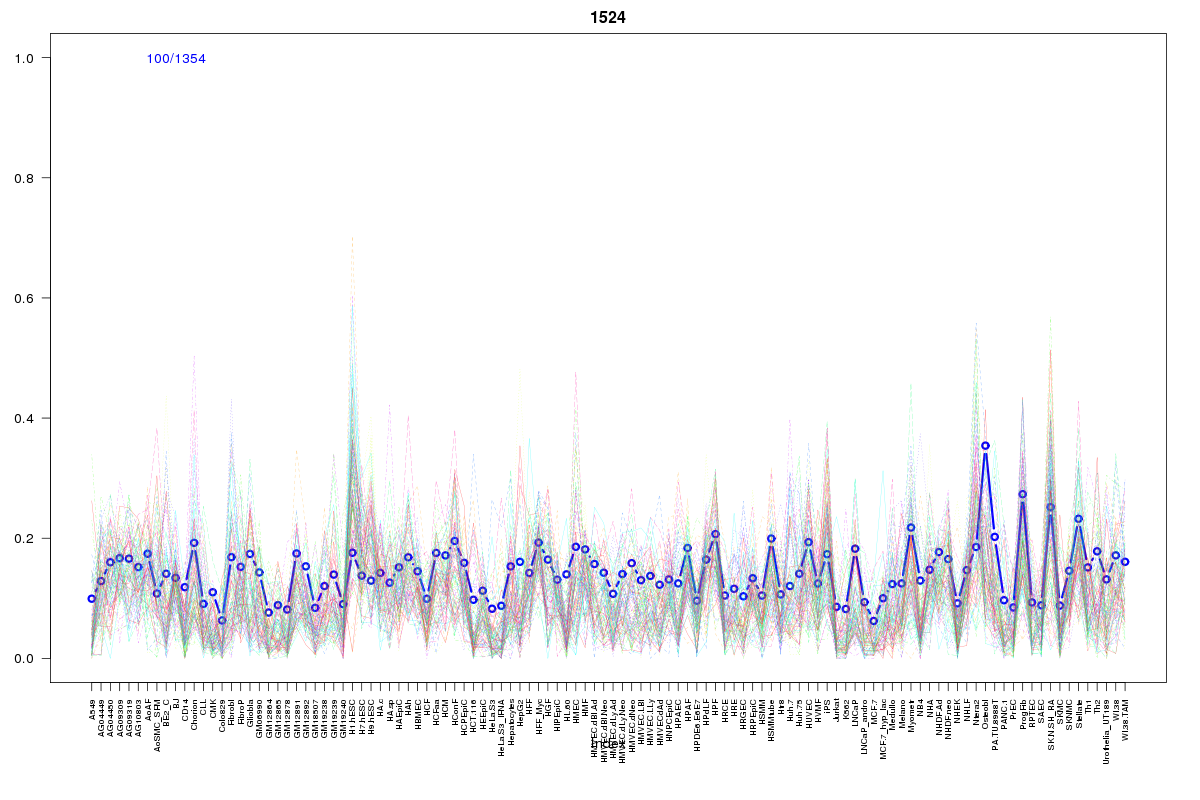 | 1524 | 1 |
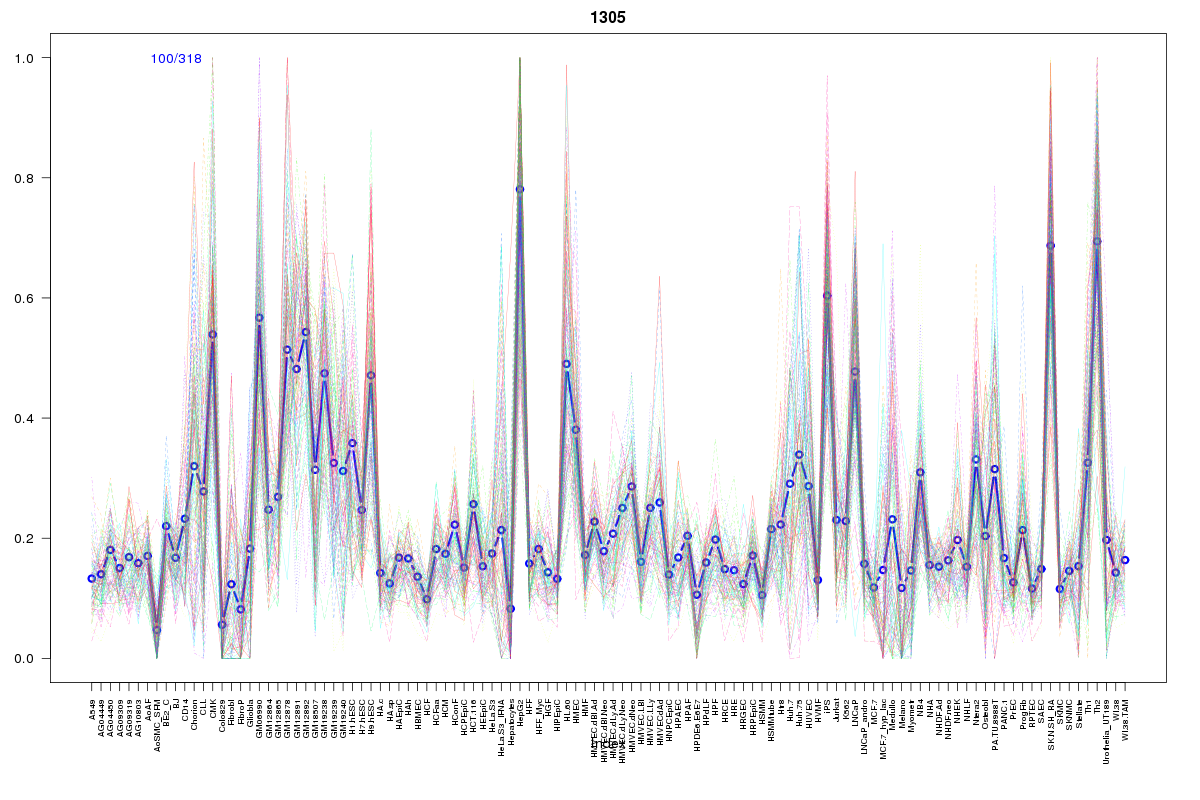 | 1305 | 1 |
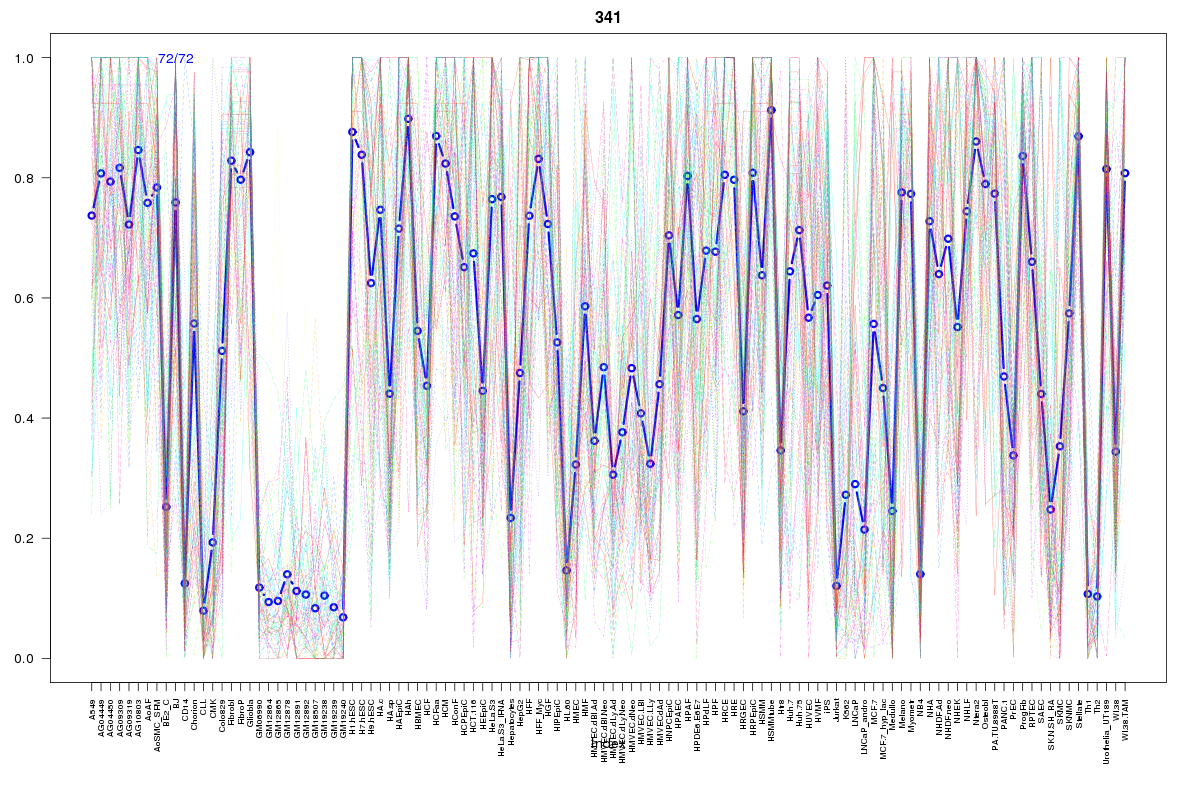 | 341 | 1 |
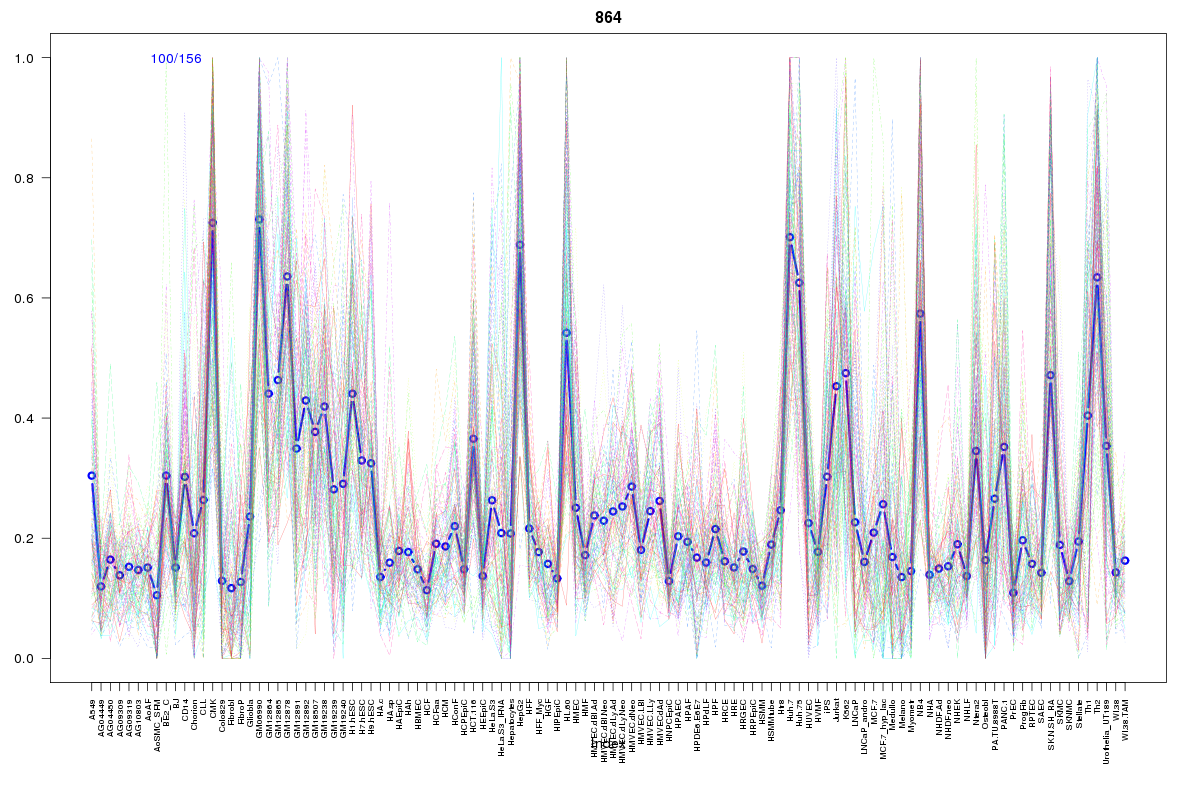 | 864 | 1 |
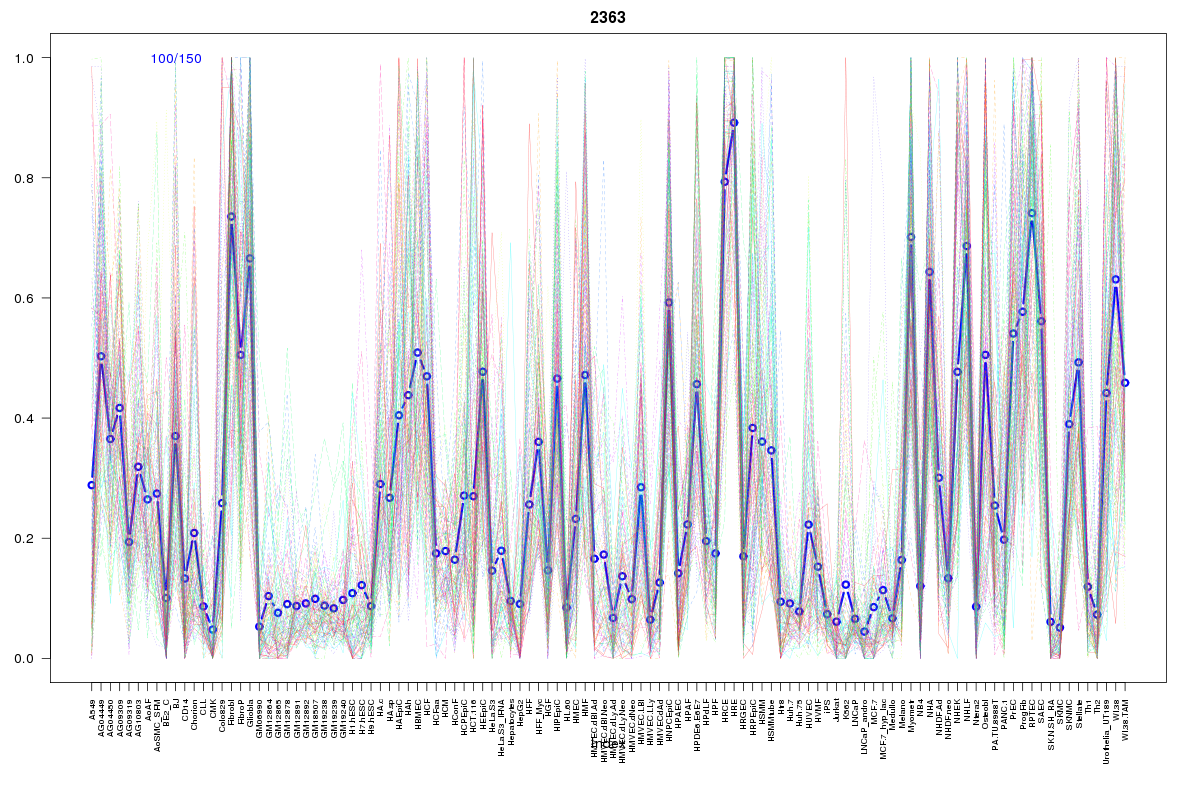 | 2363 | 1 |
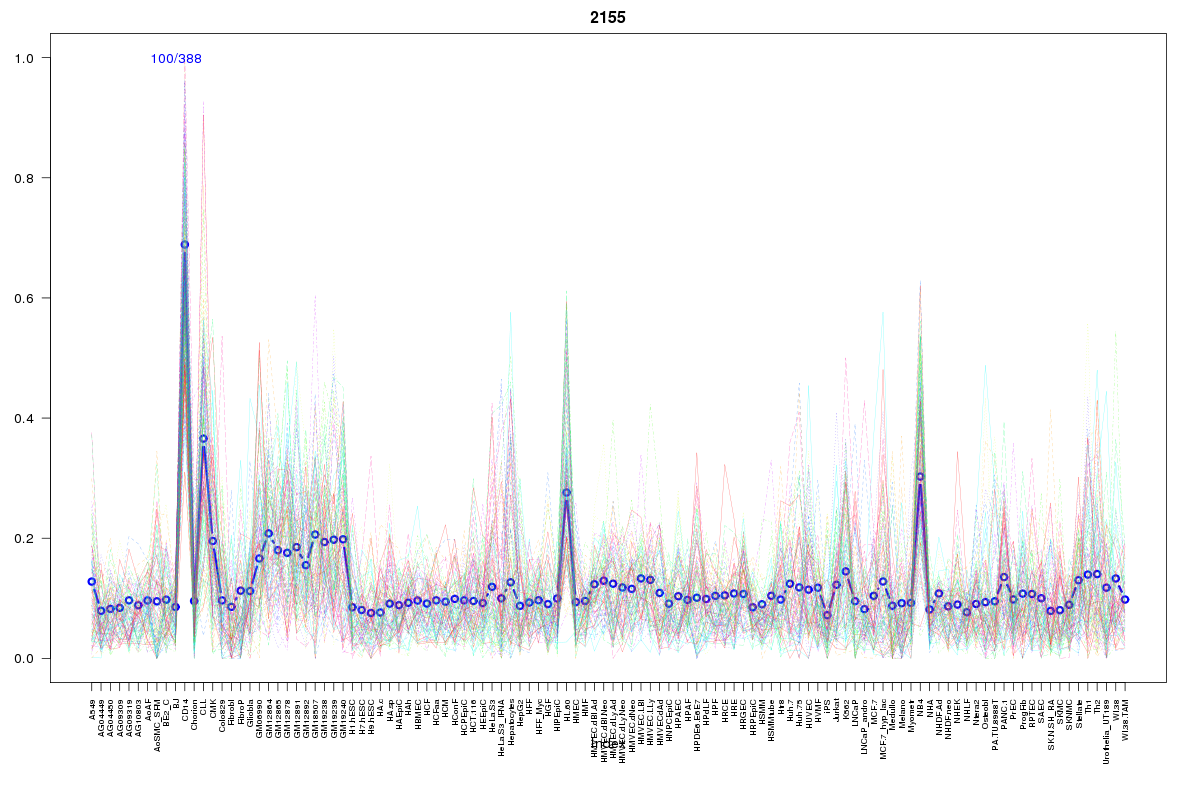 | 2155 | 1 |
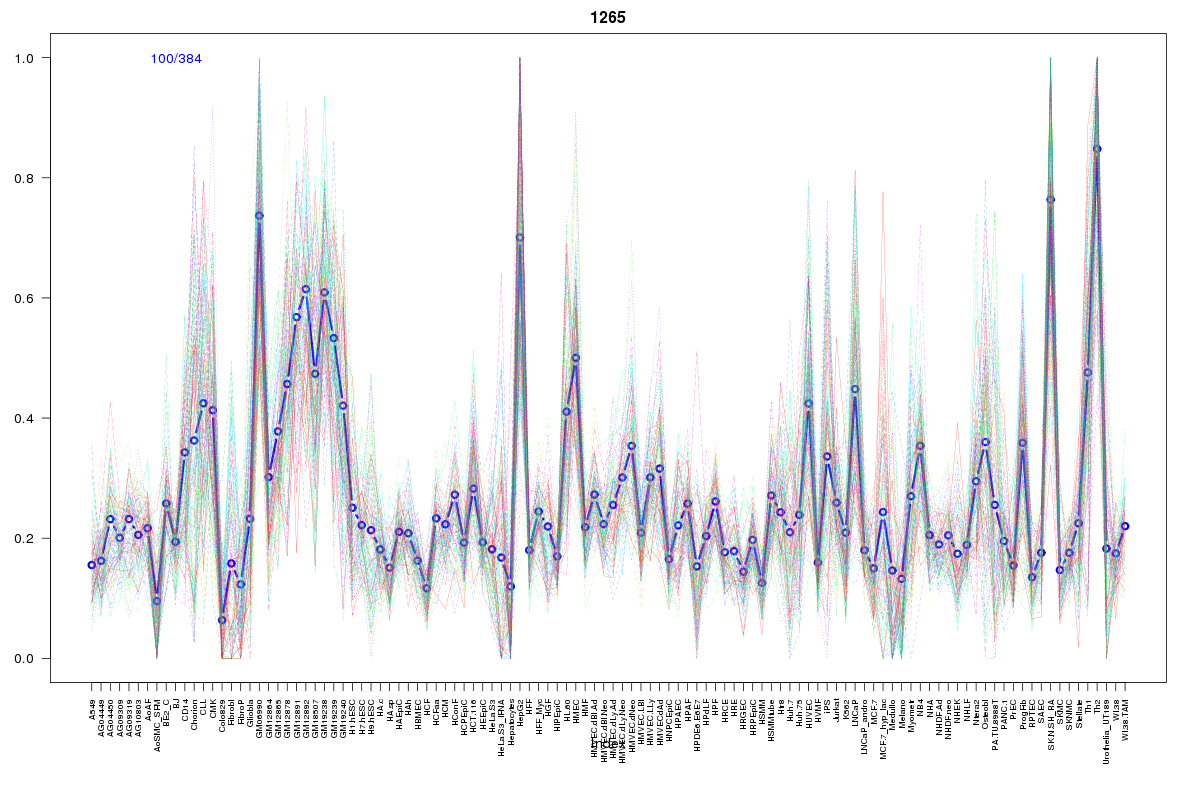 | 1265 | 1 |
Resources
BED file downloads
Connects to 32 DHS sitesTop 10 Correlated DHS Sites
p-values indiciate significant higher or lower correlation| Location | Cluster | P-value |
|---|---|---|
| chr3:50371280-50371430 | 844 | 0.003 |
| chr3:50300965-50301115 | 1524 | 0.008 |
| chr3:50371440-50371590 | 889 | 0.014 |
| chr3:50302140-50302290 | 341 | 0.019 |
| chr3:50307445-50307595 | 2363 | 0.019 |
| chr3:50372220-50372370 | 879 | 0.019 |
| chr3:50315925-50316075 | 982 | 0.023 |
| chr3:50338285-50338435 | 958 | 0.024 |
| chr3:50370545-50370695 | 568 | 0.022 |
| chr3:50471700-50471850 | 2055 | 0.021 |
| chr3:50293740-50293890 | 570 | 0.021 |
External Databases
UCSCEnsembl (ENSG00000126062)