Gene: PSMA5
chr1: 109941652-109968973Expression Profile
(log scale)
Graphical Connections
Distribution of linked clusters:
You may find it interesting if many of the connected DHS sites belong to the same cluster.| Cluster Profile | Cluster ID | Number of DHS sites in this cluster |
|---|---|---|
 | 813 | 1 |
 | 979 | 1 |
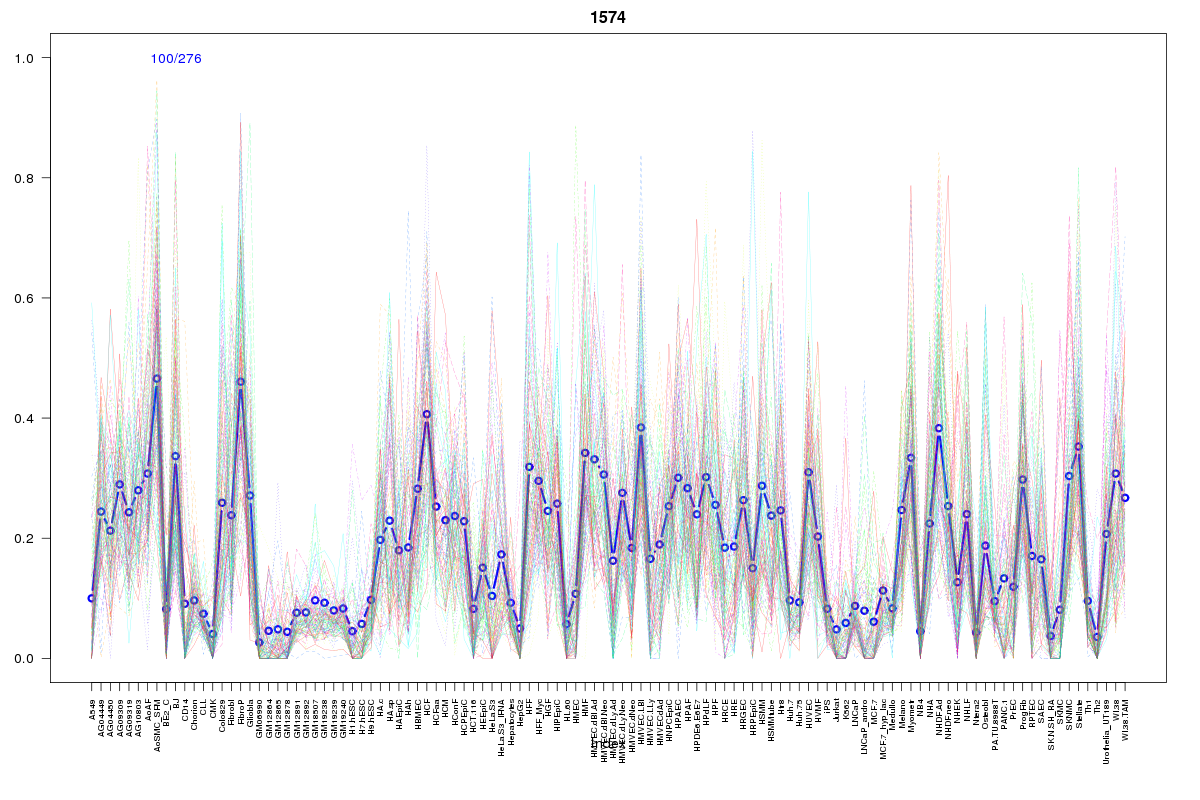 | 1574 | 1 |
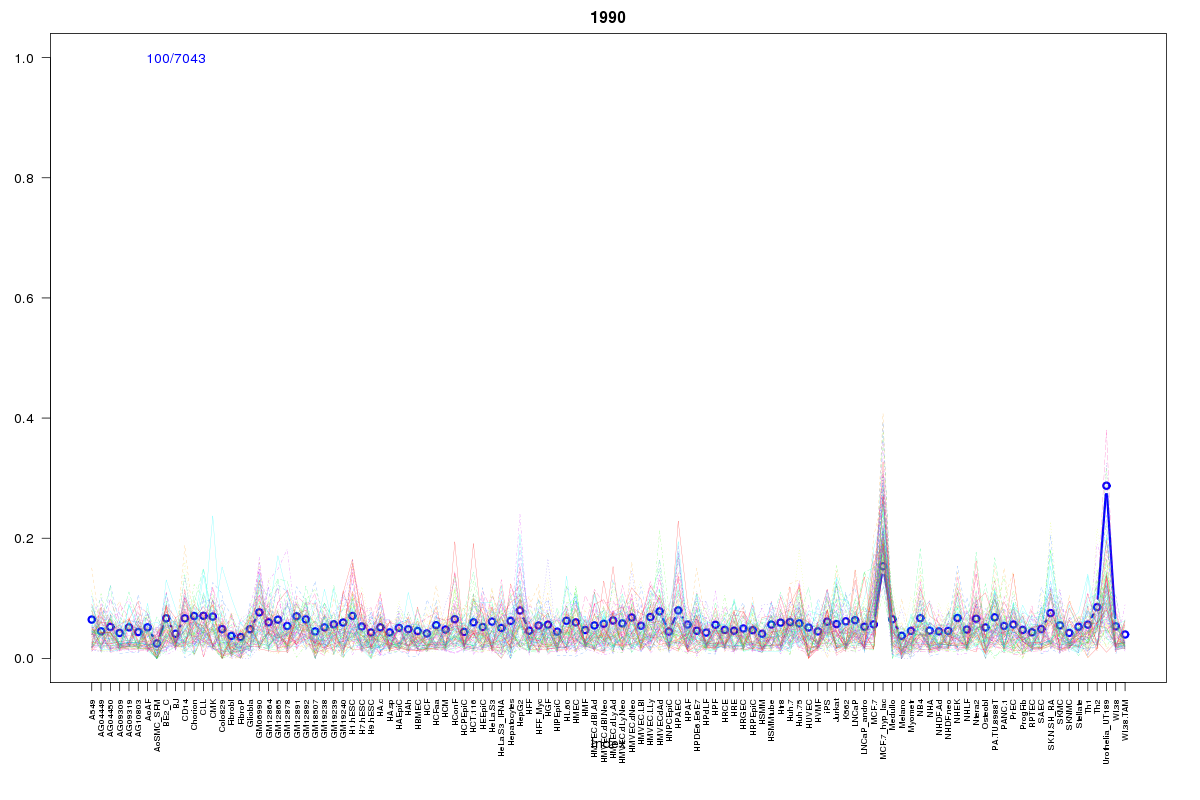 | 1990 | 1 |
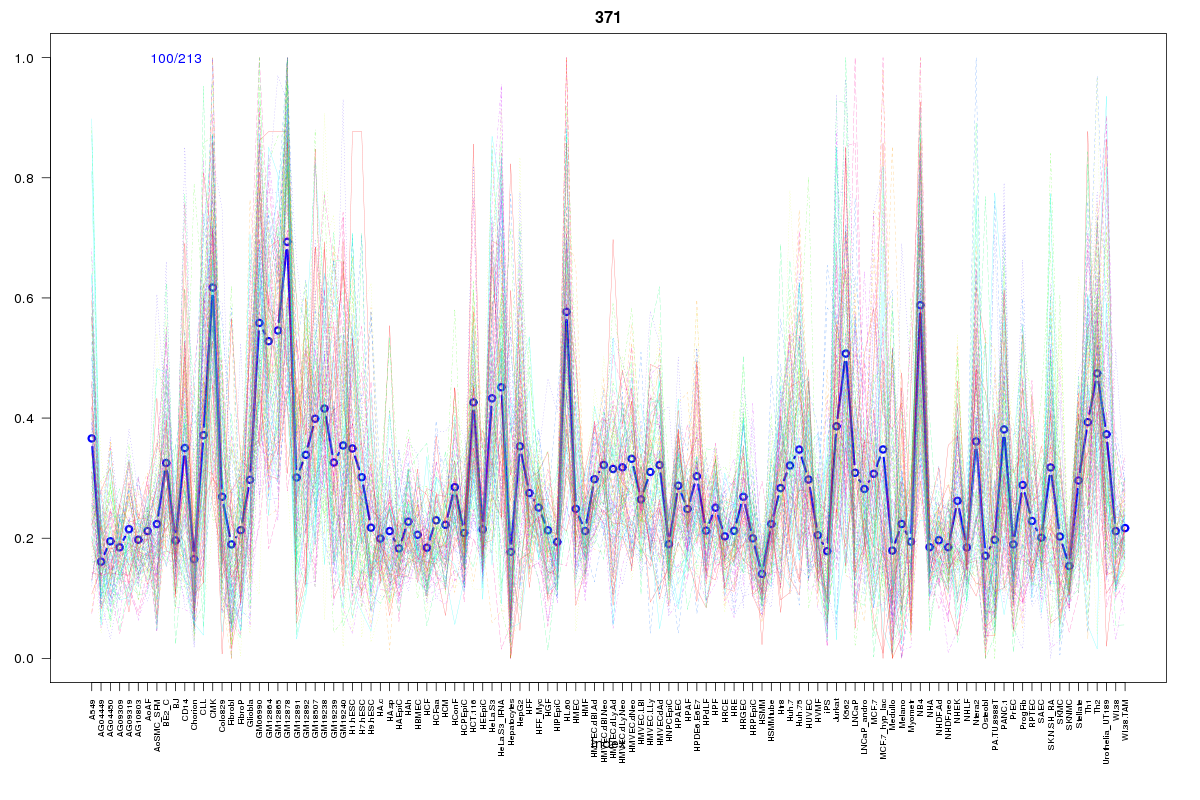 | 371 | 1 |
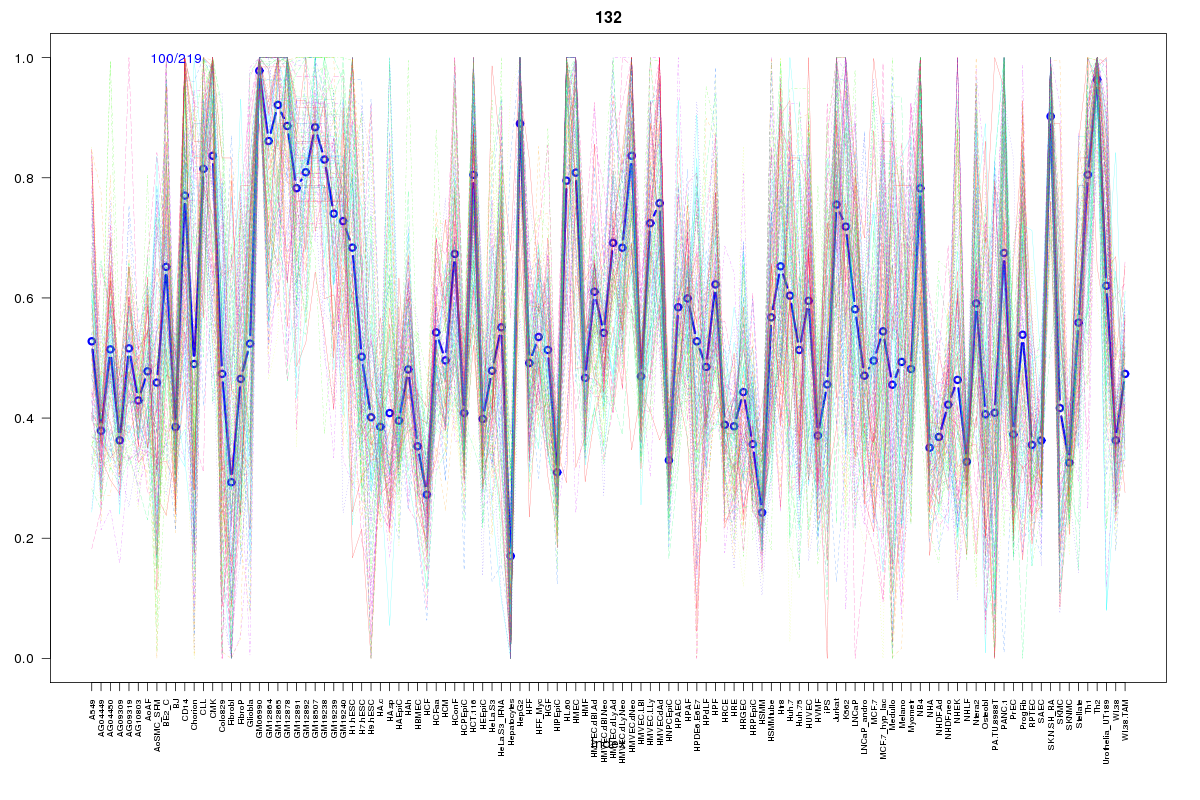 | 132 | 1 |
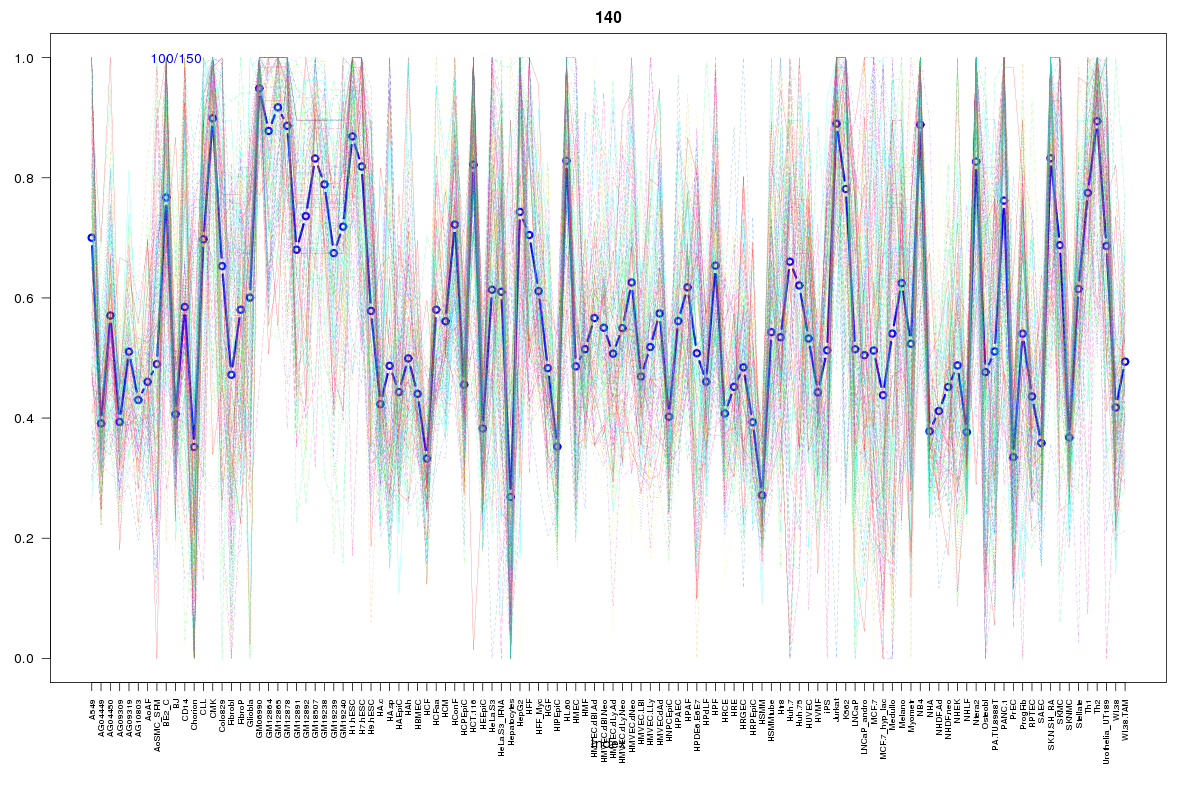 | 140 | 1 |
 | 1056 | 1 |
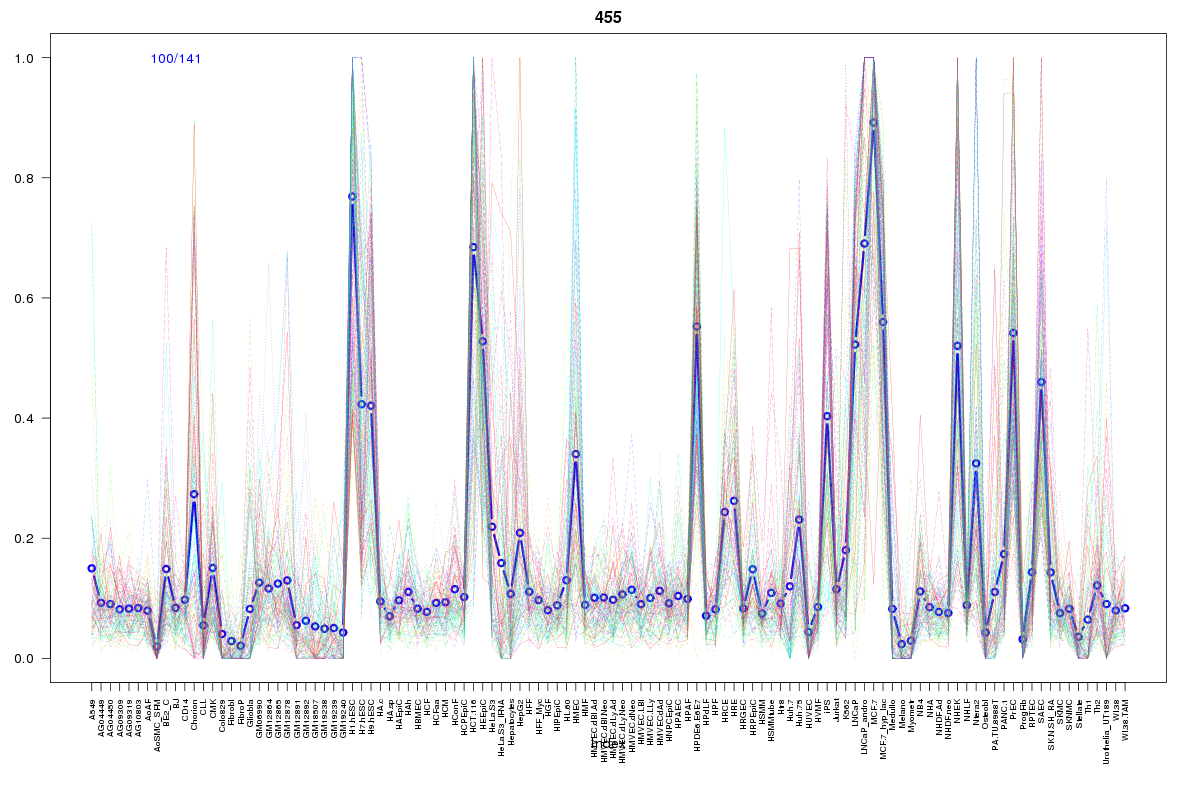 | 455 | 1 |
 | 469 | 1 |
 | 1980 | 1 |
 | 1605 | 1 |
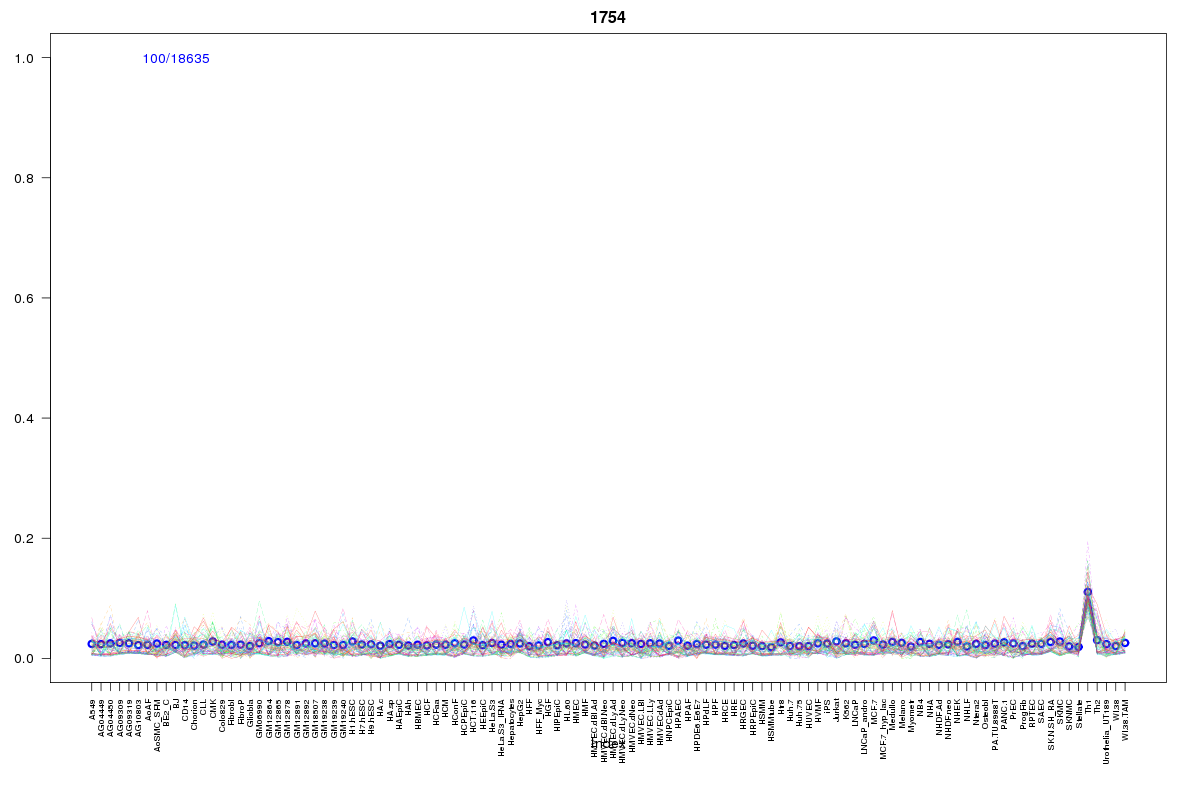 | 1754 | 1 |
 | 1755 | 1 |
 | 615 | 1 |
 | 2114 | 1 |
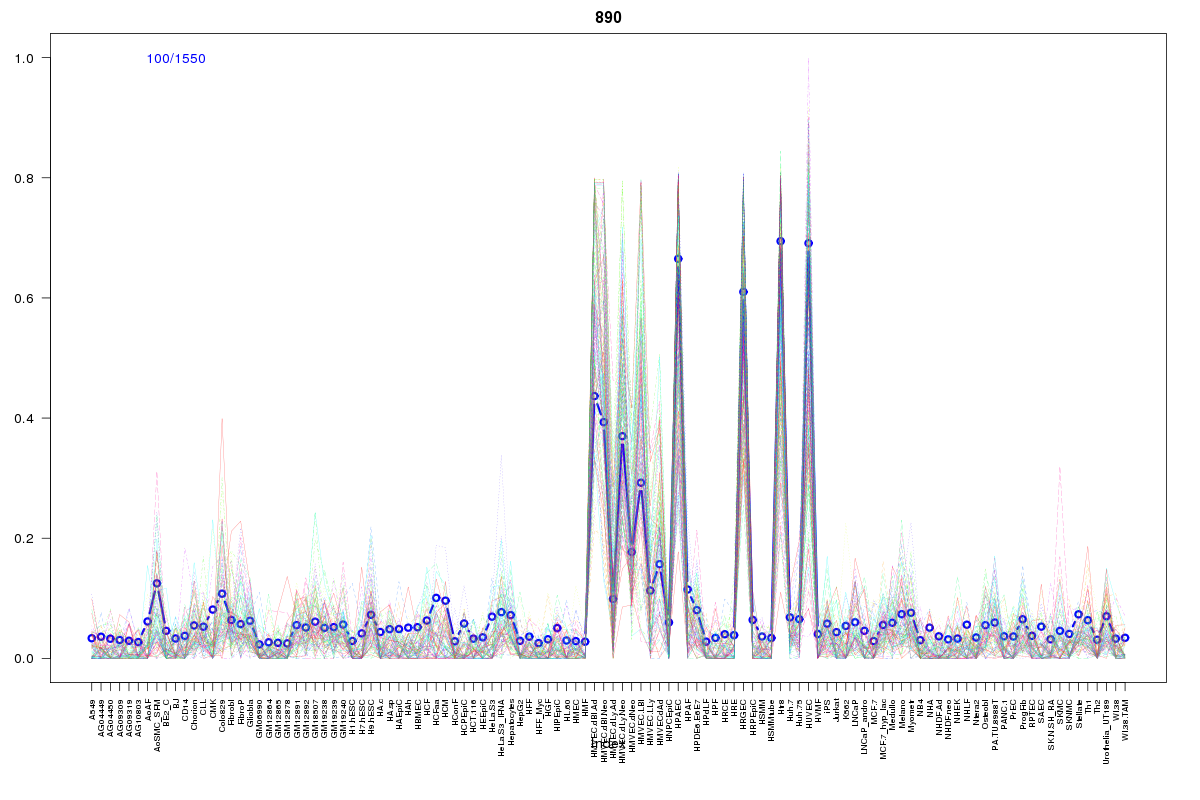 | 890 | 1 |
Resources
BED file downloads
Connects to 17 DHS sitesTop 10 Correlated DHS Sites
p-values indiciate significant higher or lower correlation| Location | Cluster | P-value |
|---|---|---|
| chr1:110054240-110054390 | 2114 | 0.002 |
| chr1:109969365-109969515 | 140 | 0.002 |
| chr1:109969600-109969750 | 1056 | 0.006 |
| chr1:110047745-110047895 | 1755 | 0.009 |
| chr1:110047045-110047195 | 1754 | 0.009 |
| chr1:110042700-110042850 | 1980 | 0.01 |
| chr1:110046620-110046770 | 1605 | 0.015 |
| chr1:110026985-110027135 | 469 | 0.016 |
| chr1:109968580-109968730 | 371 | 0.019 |
| chr1:110021545-110021695 | 455 | 0.019 |
| chr1:109941260-109941410 | 1990 | 0.02 |
External Databases
UCSCEnsembl (ENSG00000143106)