Gene: PARP1
chr1: 226548391-226595774Expression Profile
(log scale)
Graphical Connections
Distribution of linked clusters:
You may find it interesting if many of the connected DHS sites belong to the same cluster.| Cluster Profile | Cluster ID | Number of DHS sites in this cluster |
|---|---|---|
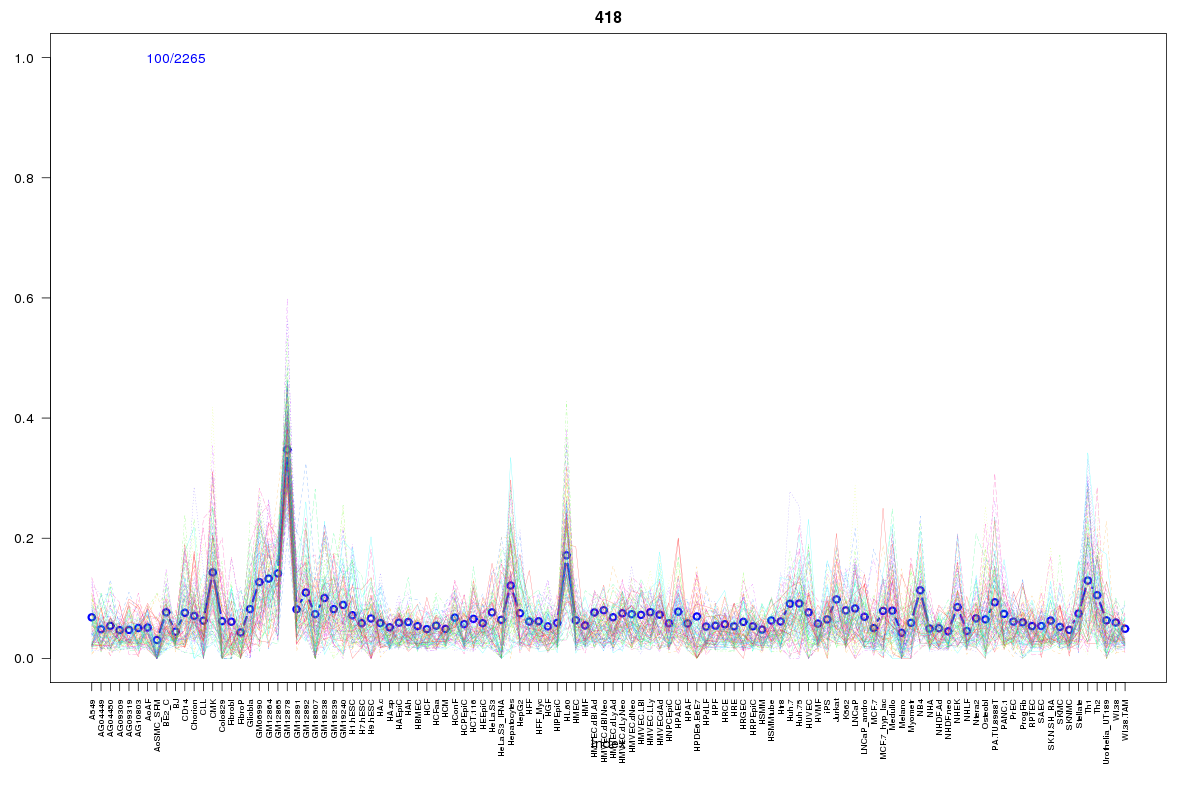 | 418 | 3 |
 | 66 | 2 |
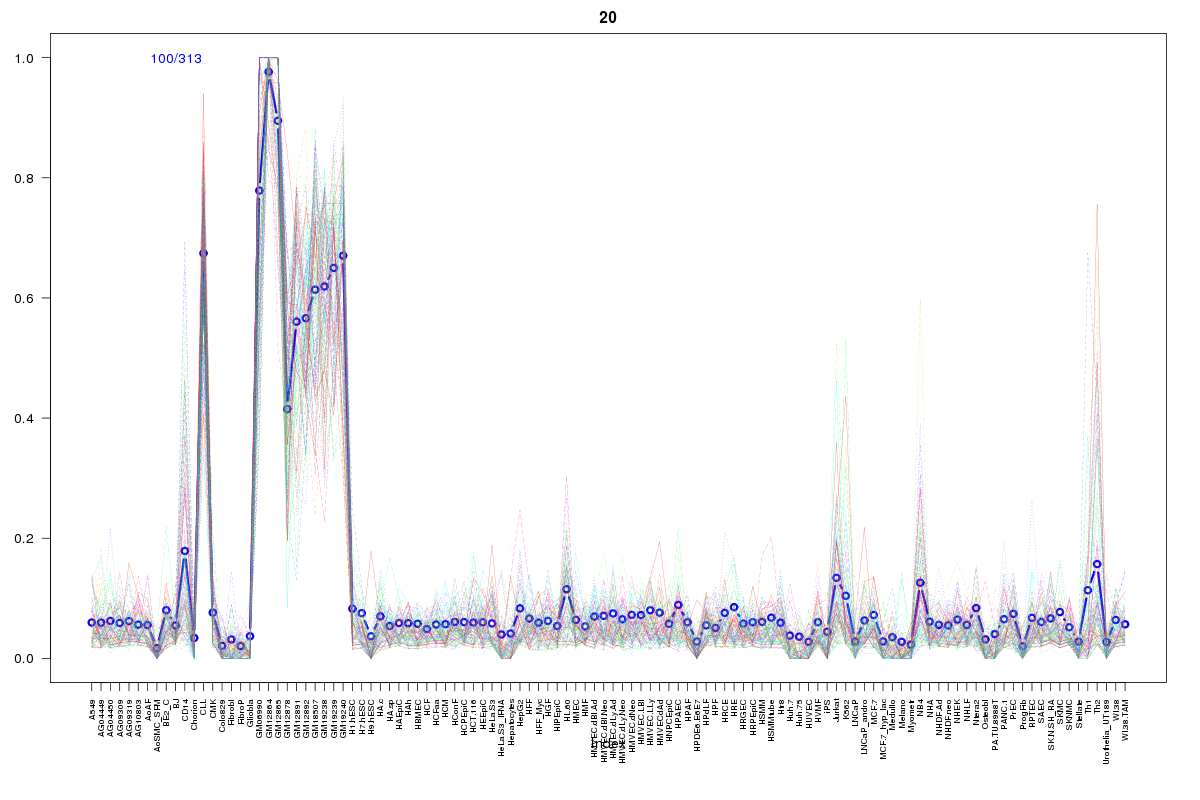 | 20 | 1 |
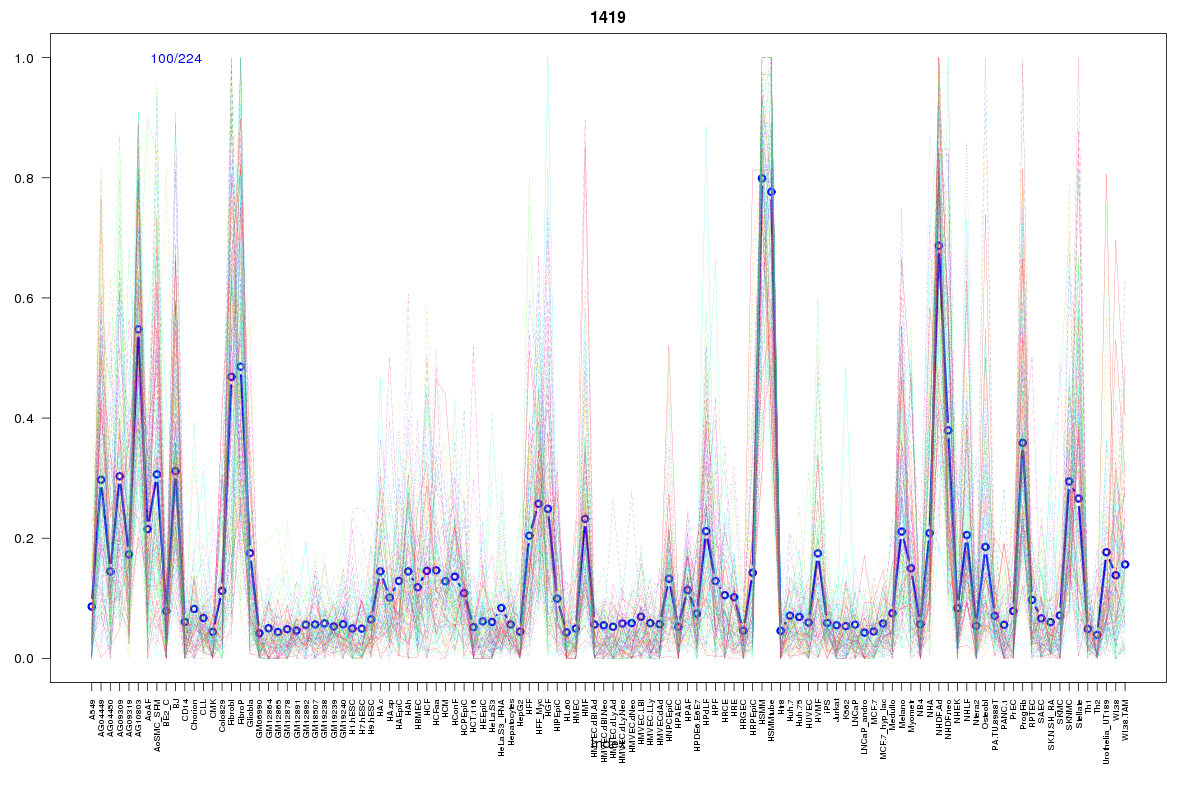 | 1419 | 1 |
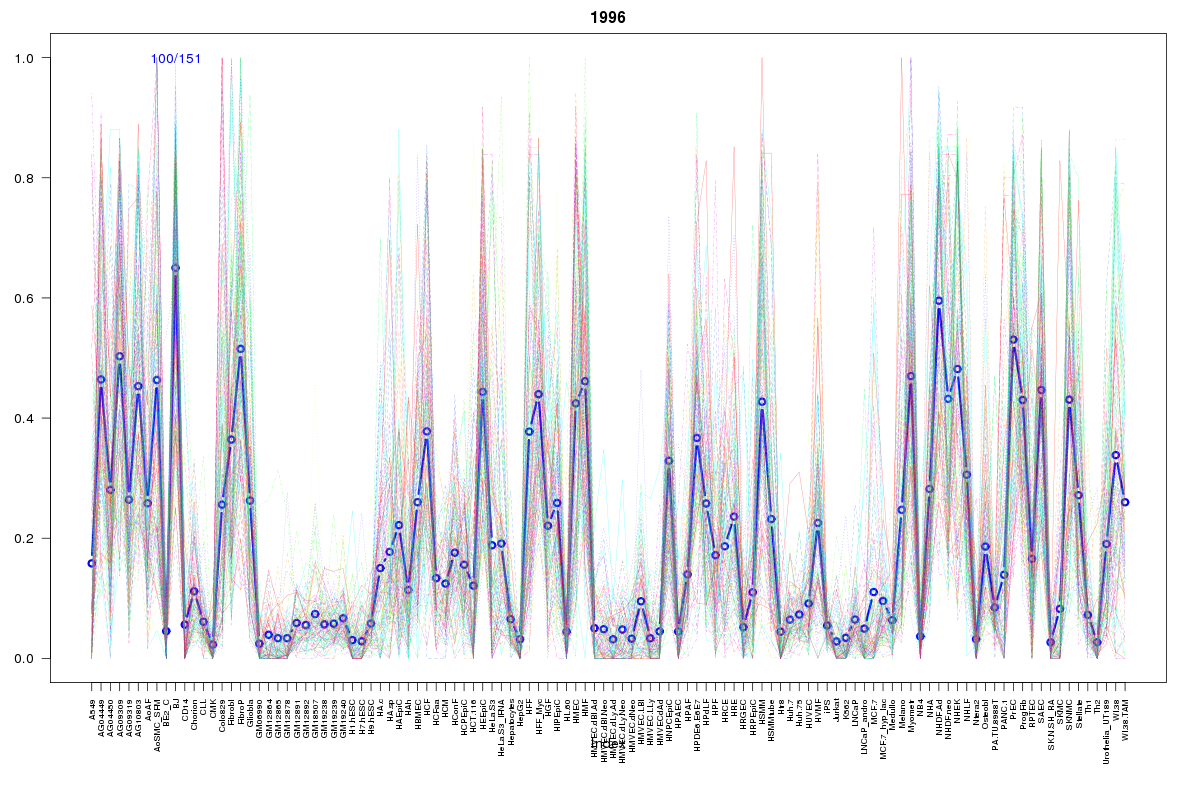 | 1996 | 1 |
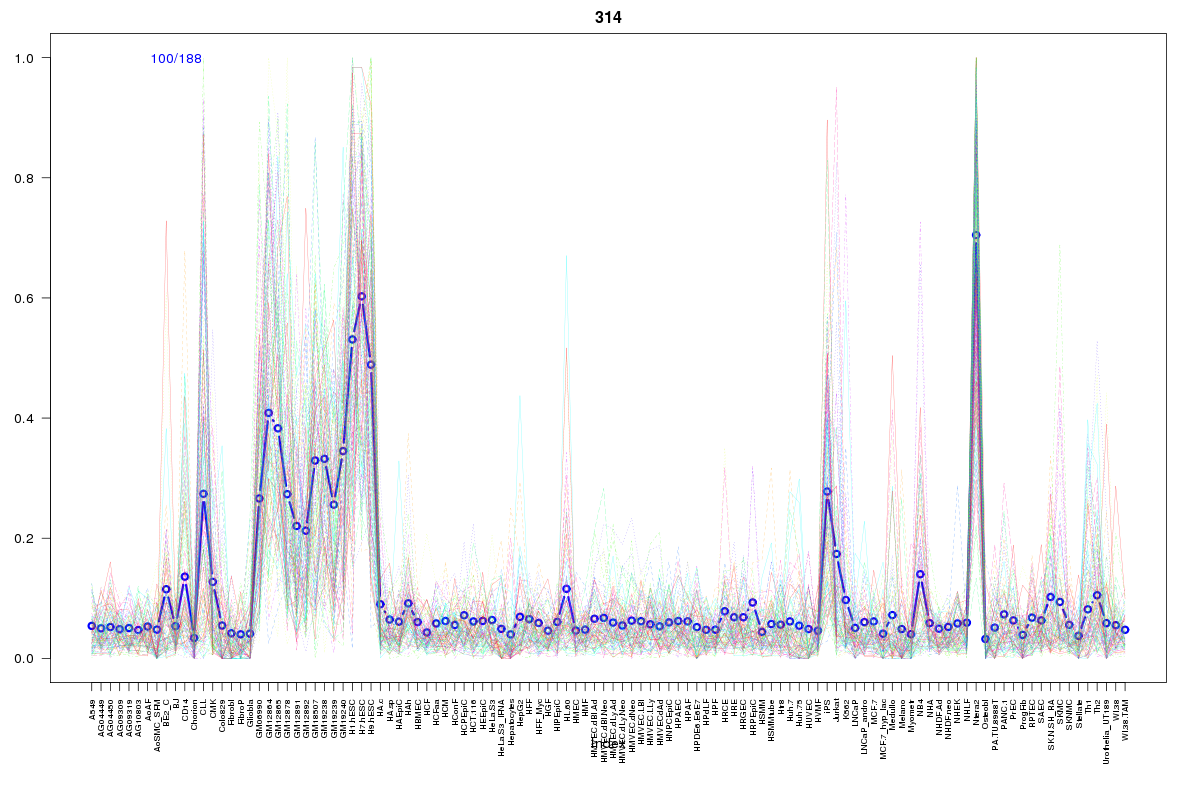 | 314 | 1 |
 | 2211 | 1 |
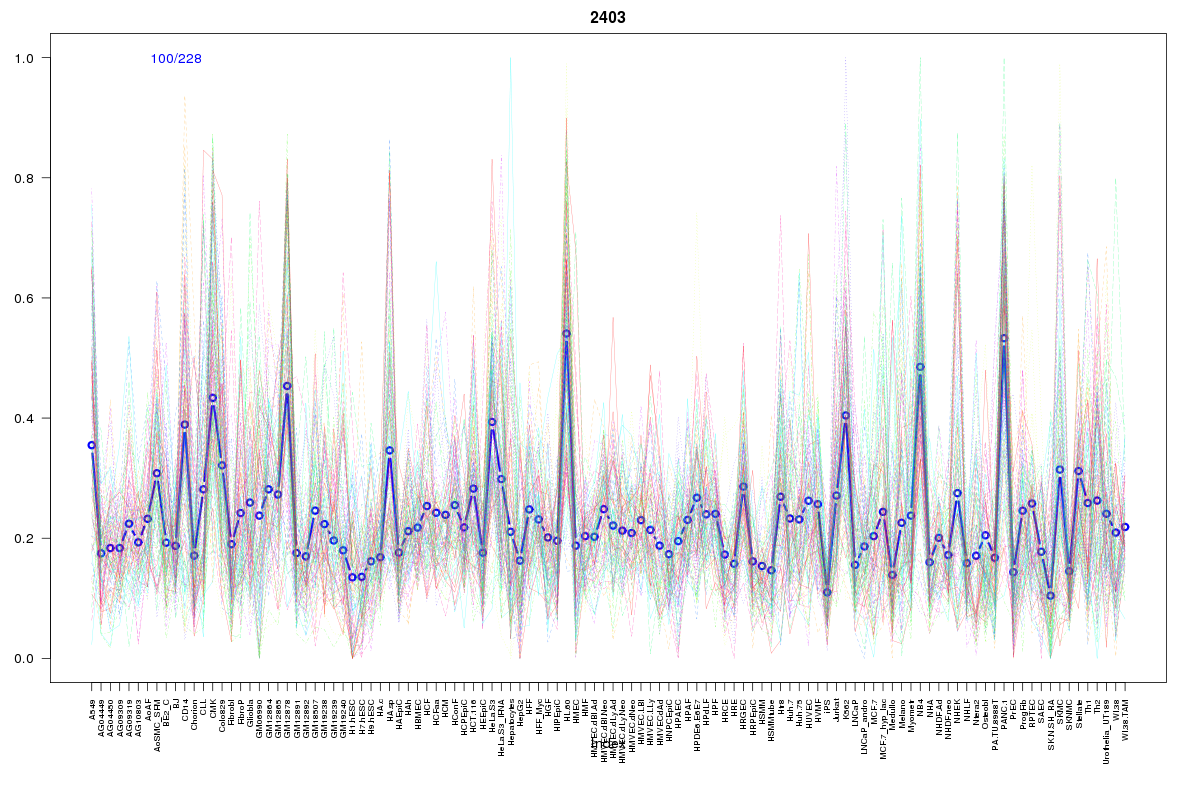 | 2403 | 1 |
 | 615 | 1 |
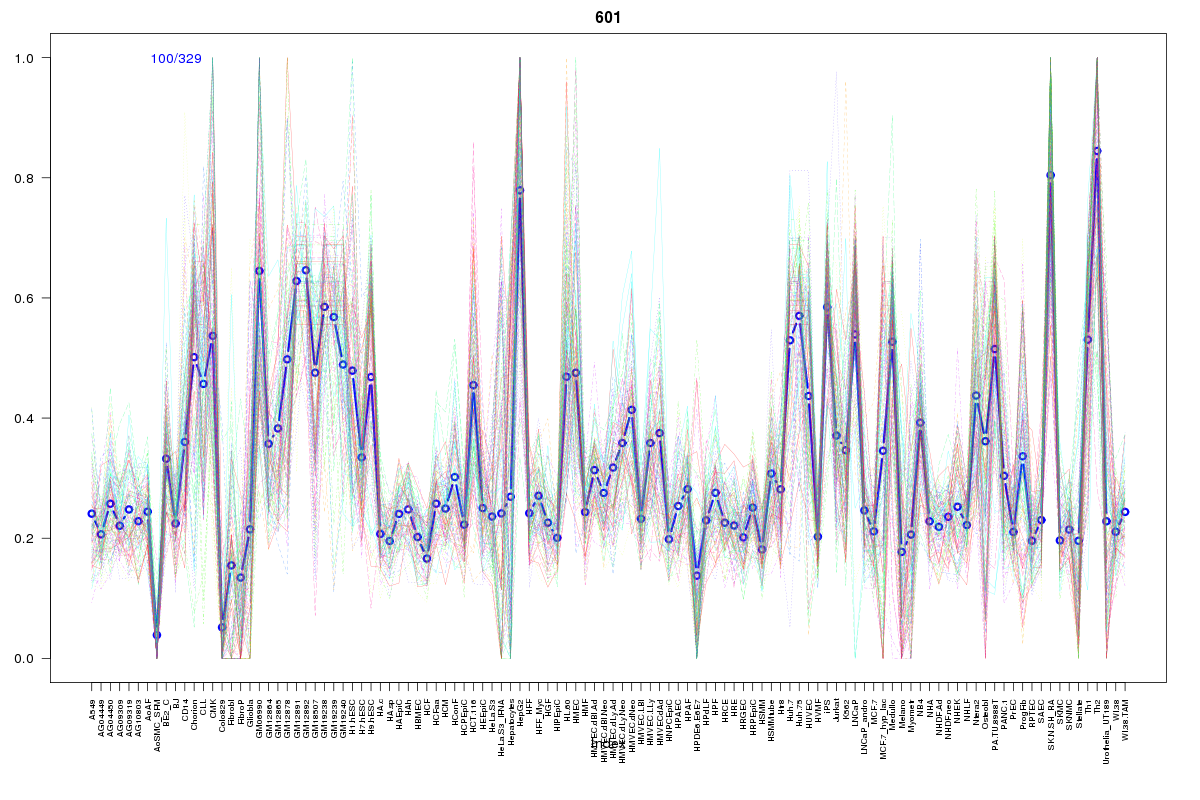 | 601 | 1 |
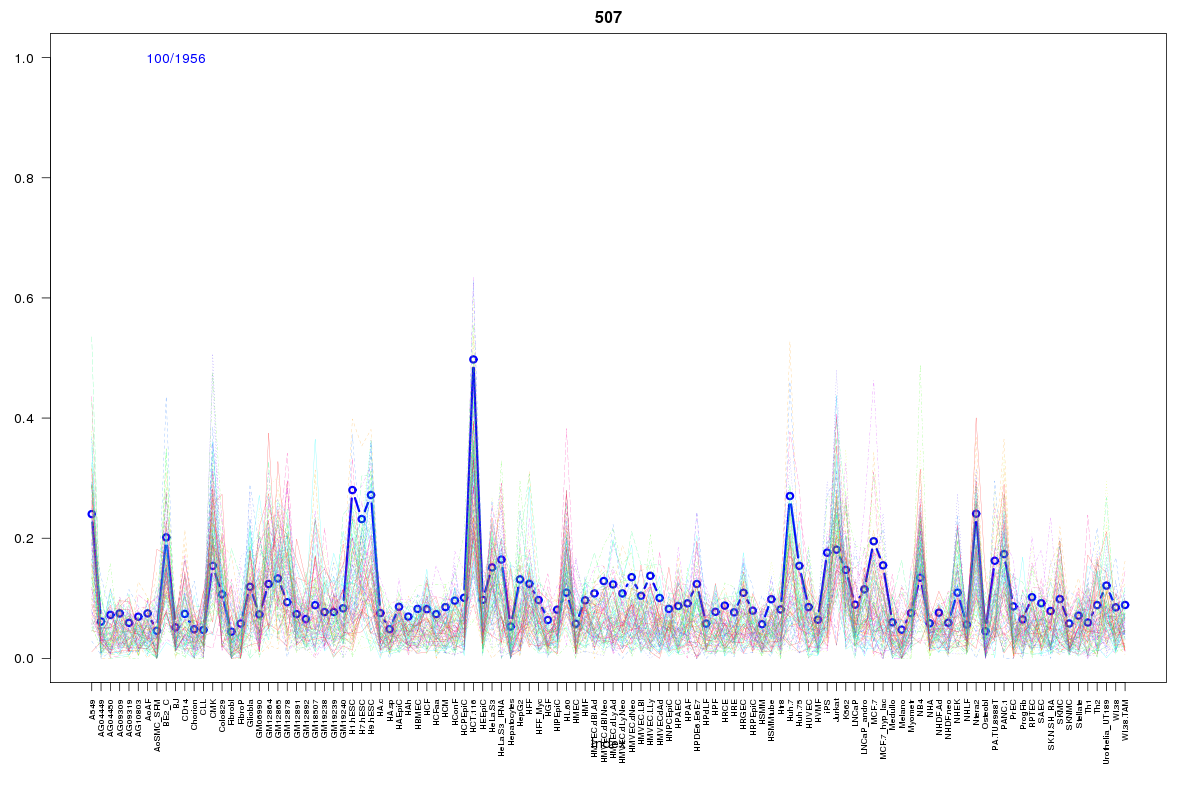 | 507 | 1 |
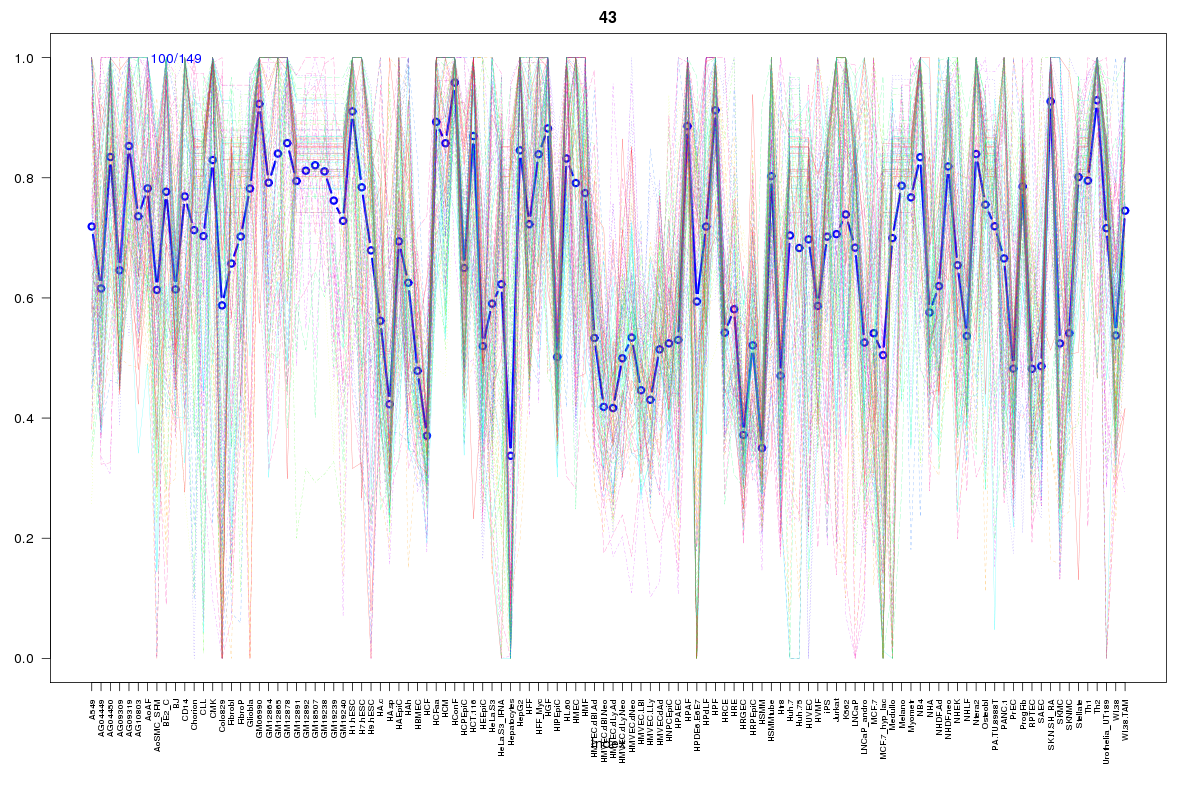 | 43 | 1 |
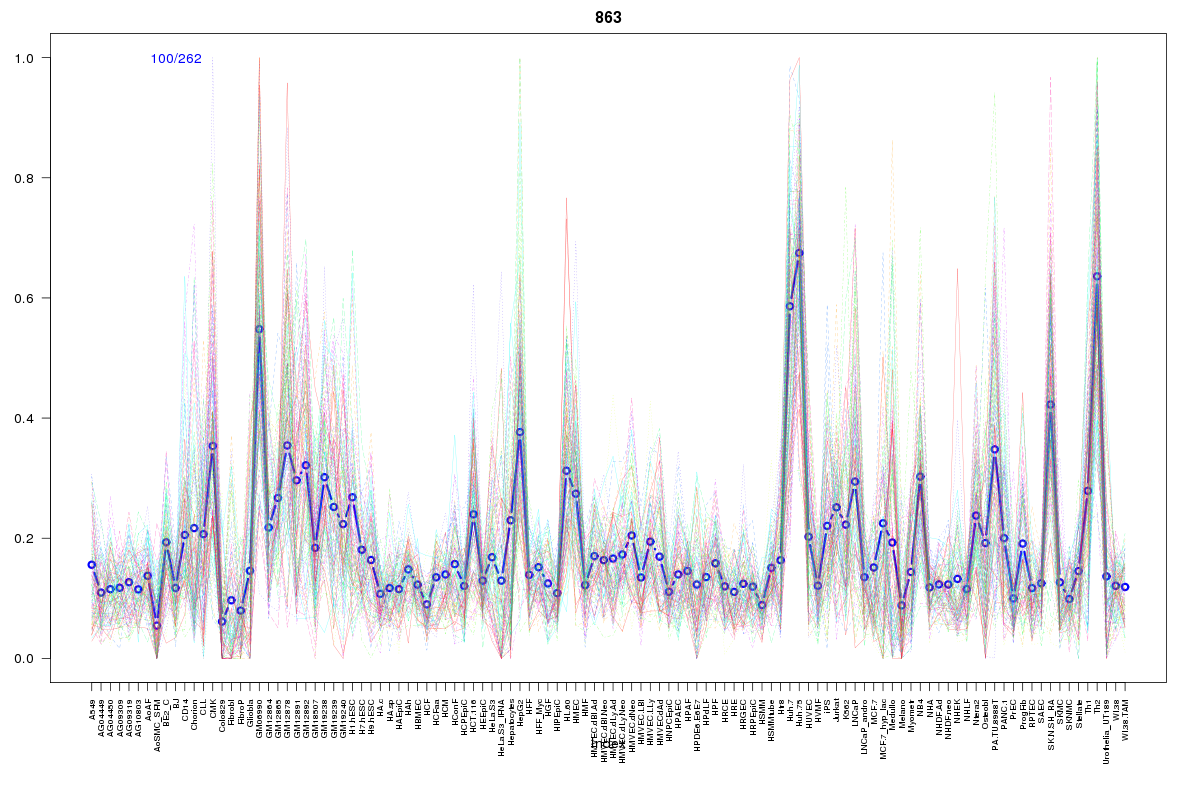 | 863 | 1 |
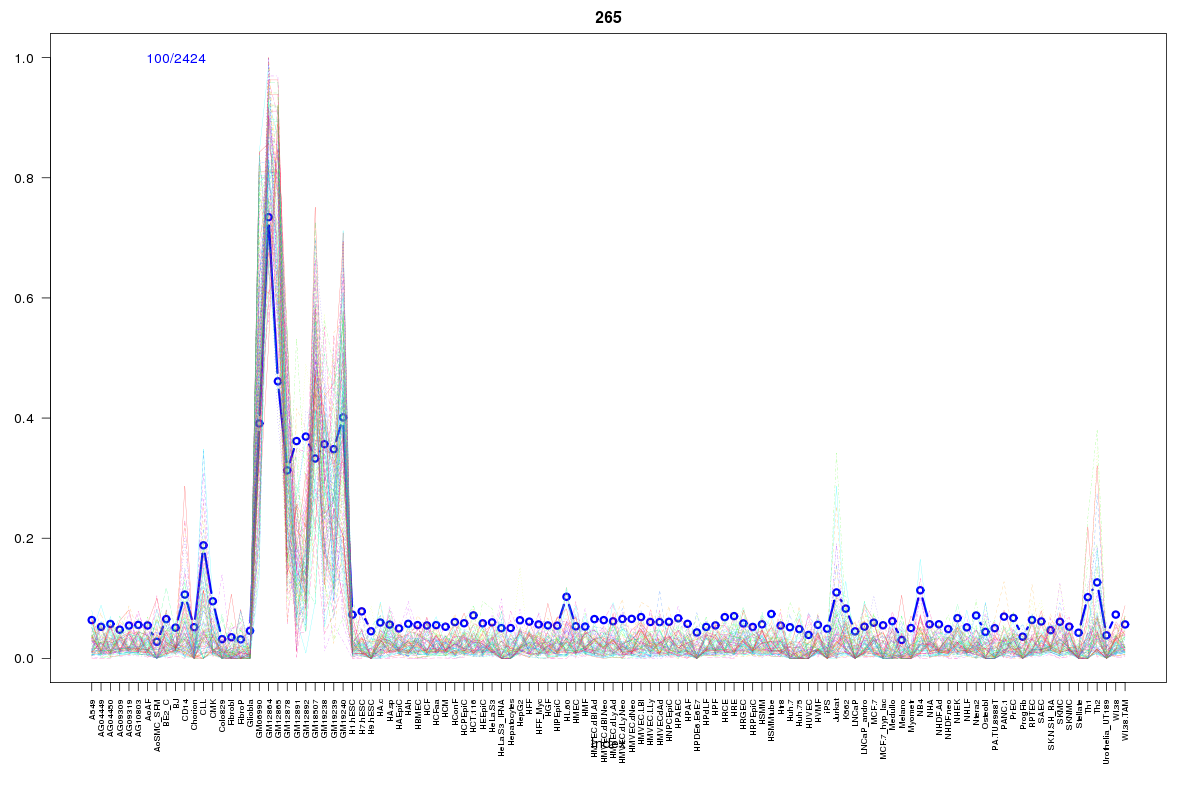 | 265 | 1 |
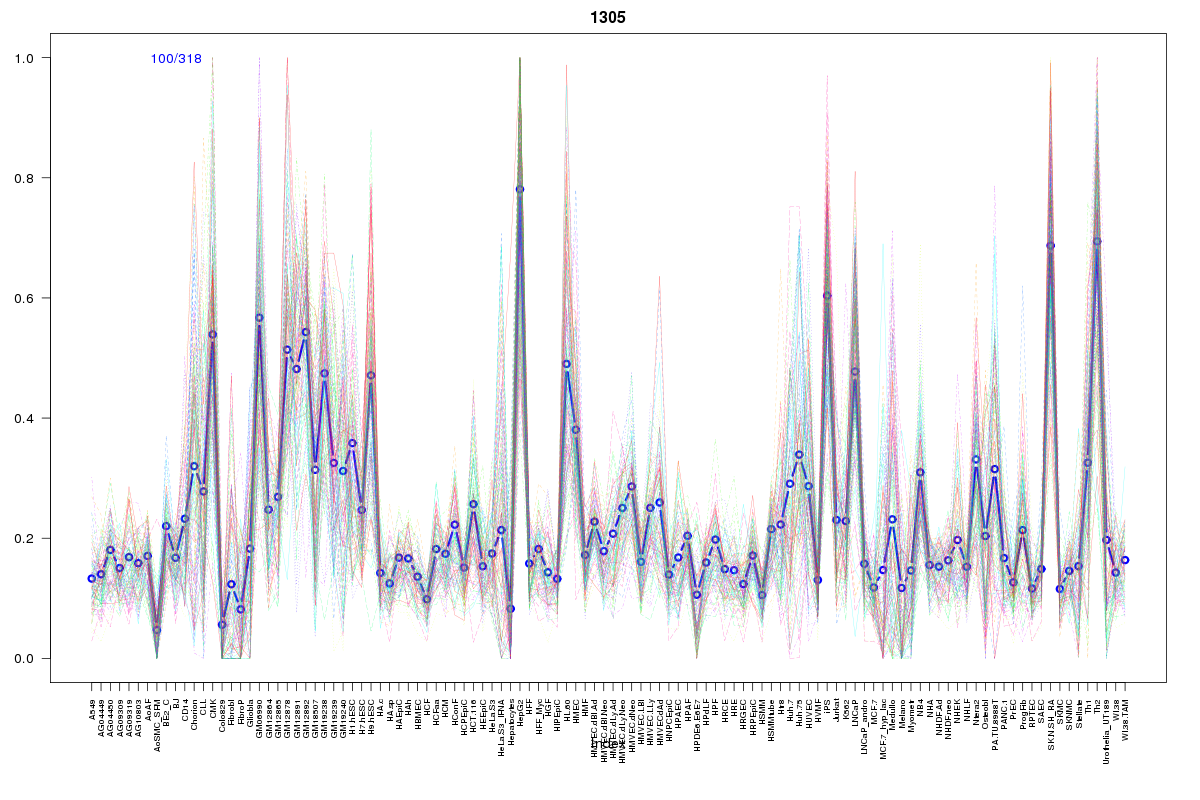 | 1305 | 1 |
 | 2063 | 1 |
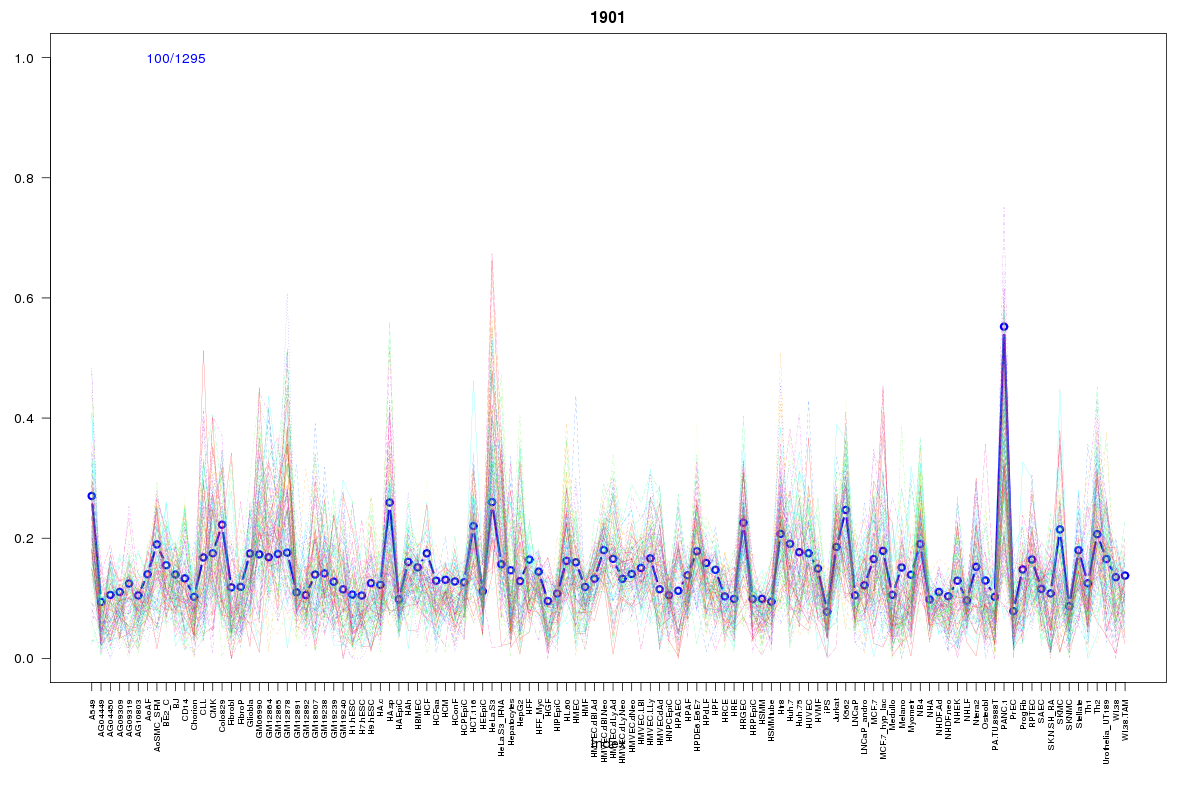 | 1901 | 1 |
 | 2114 | 1 |
 | 293 | 1 |
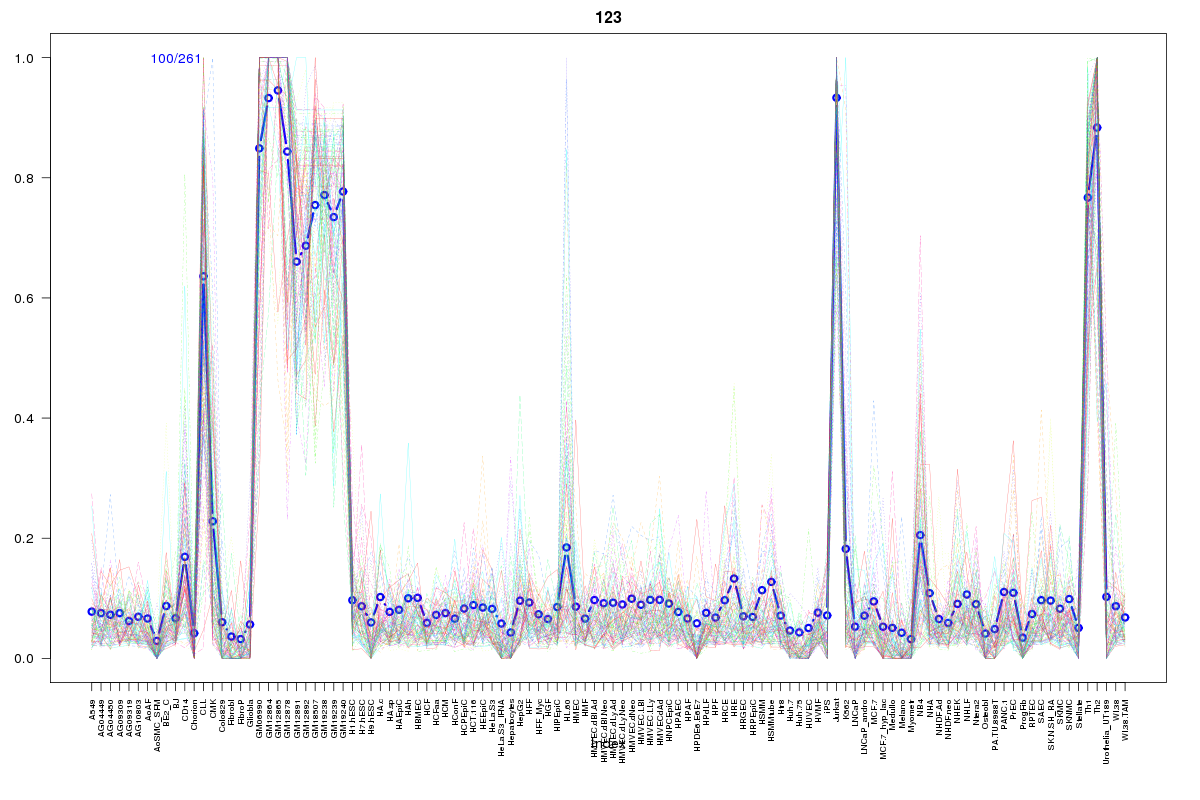 | 123 | 1 |
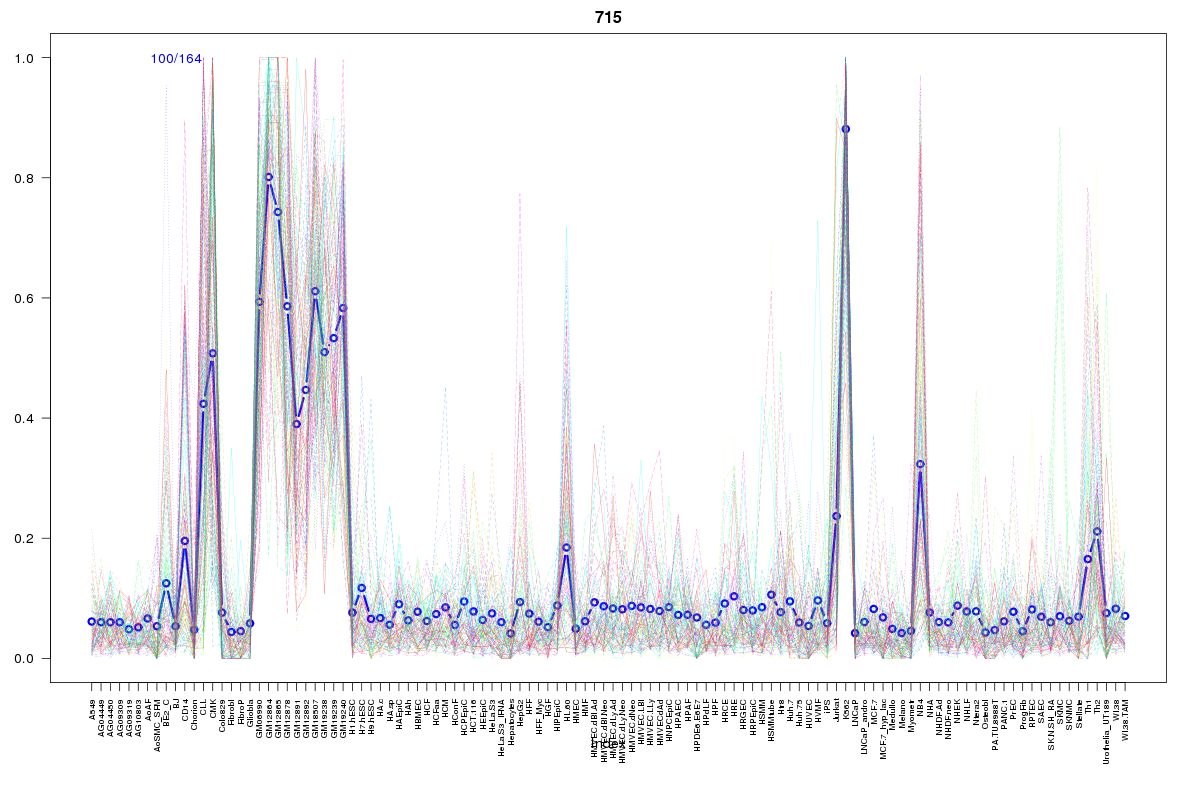 | 715 | 1 |
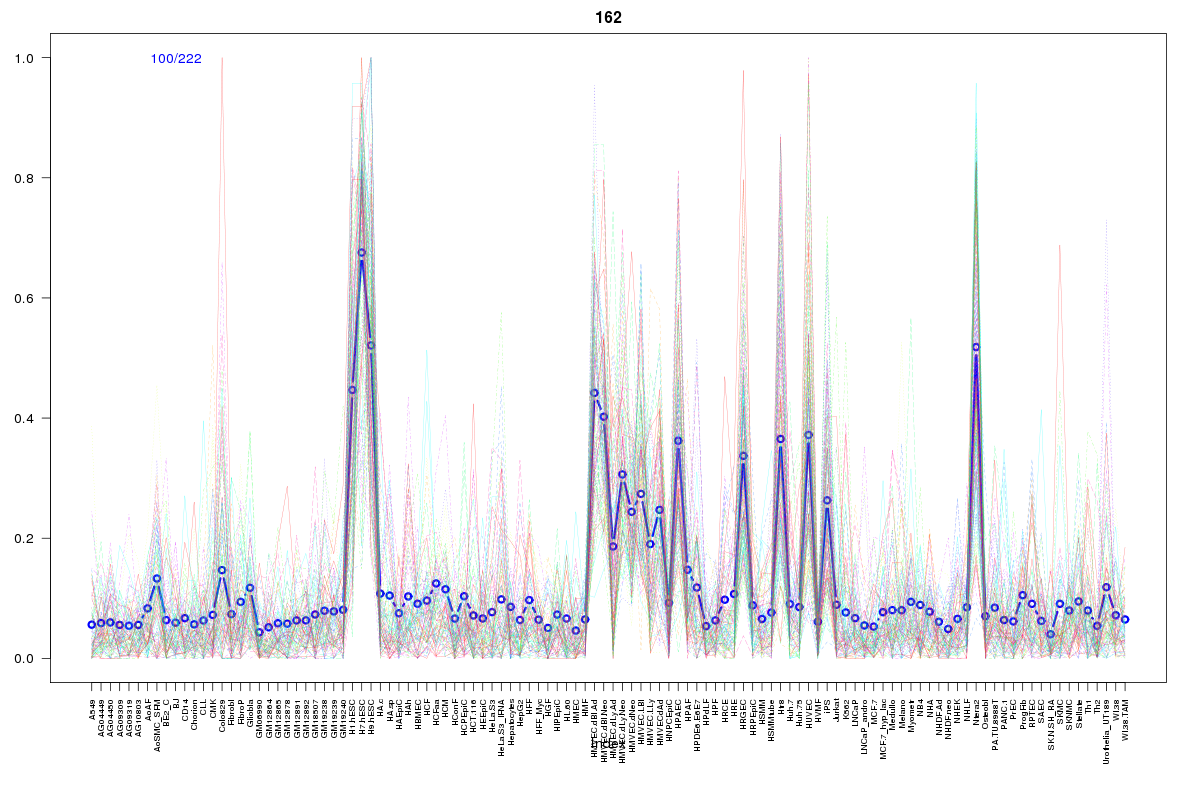 | 162 | 1 |
 | 220 | 1 |
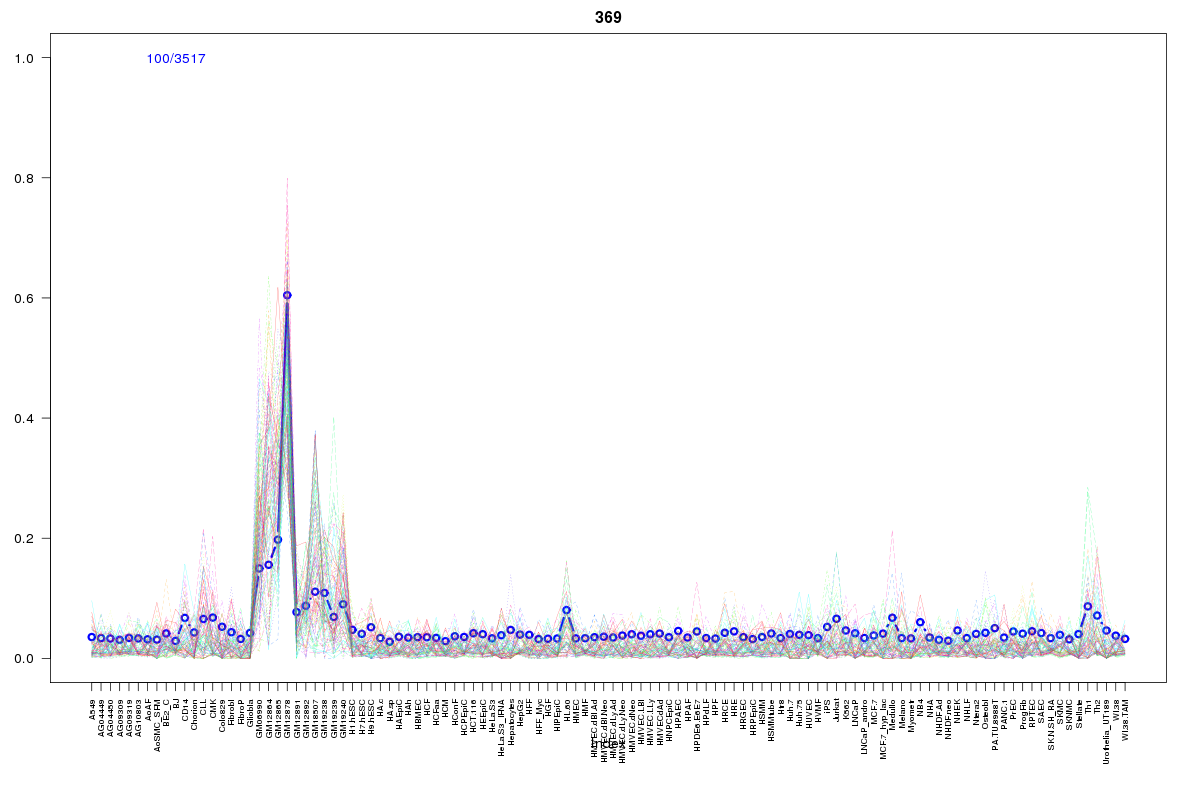 | 369 | 1 |
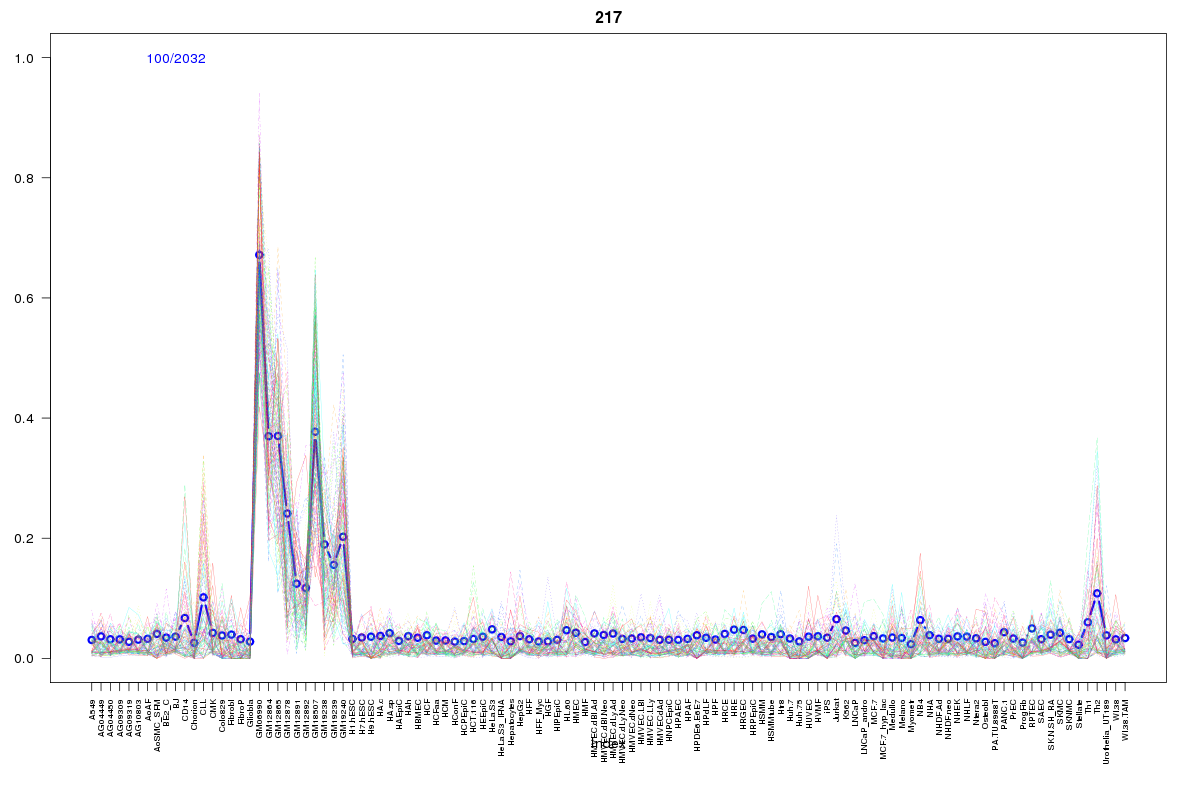 | 217 | 1 |
Resources
BED file downloads
Connects to 28 DHS sitesTop 10 Correlated DHS Sites
p-values indiciate significant higher or lower correlation| Location | Cluster | P-value |
|---|---|---|
| chr1:226521180-226521330 | 293 | 0 |
| chr1:226593240-226593390 | 314 | 0.002 |
| chr1:226632800-226632950 | 123 | 0.002 |
| chr1:226595920-226596070 | 43 | 0.002 |
| chr1:226537760-226537910 | 715 | 0.002 |
| chr1:226595380-226595530 | 601 | 0.002 |
| chr1:226495945-226496095 | 507 | 0.003 |
| chr1:226496145-226496295 | 863 | 0.003 |
| chr1:226613140-226613290 | 265 | 0.005 |
| chr1:226594765-226594915 | 418 | 0.007 |
| chr1:226613360-226613510 | 2063 | 0.009 |
External Databases
UCSCEnsembl (ENSG00000143799)