Gene: ANAPC1
chr2: 112523847-112614424Expression Profile
(log scale)
Graphical Connections
Distribution of linked clusters:
You may find it interesting if many of the connected DHS sites belong to the same cluster.| Cluster Profile | Cluster ID | Number of DHS sites in this cluster |
|---|---|---|
 | 10 | 4 |
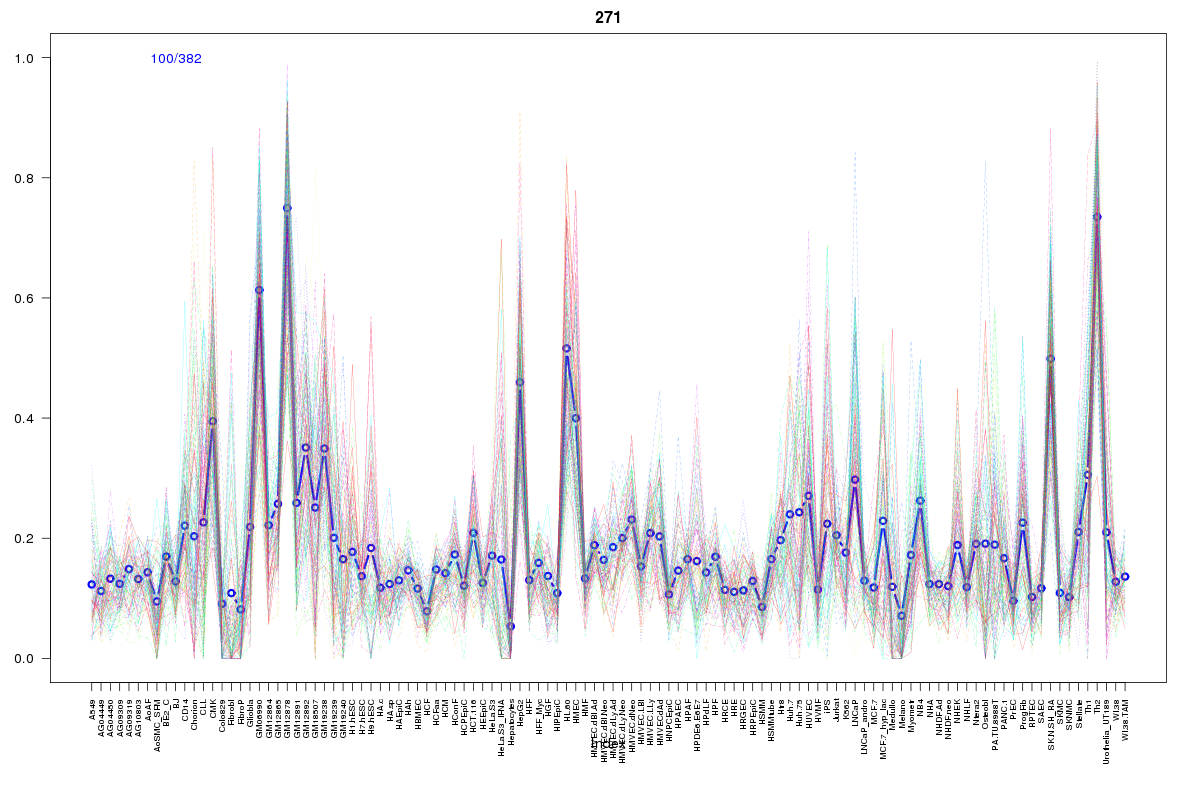 | 271 | 2 |
 | 2114 | 2 |
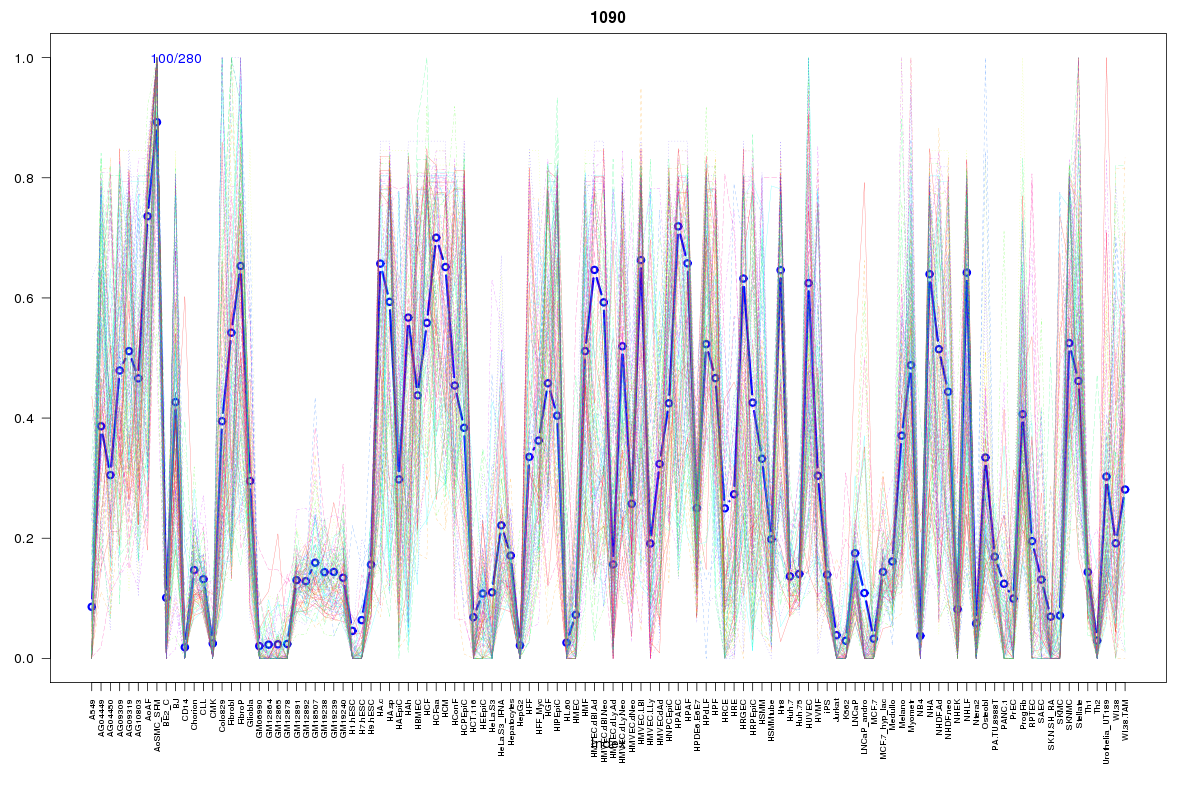 | 1090 | 2 |
 | 89 | 2 |
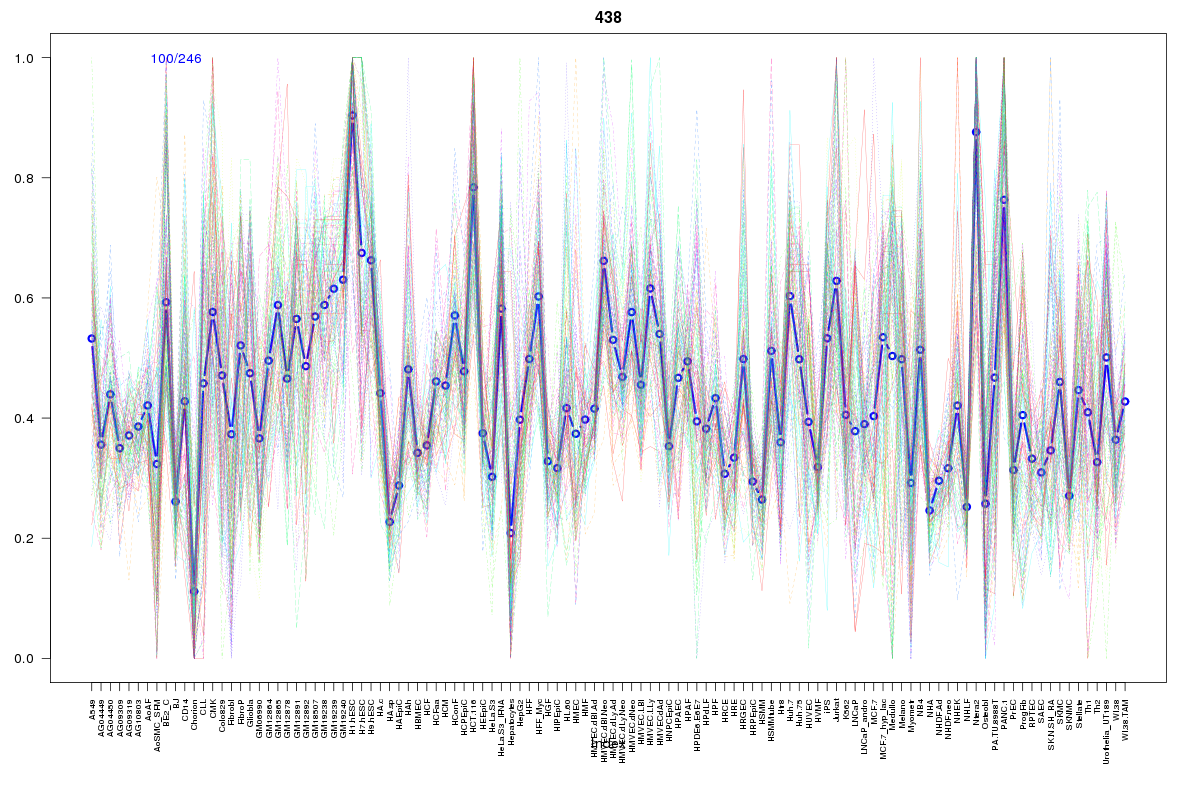 | 438 | 1 |
 | 421 | 1 |
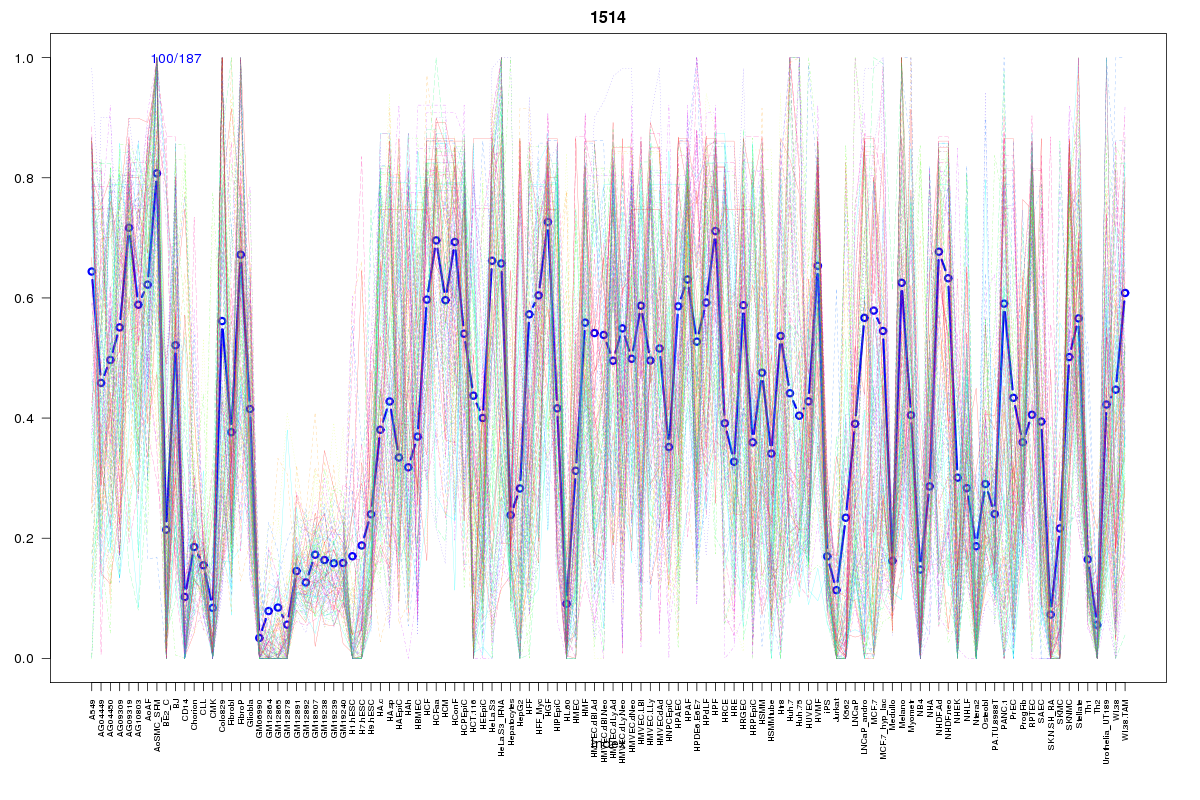 | 1514 | 1 |
 | 1639 | 1 |
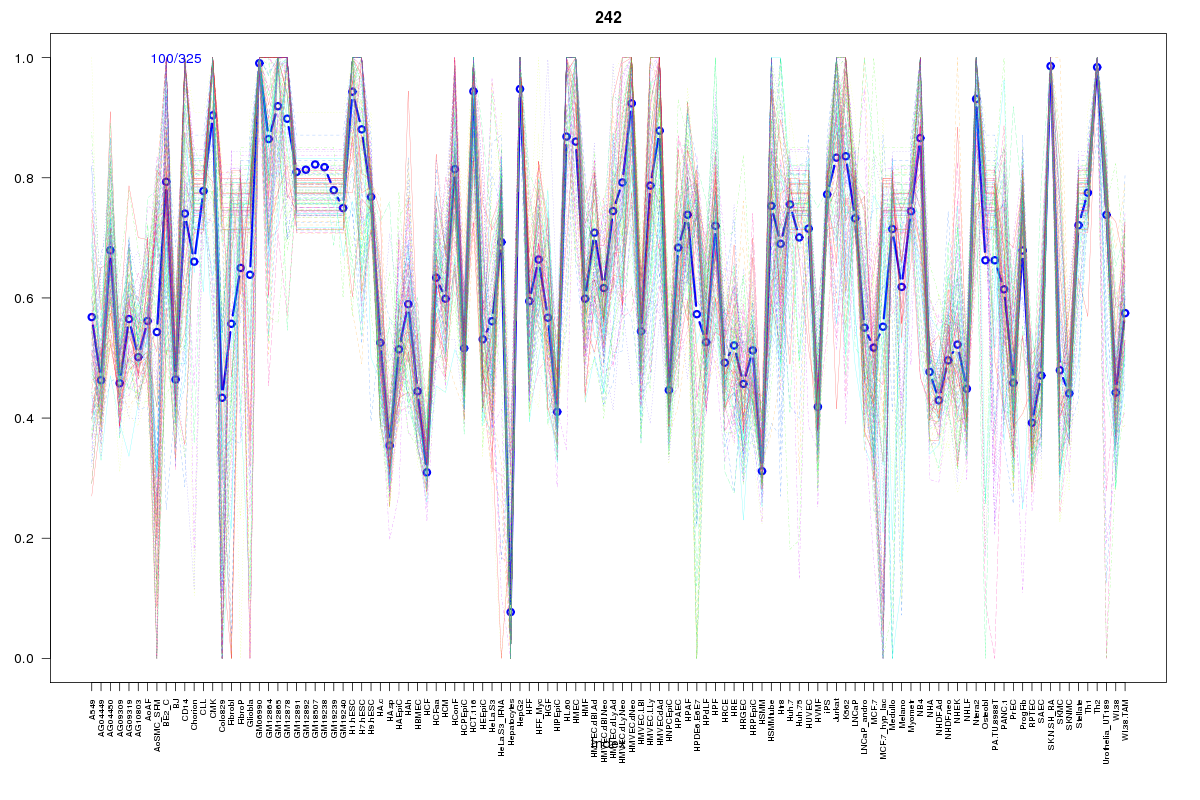 | 242 | 1 |
 | 282 | 1 |
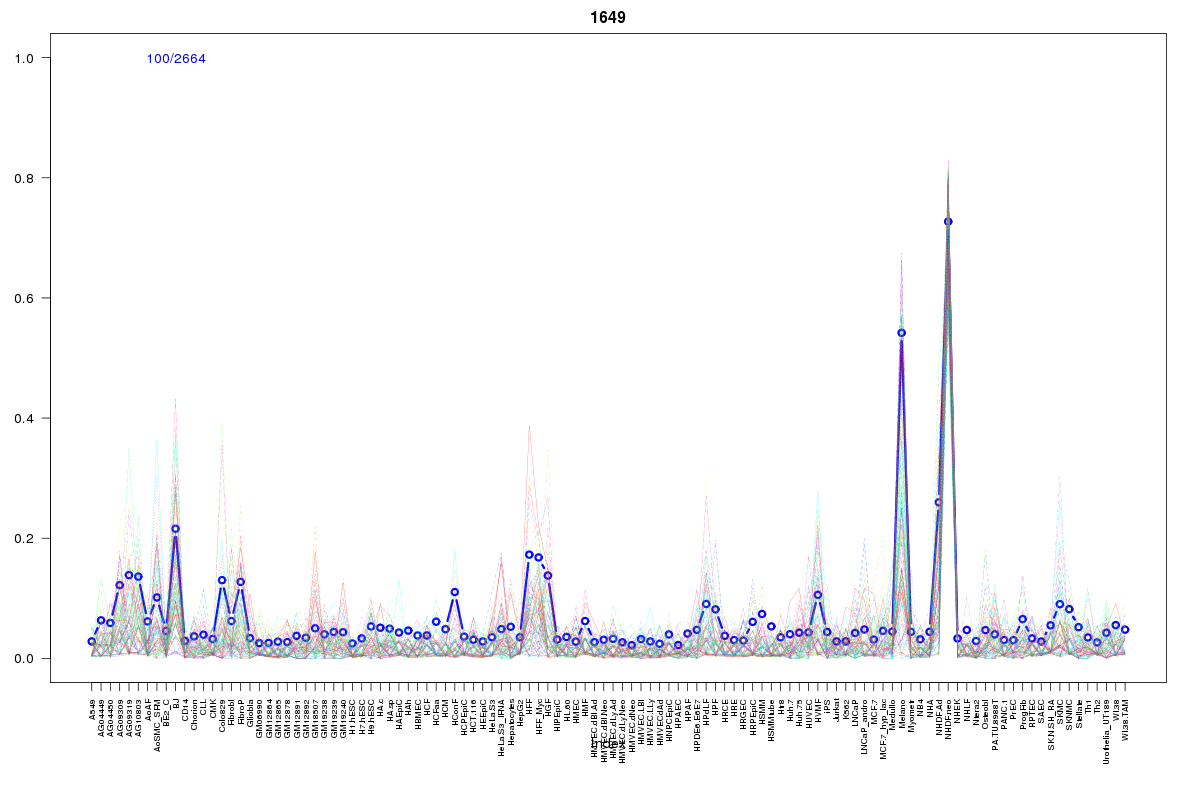 | 1649 | 1 |
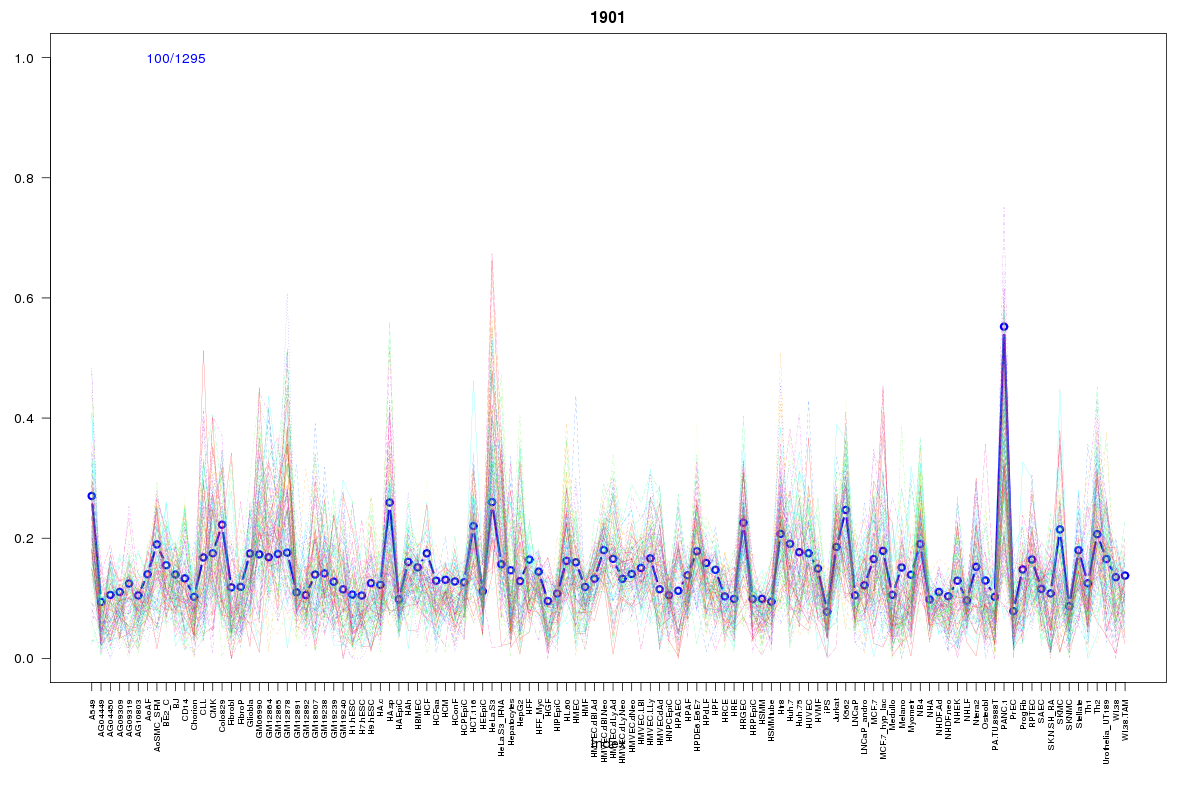 | 1901 | 1 |
 | 615 | 1 |
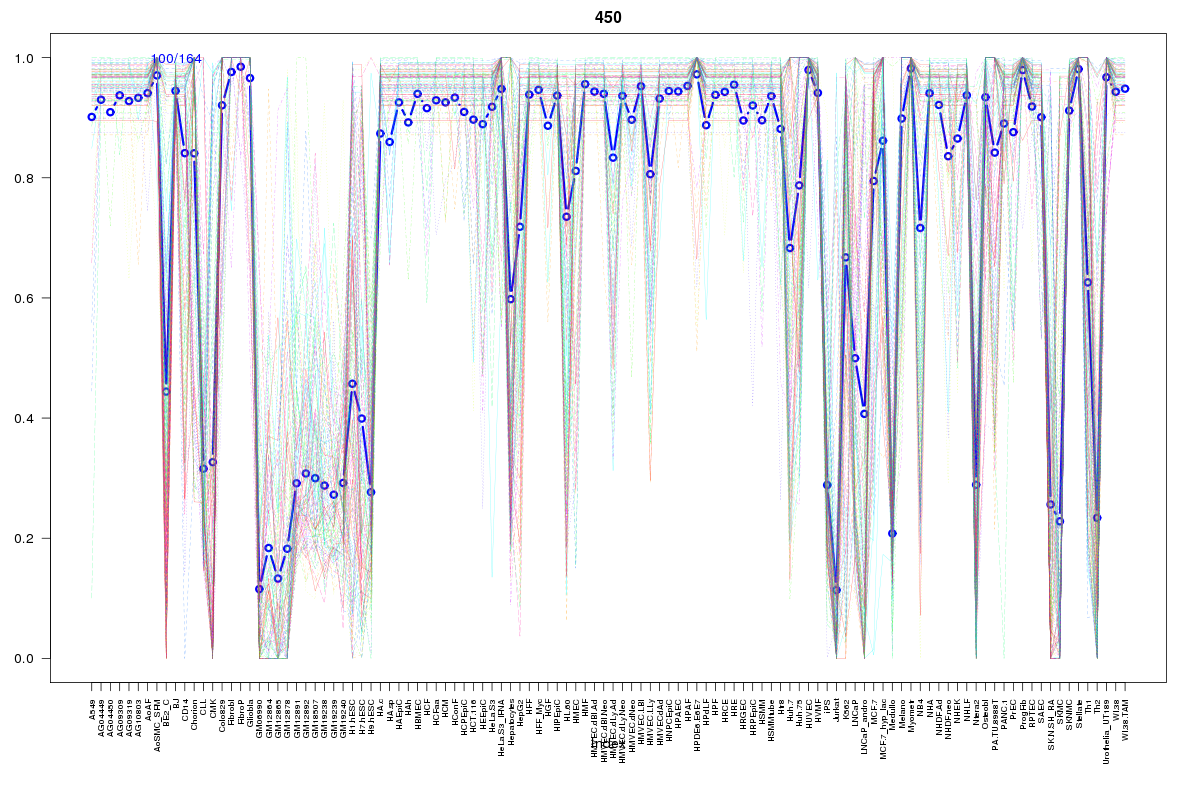 | 450 | 1 |
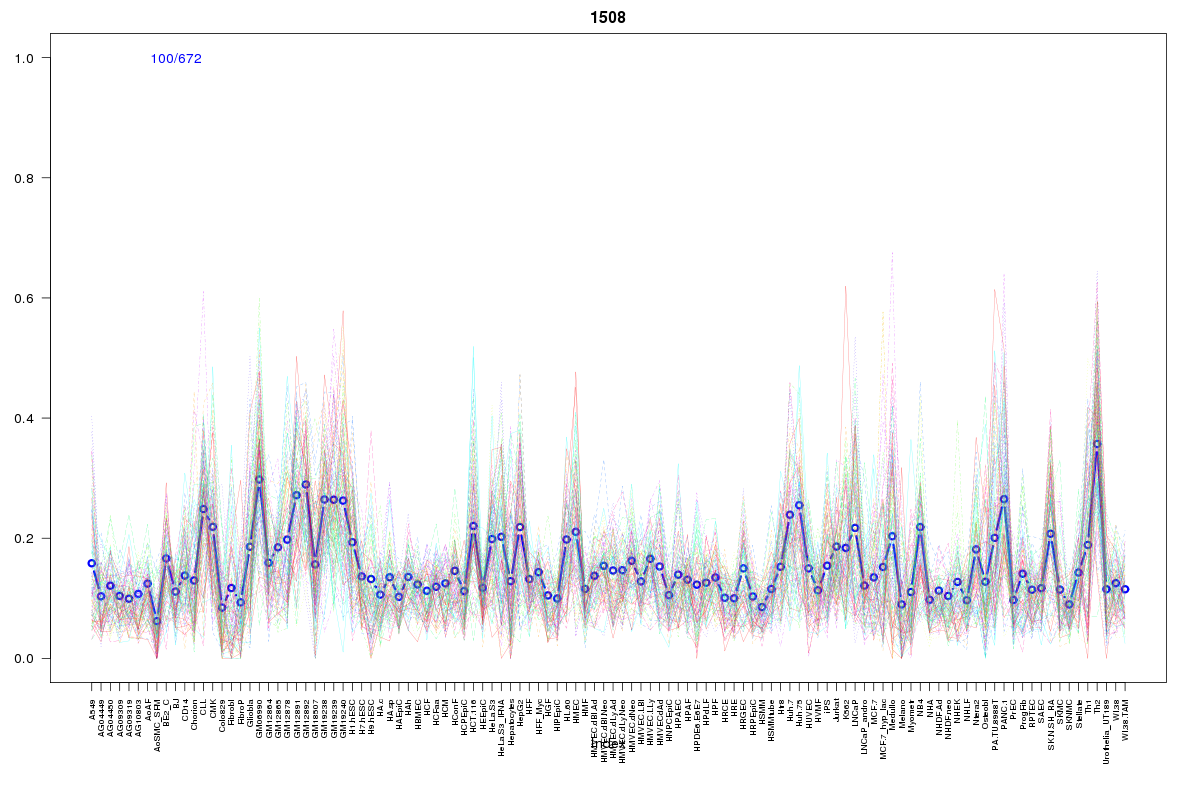 | 1508 | 1 |
 | 2110 | 1 |
 | 2212 | 1 |
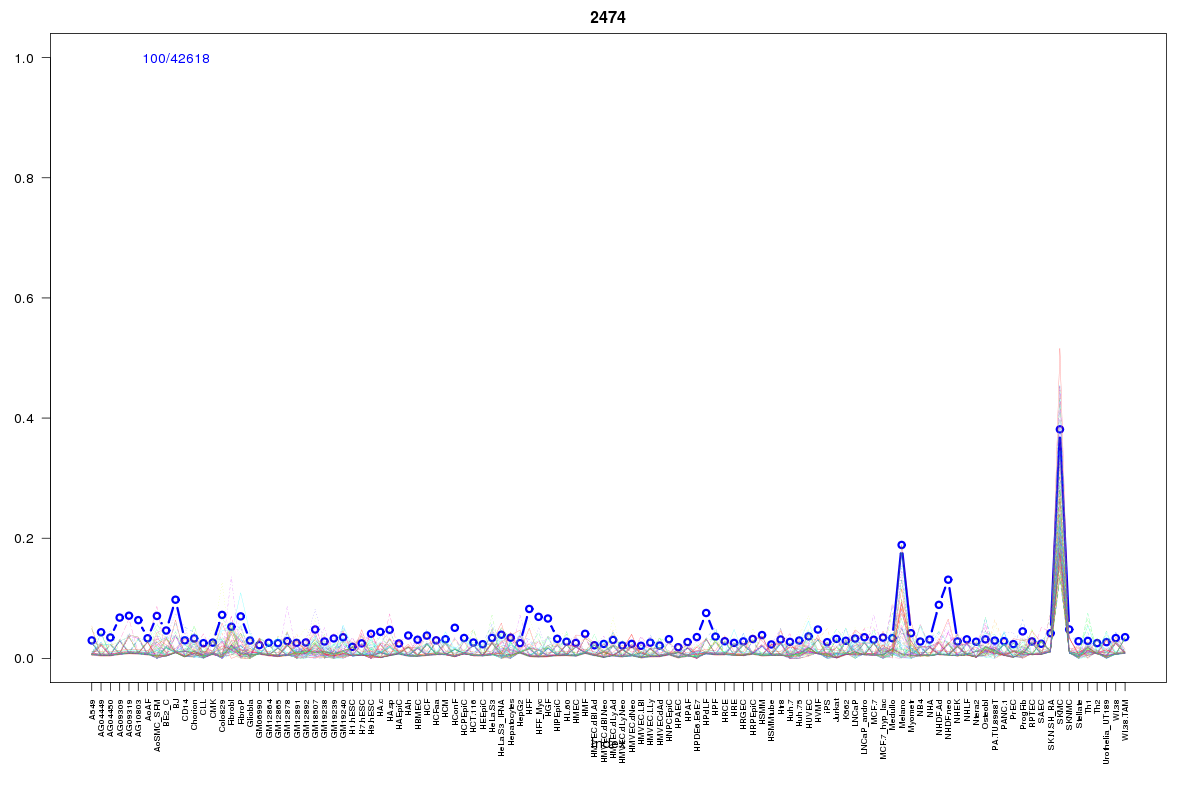 | 2474 | 1 |
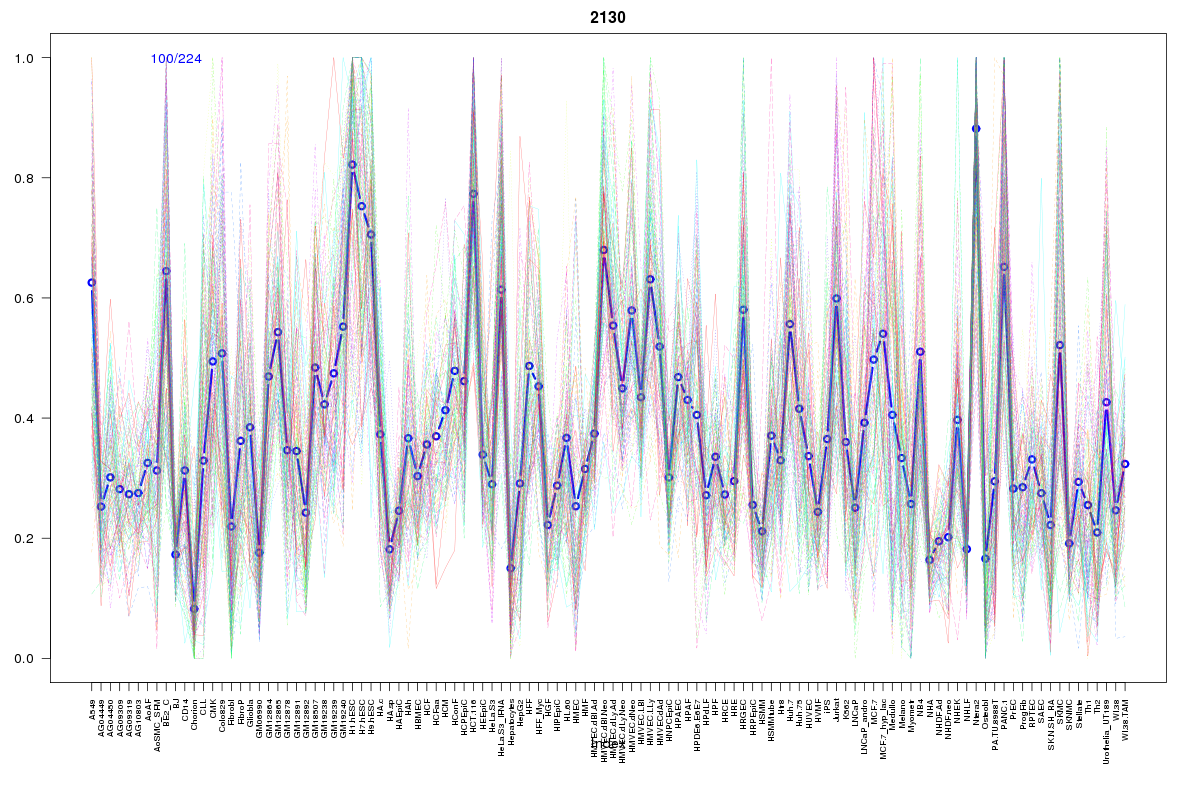 | 2130 | 1 |
 | 860 | 1 |
 | 1970 | 1 |
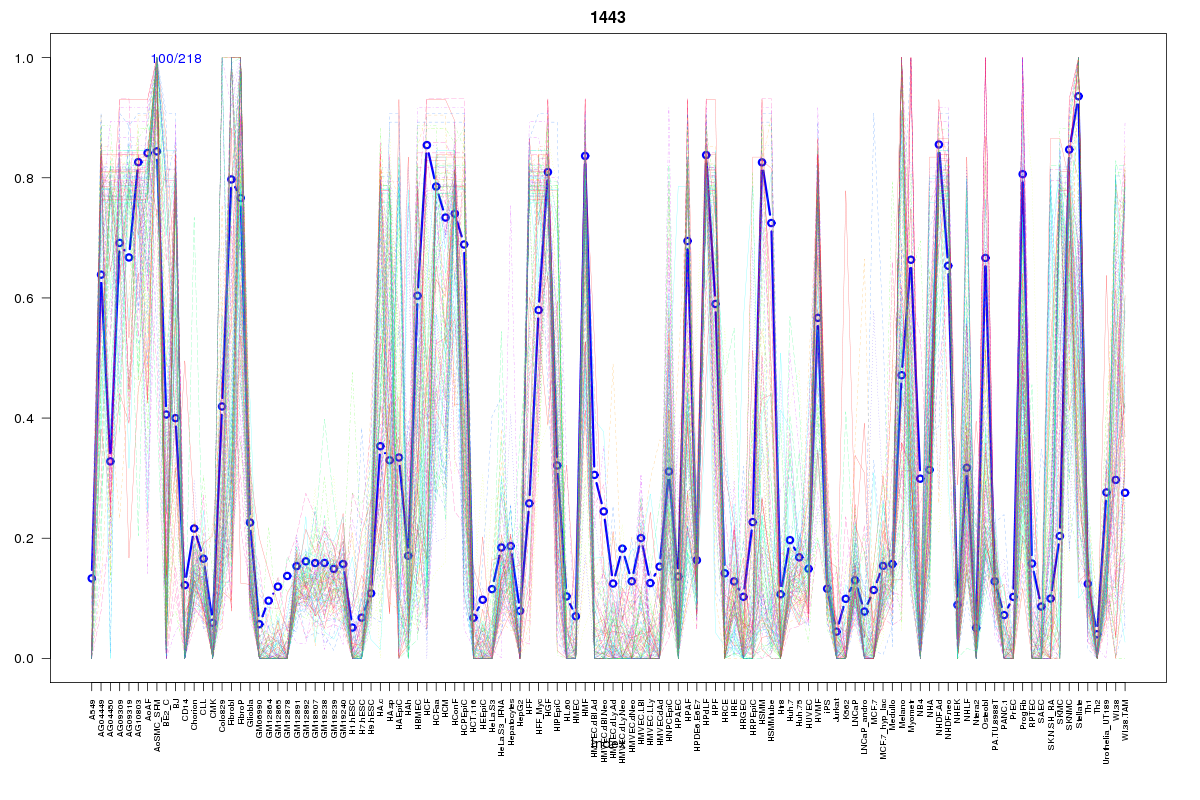 | 1443 | 1 |
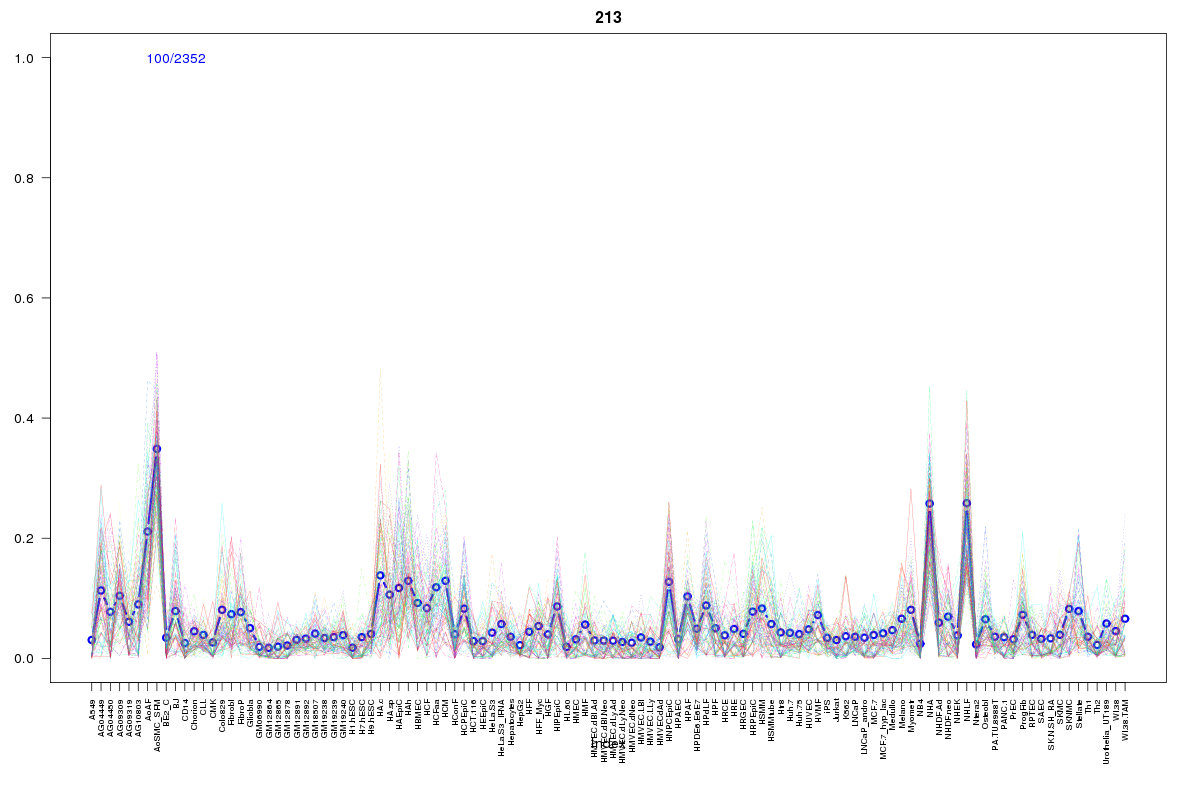 | 213 | 1 |
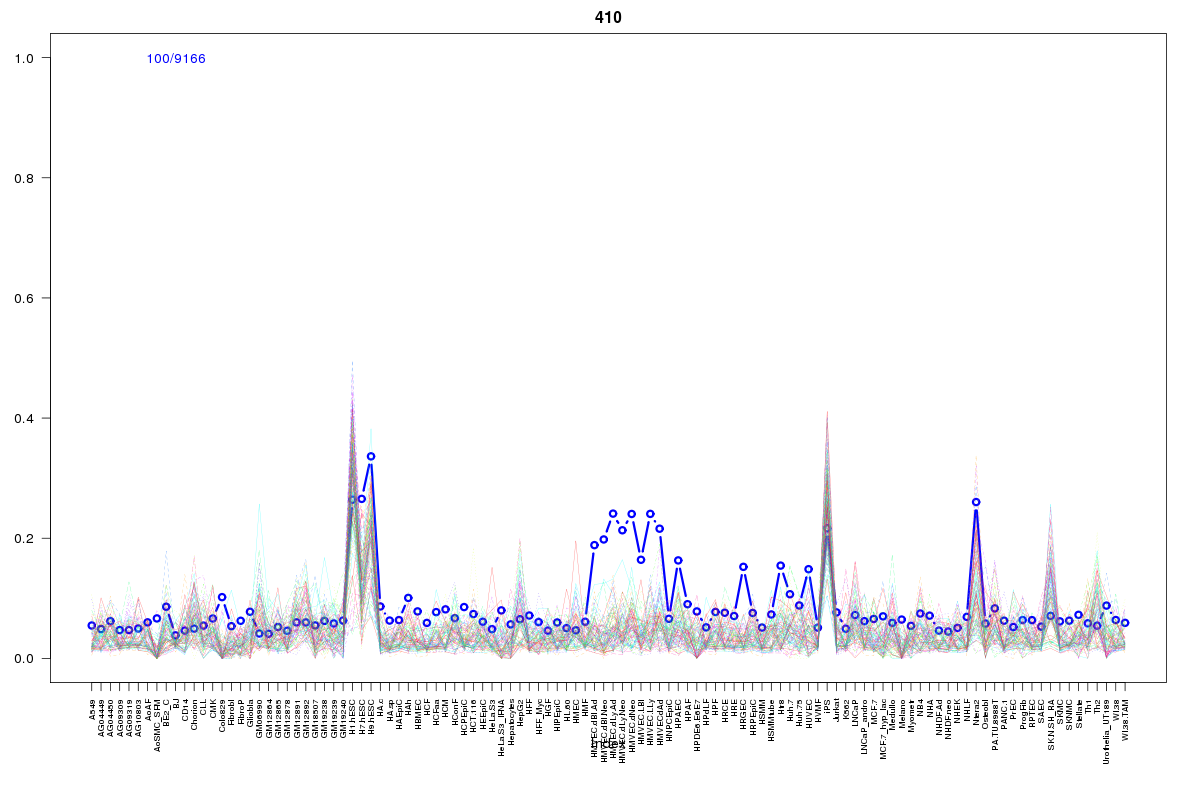 | 410 | 1 |
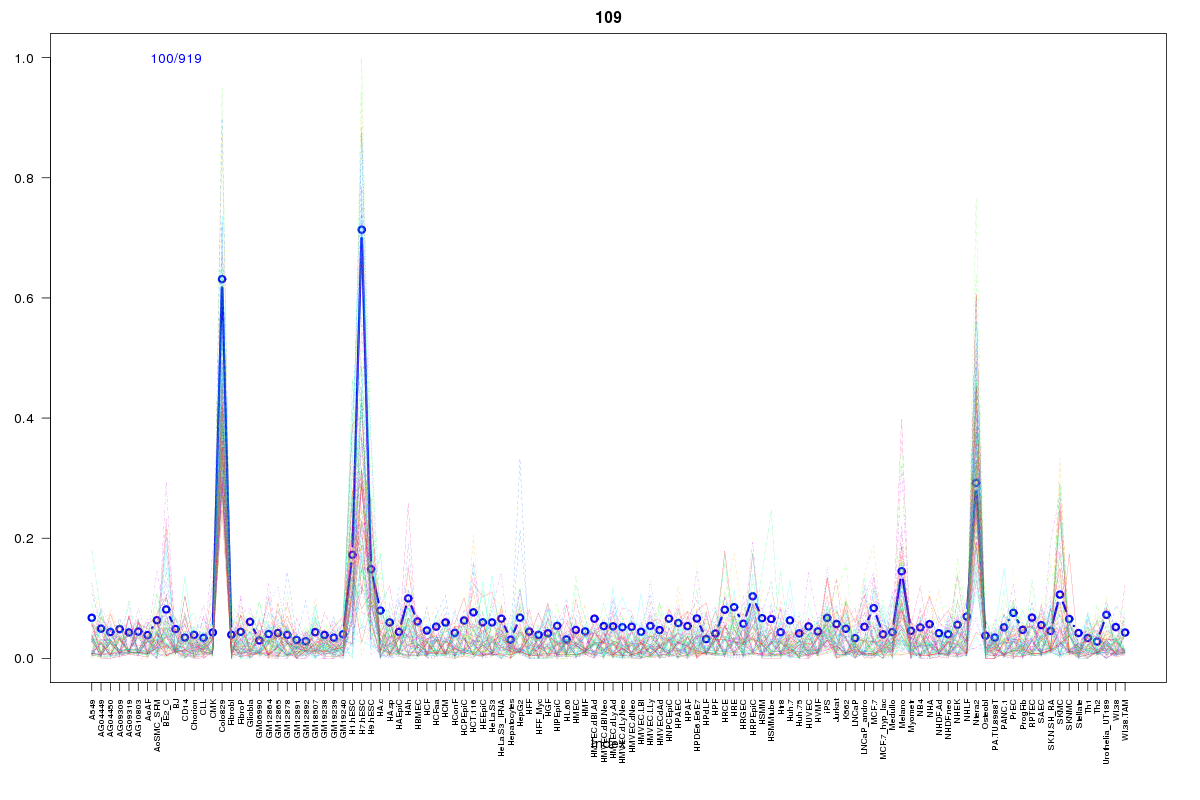 | 109 | 1 |
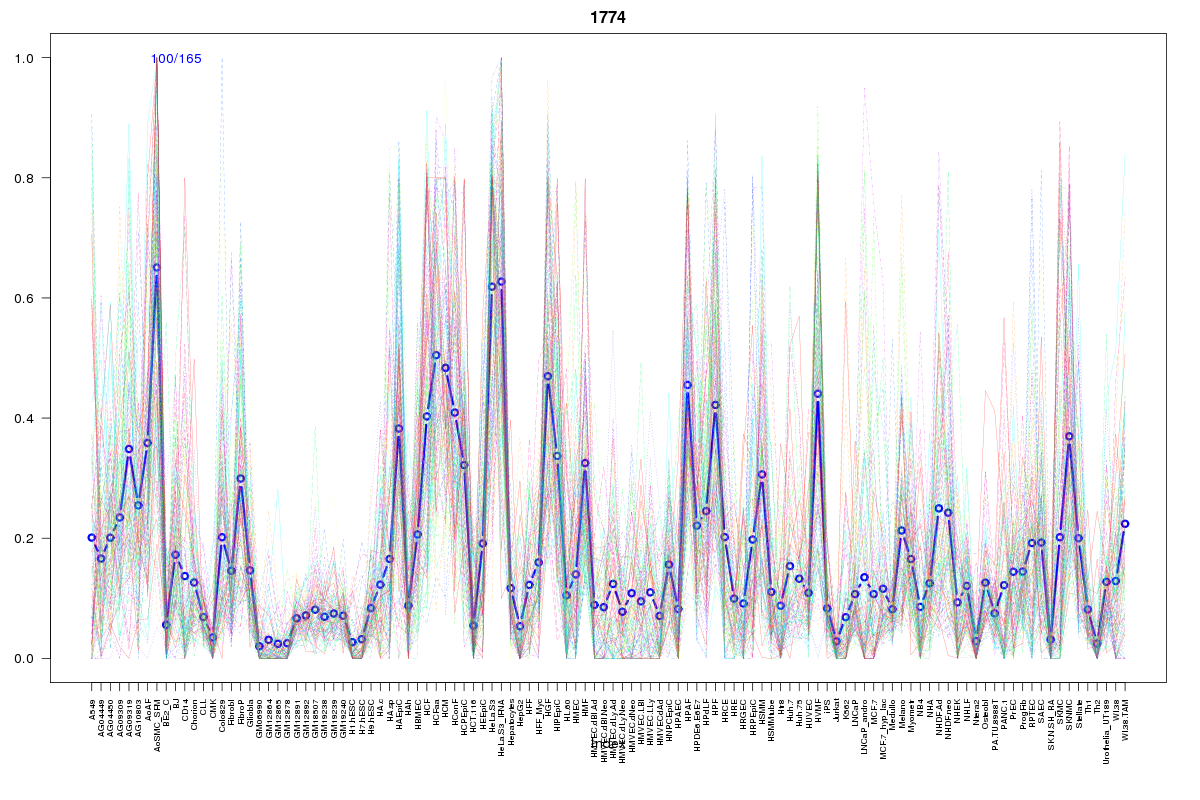 | 1774 | 1 |
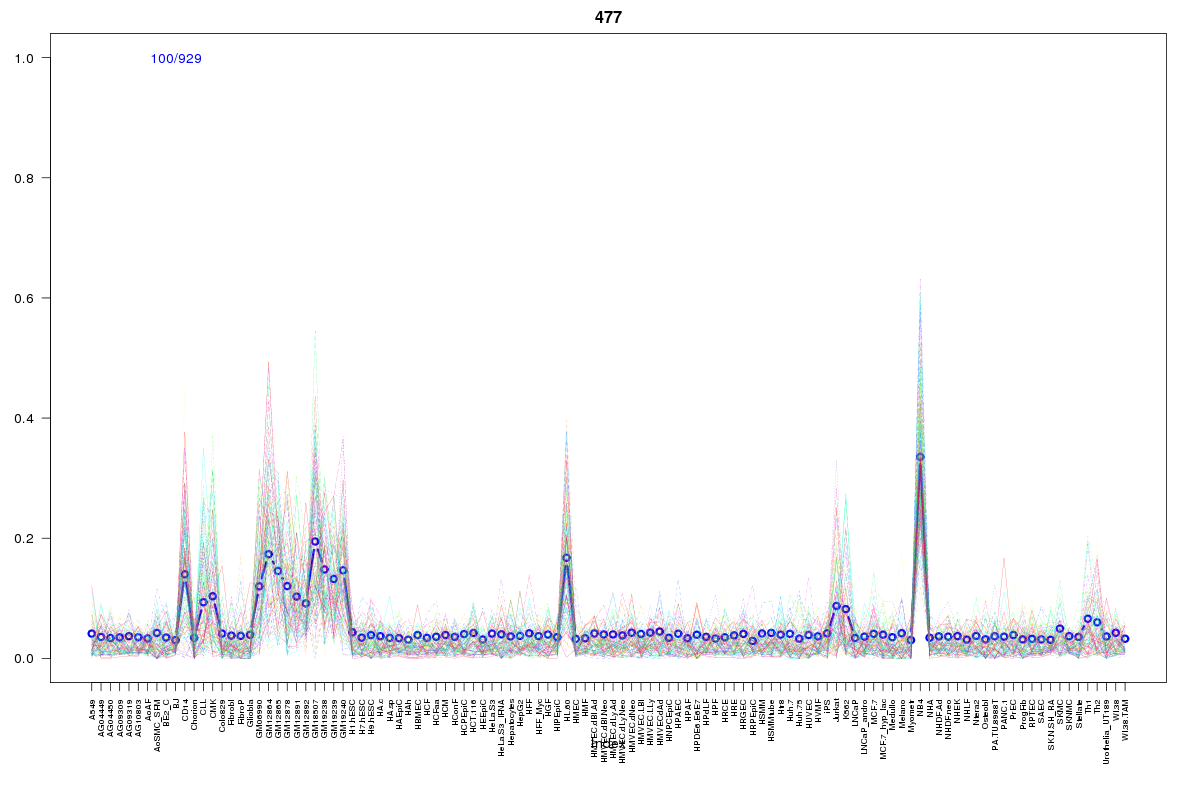 | 477 | 1 |
 | 2084 | 1 |
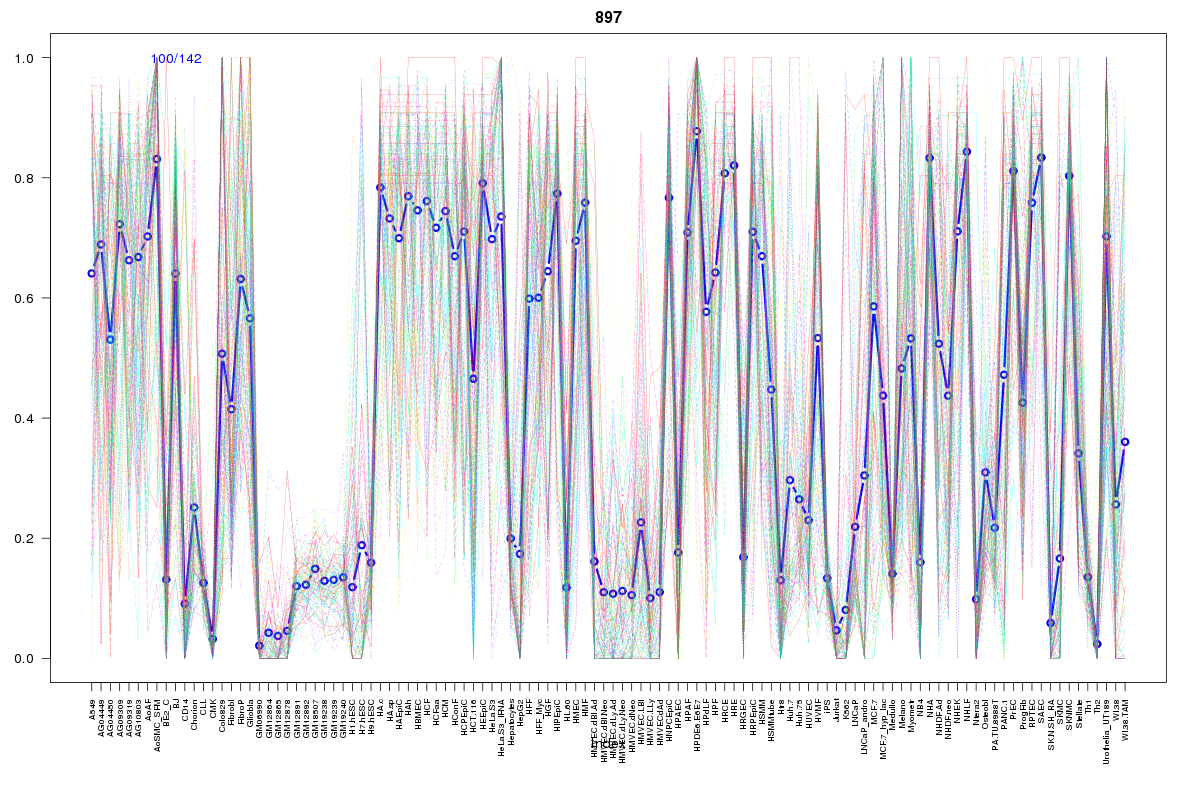 | 897 | 1 |
Resources
BED file downloads
Connects to 37 DHS sitesTop 10 Correlated DHS Sites
p-values indiciate significant higher or lower correlation| Location | Cluster | P-value |
|---|---|---|
| chr2:112641200-112641350 | 421 | 0 |
| chr2:112505365-112505515 | 438 | 0 |
| chr2:112663700-112663850 | 10 | 0.002 |
| chr2:112653620-112653770 | 615 | 0.002 |
| chr2:112459780-112459930 | 2130 | 0.002 |
| chr2:112677025-112677175 | 410 | 0.003 |
| chr2:112641545-112641695 | 271 | 0.003 |
| chr2:112459000-112459150 | 2212 | 0.003 |
| chr2:112655380-112655530 | 1508 | 0.003 |
| chr2:112702140-112702290 | 477 | 0.005 |
| chr2:112642125-112642275 | 1901 | 0.005 |
External Databases
UCSCEnsembl (ENSG00000153107)