Gene: CTBP1
chr4: 1205235-1242925Expression Profile
(log scale)
Graphical Connections
Distribution of linked clusters:
You may find it interesting if many of the connected DHS sites belong to the same cluster.| Cluster Profile | Cluster ID | Number of DHS sites in this cluster |
|---|---|---|
 | 1078 | 3 |
 | 2114 | 3 |
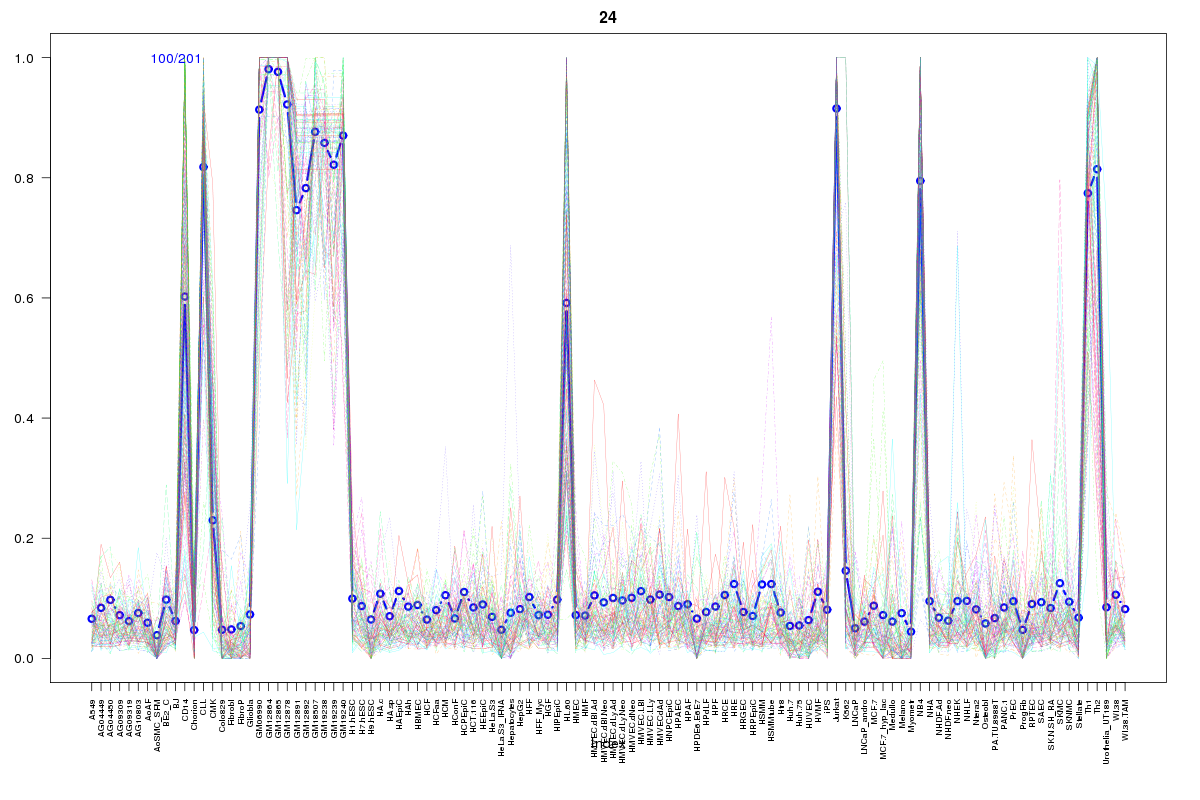 | 24 | 2 |
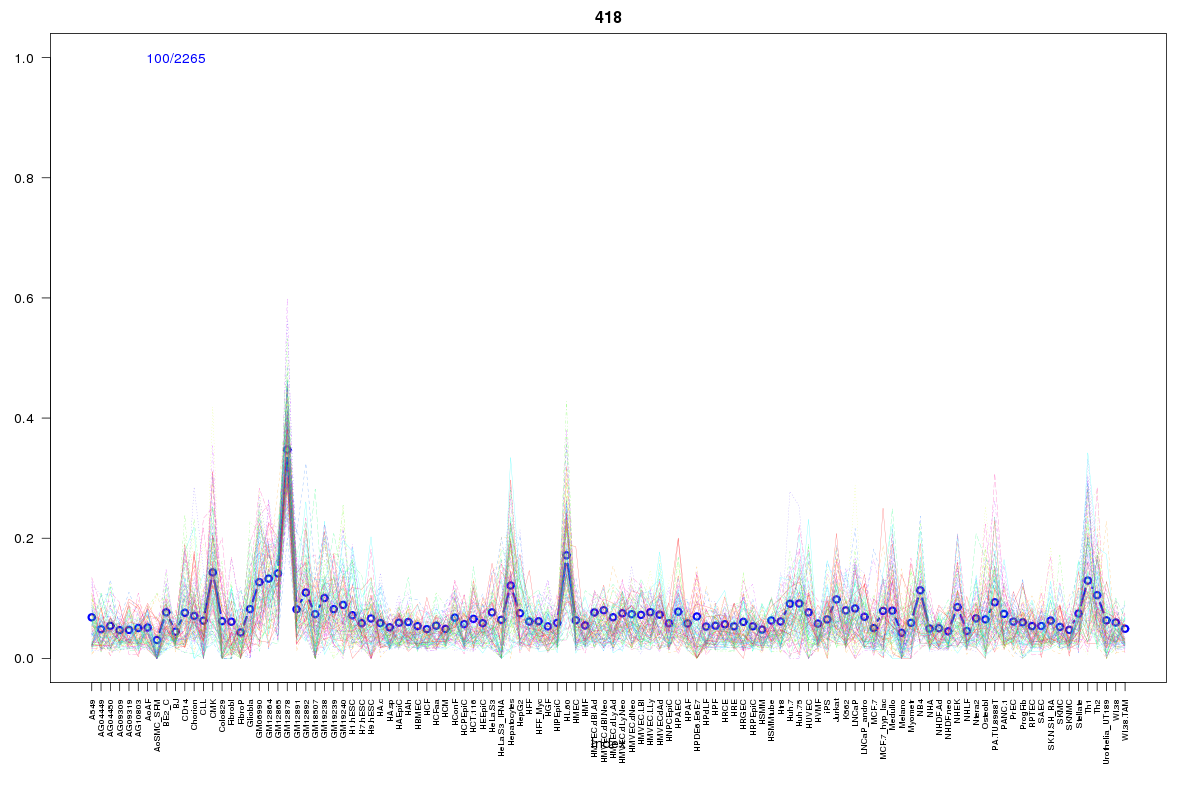 | 418 | 1 |
 | 2072 | 1 |
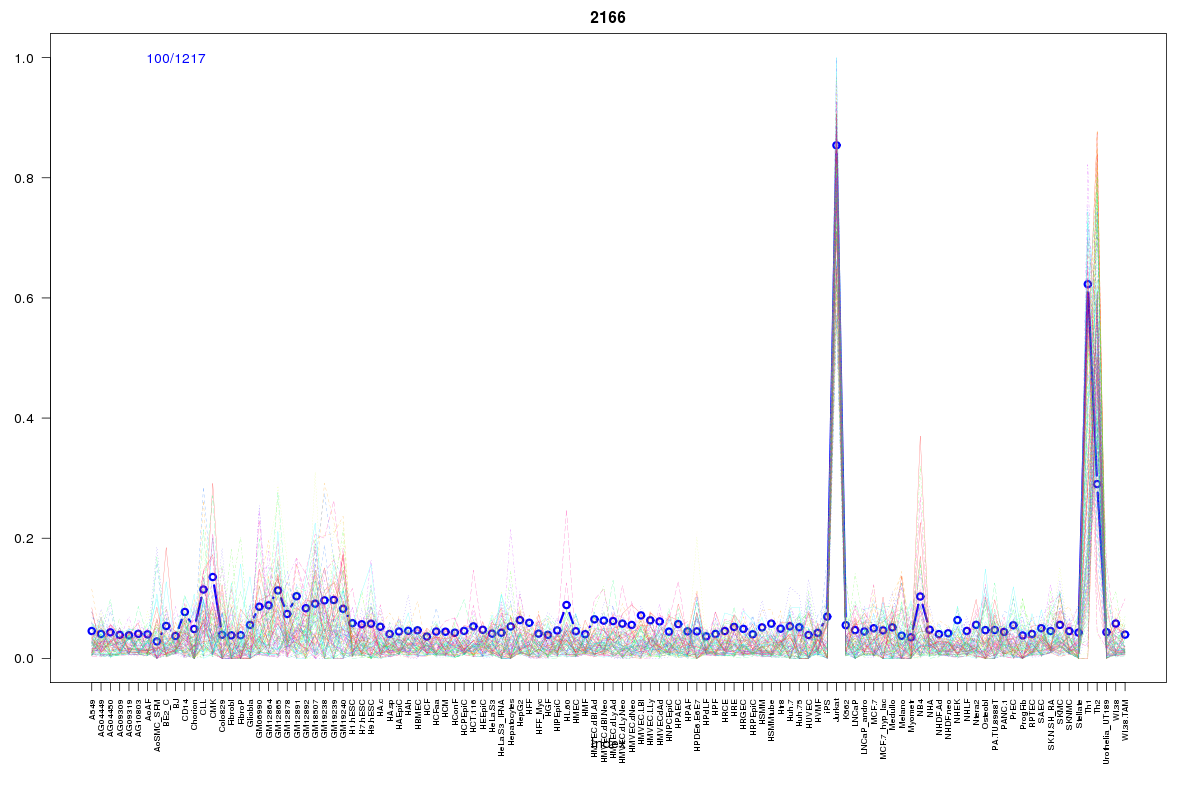 | 2166 | 1 |
 | 582 | 1 |
 | 2170 | 1 |
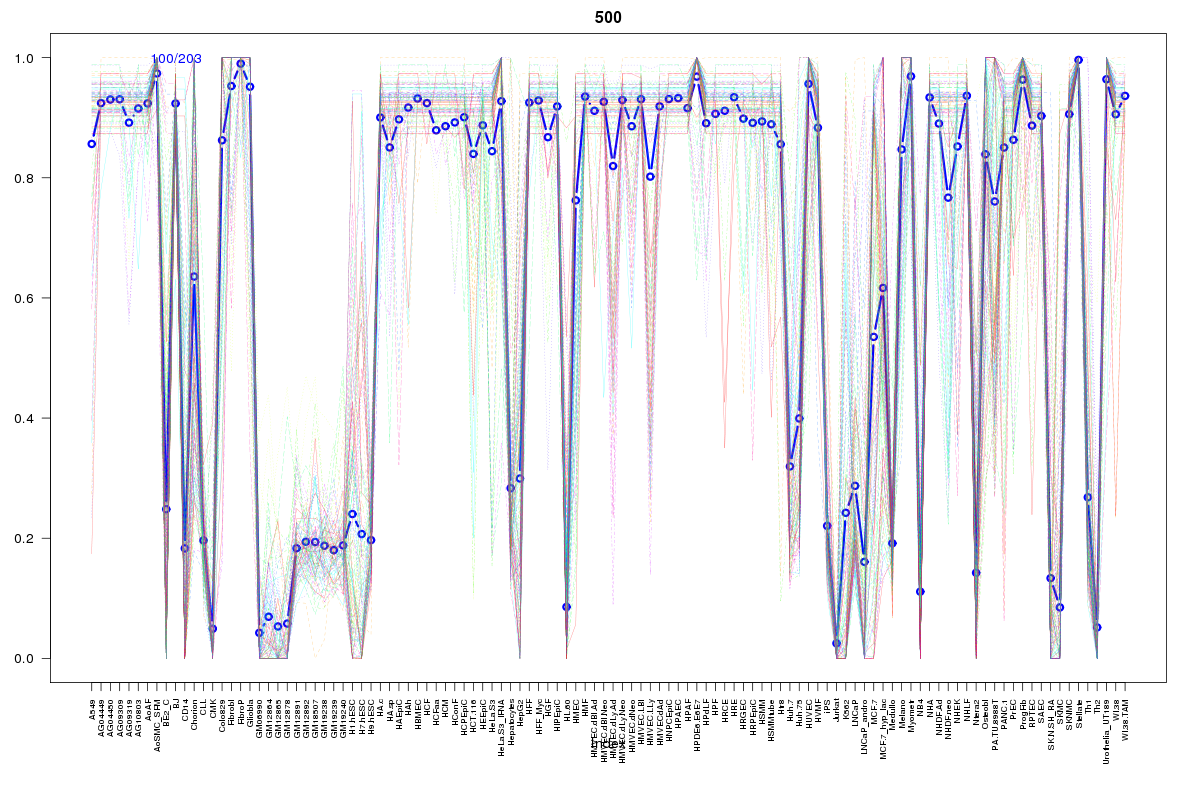 | 500 | 1 |
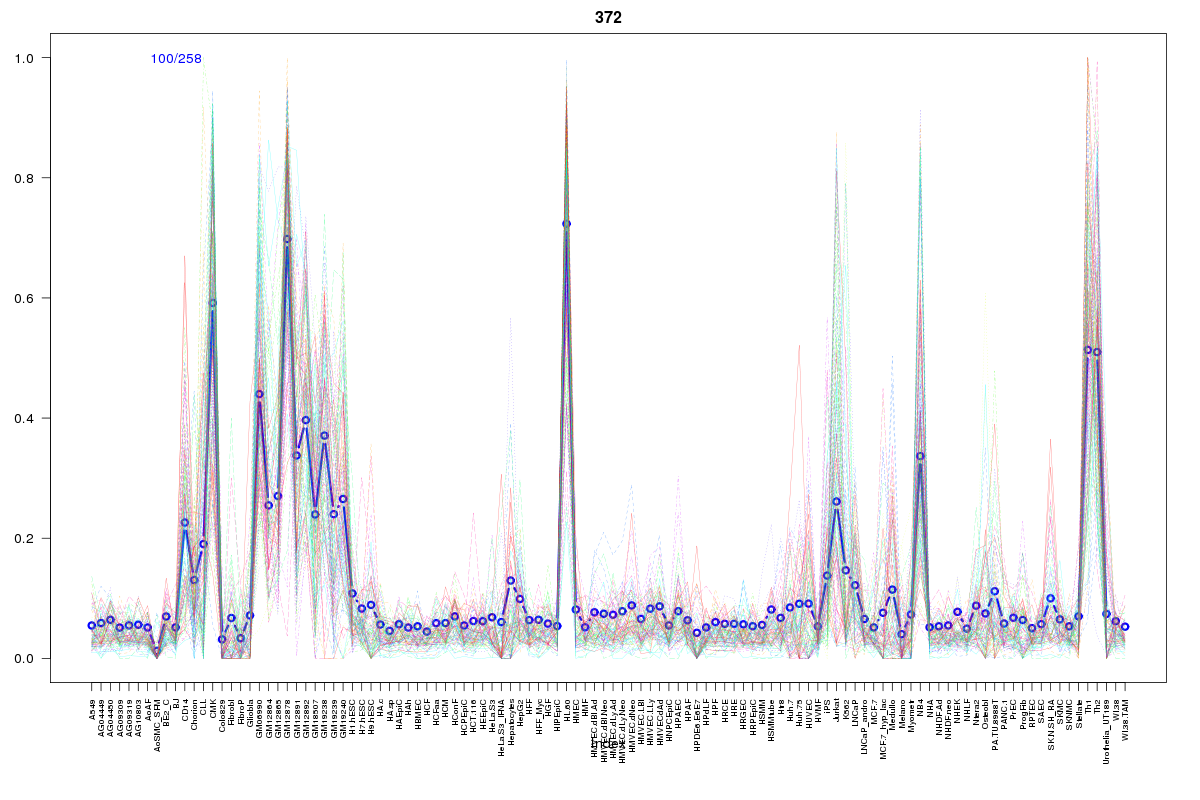 | 372 | 1 |
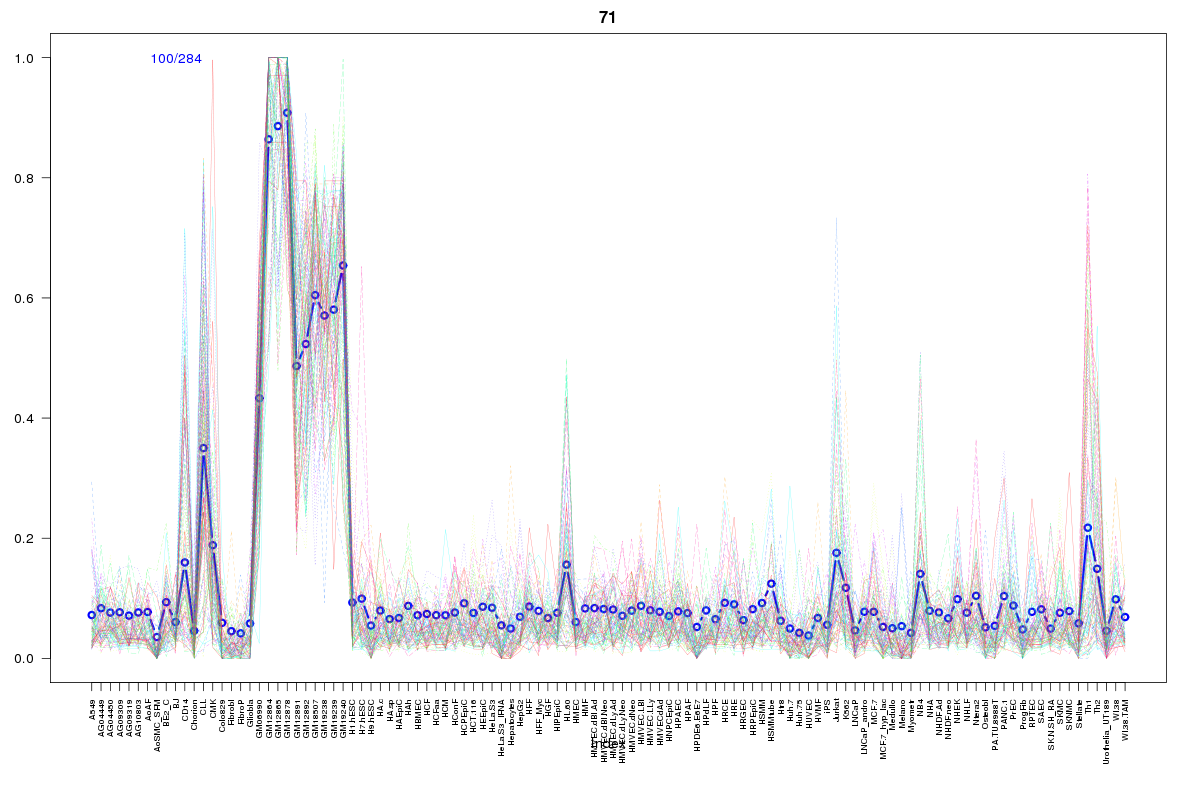 | 71 | 1 |
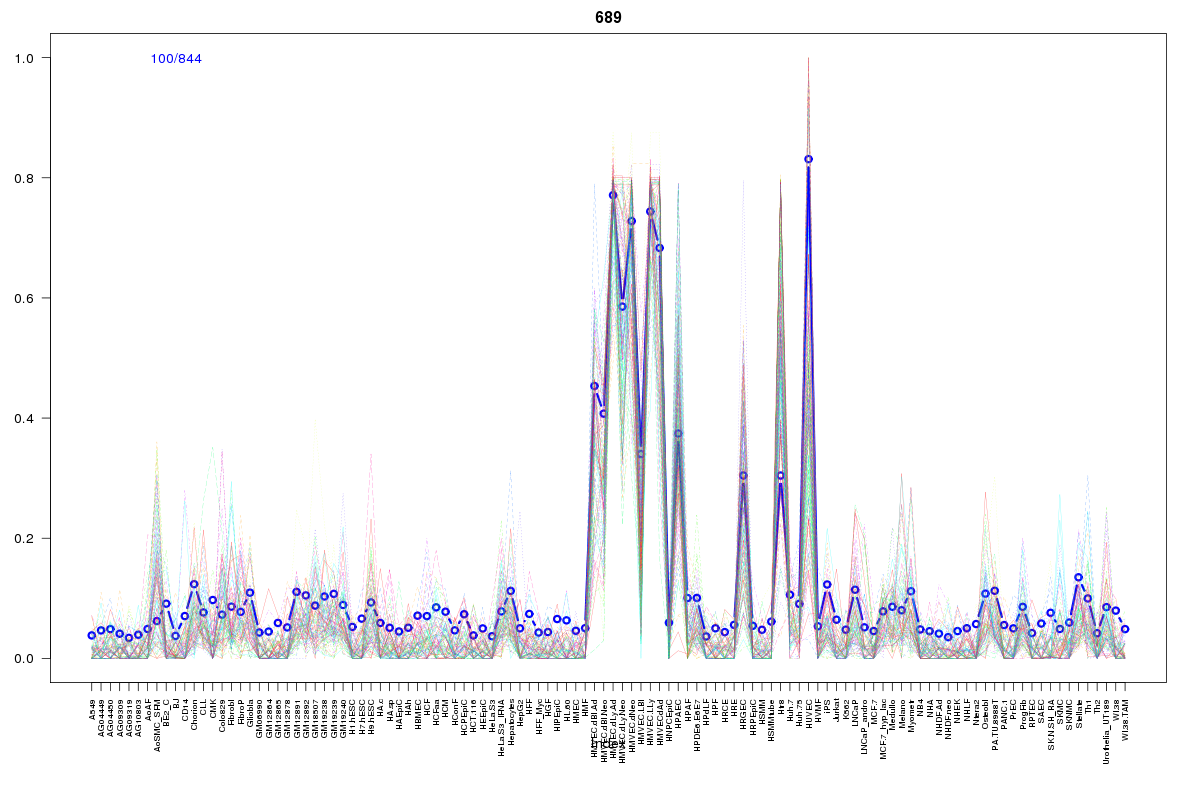 | 689 | 1 |
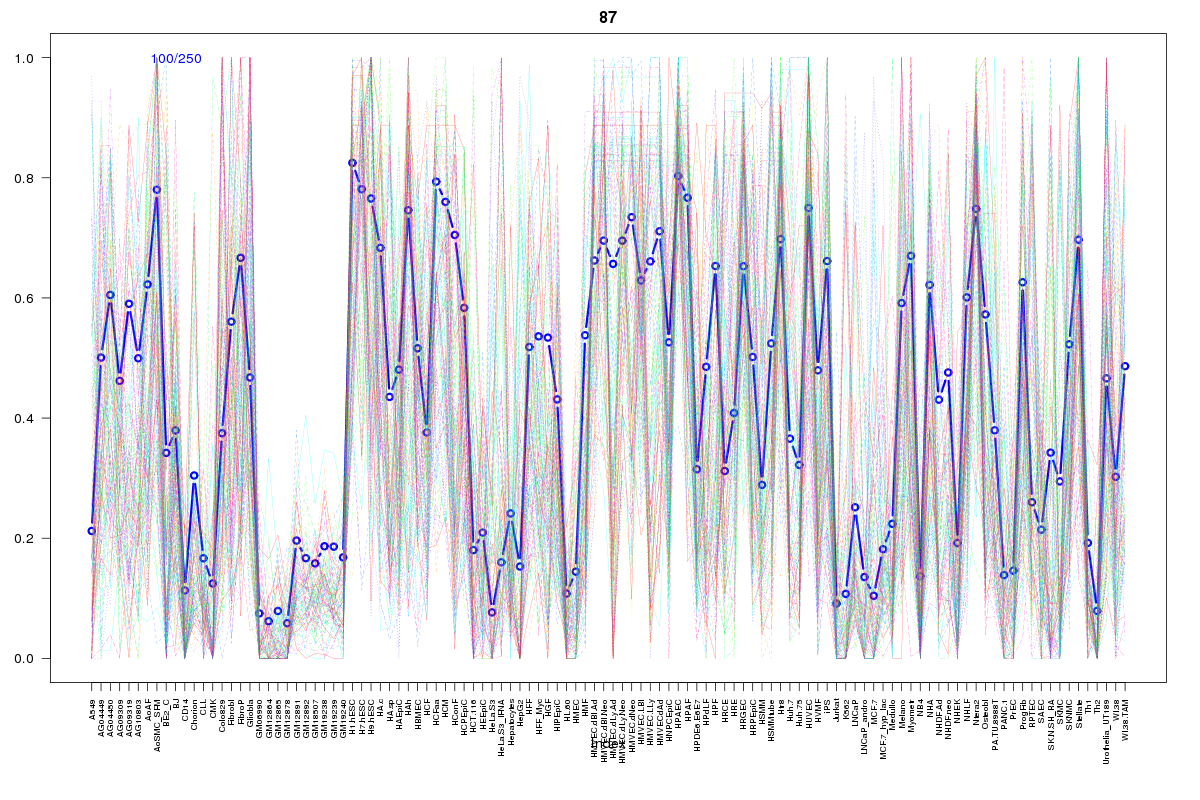 | 87 | 1 |
 | 1225 | 1 |
 | 2279 | 1 |
 | 2110 | 1 |
 | 66 | 1 |
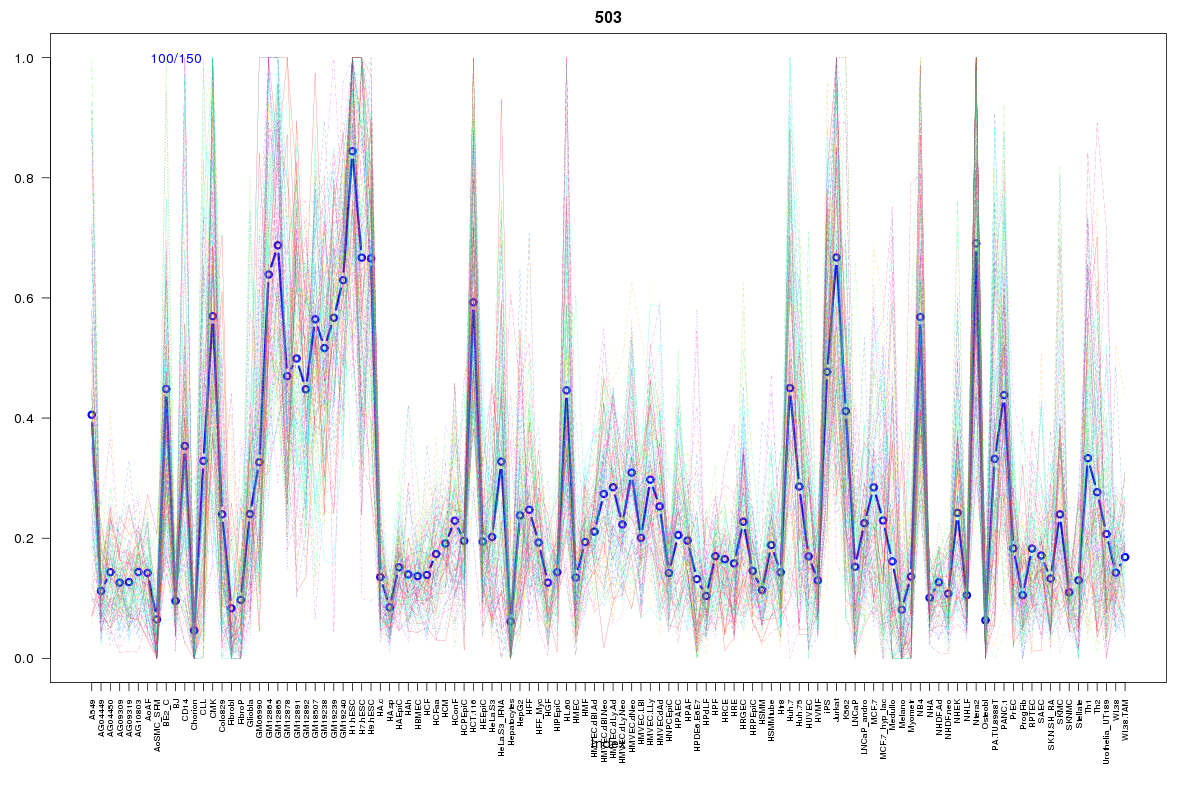 | 503 | 1 |
Resources
BED file downloads
Connects to 23 DHS sitesTop 10 Correlated DHS Sites
p-values indiciate significant higher or lower correlation| Location | Cluster | P-value |
|---|---|---|
| chr4:1247820-1247970 | 2110 | 0.005 |
| chr4:1324660-1324810 | 2170 | 0.005 |
| chr4:1195160-1195310 | 24 | 0.005 |
| chr4:1305120-1305270 | 2114 | 0.005 |
| chr4:1304925-1305075 | 2072 | 0.005 |
| chr4:1309760-1309910 | 2166 | 0.007 |
| chr4:1210720-1210870 | 24 | 0.007 |
| chr4:1170905-1171055 | 582 | 0.009 |
| chr4:1162180-1162330 | 1078 | 0.011 |
| chr4:1324845-1324995 | 1078 | 0.012 |
| chr4:1309940-1310090 | 2114 | 0.012 |
External Databases
UCSCEnsembl (ENSG00000159692)