Gene: CACTIN
chr19: 3610638-3626813Expression Profile
(log scale)
Graphical Connections
Distribution of linked clusters:
You may find it interesting if many of the connected DHS sites belong to the same cluster.| Cluster Profile | Cluster ID | Number of DHS sites in this cluster |
|---|---|---|
 | 1078 | 10 |
 | 1008 | 6 |
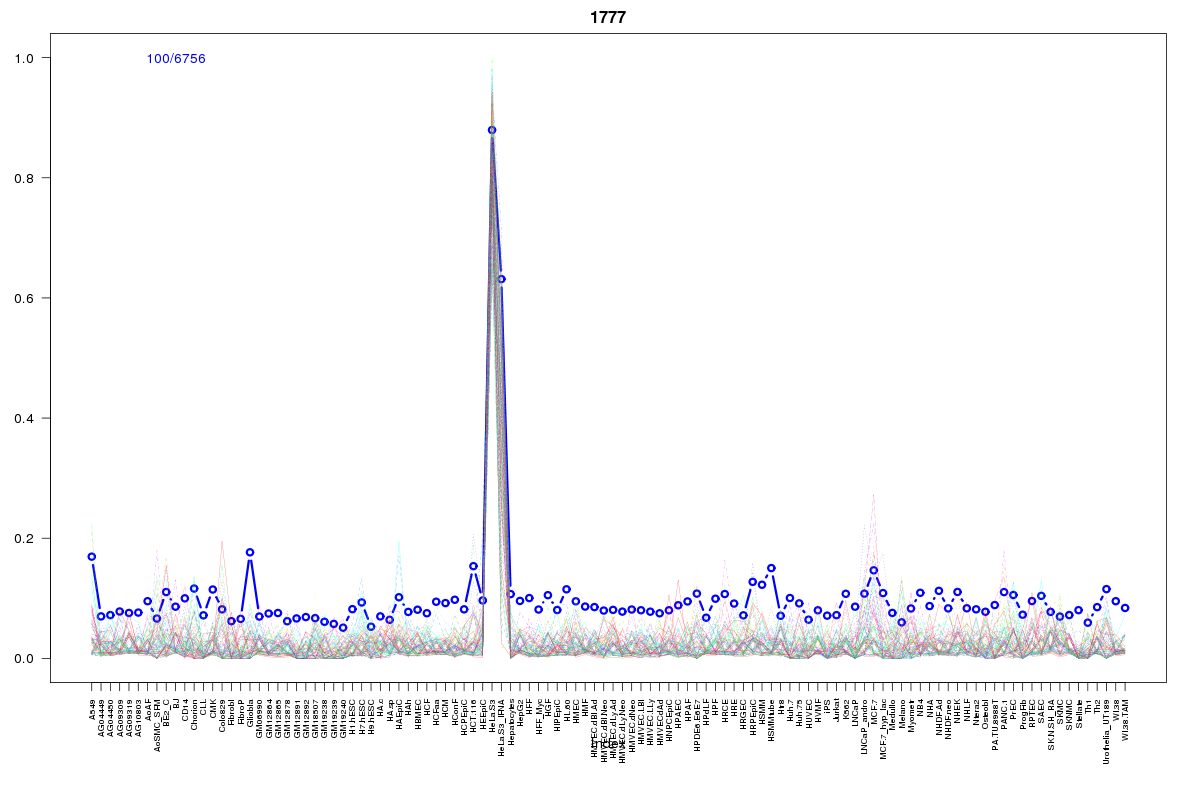 | 1777 | 4 |
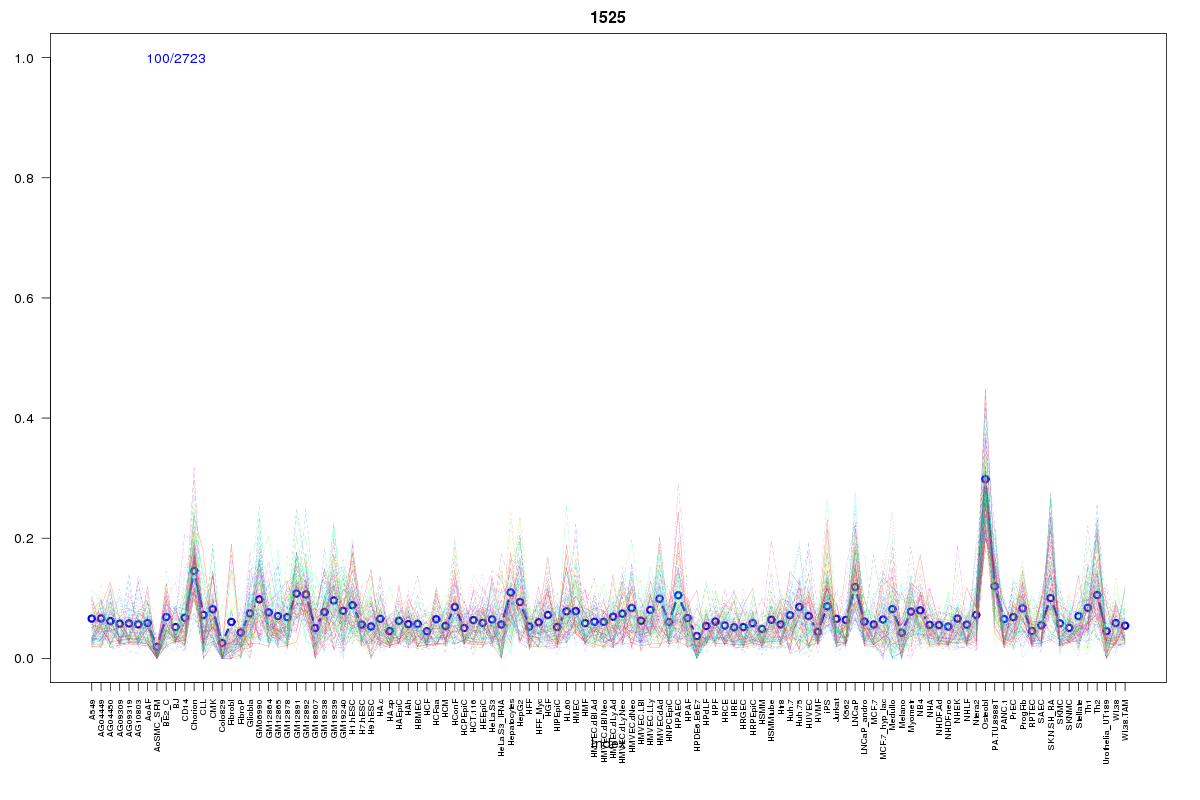 | 1525 | 2 |
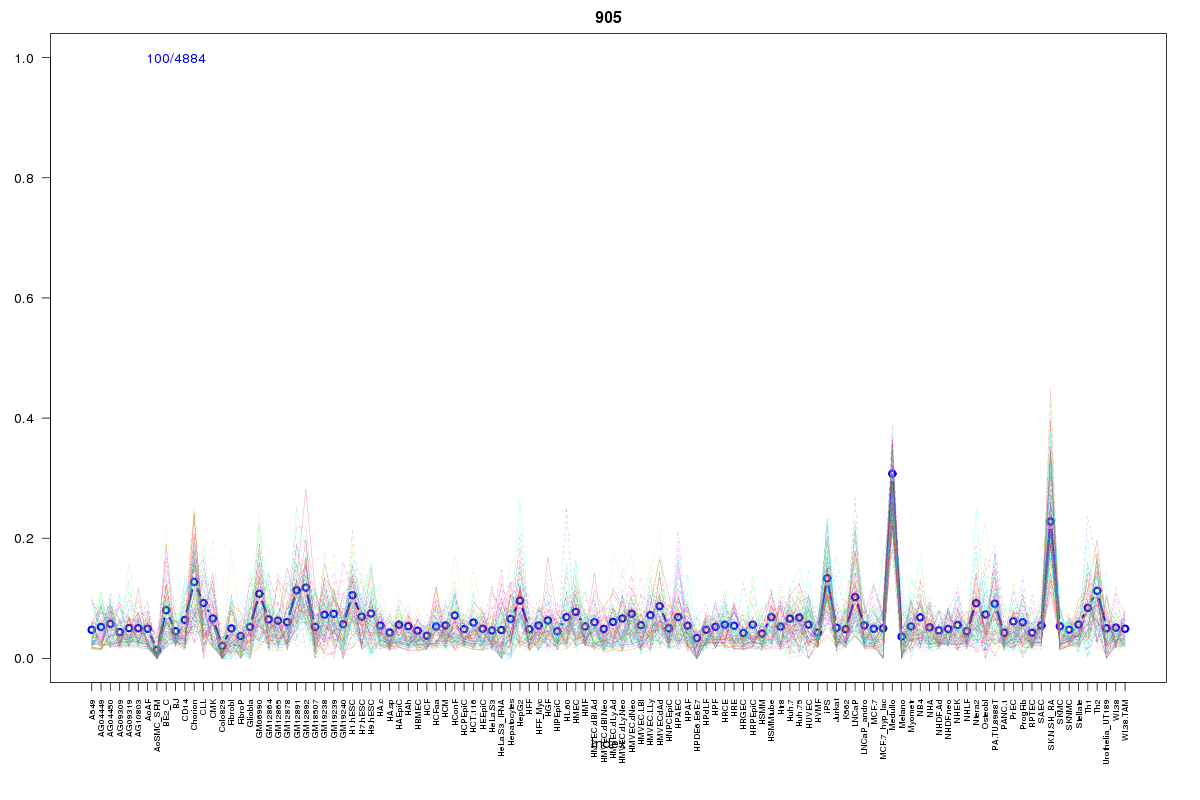 | 905 | 2 |
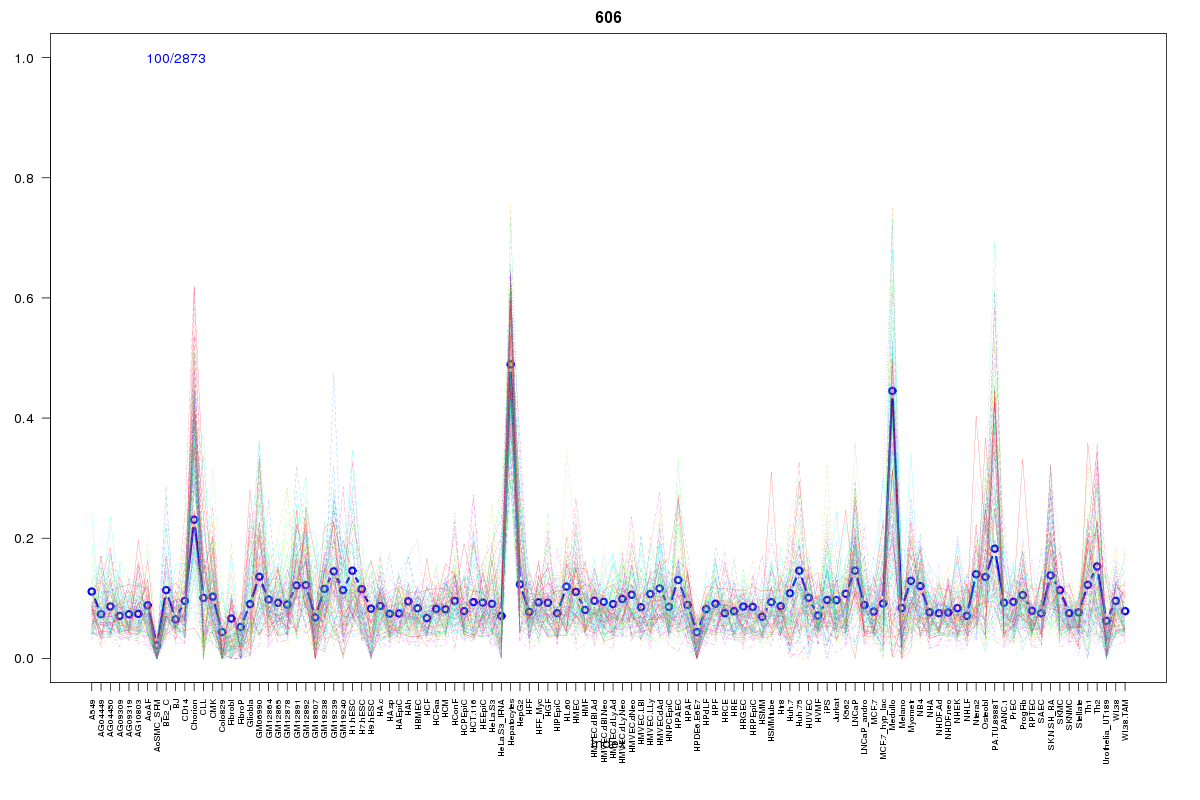 | 606 | 2 |
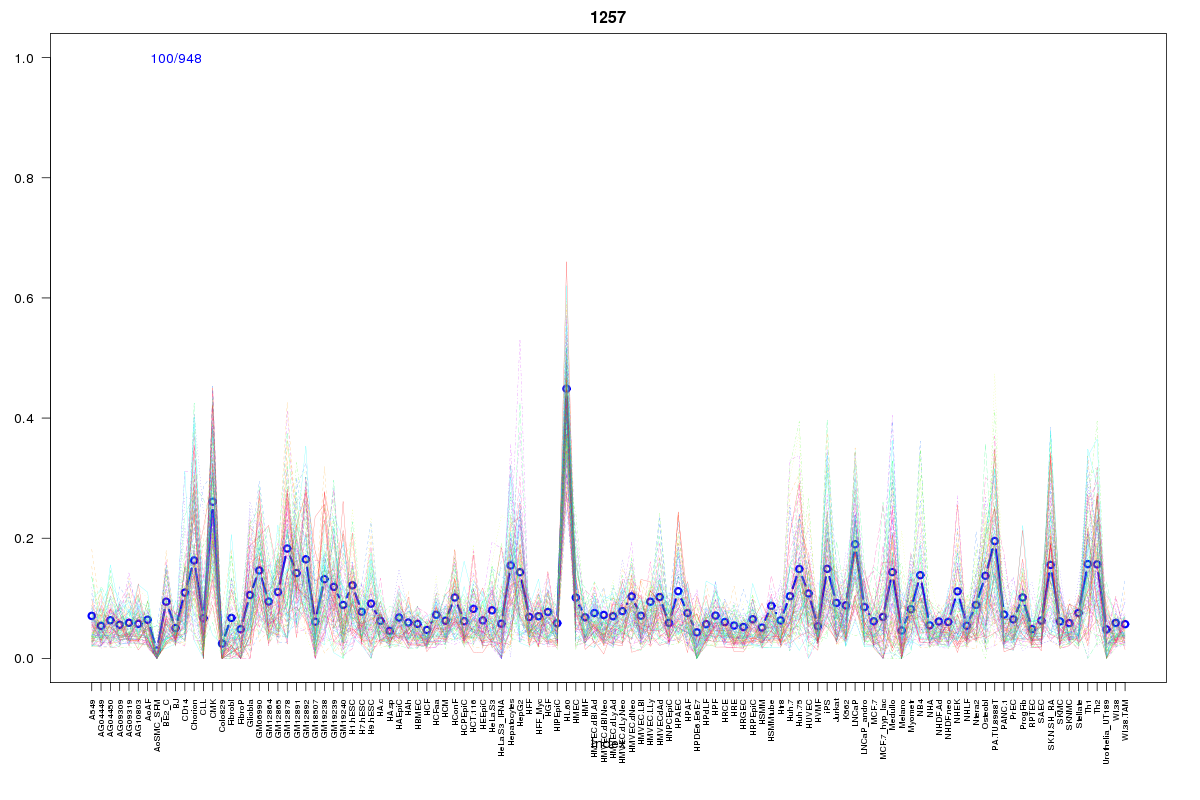 | 1257 | 2 |
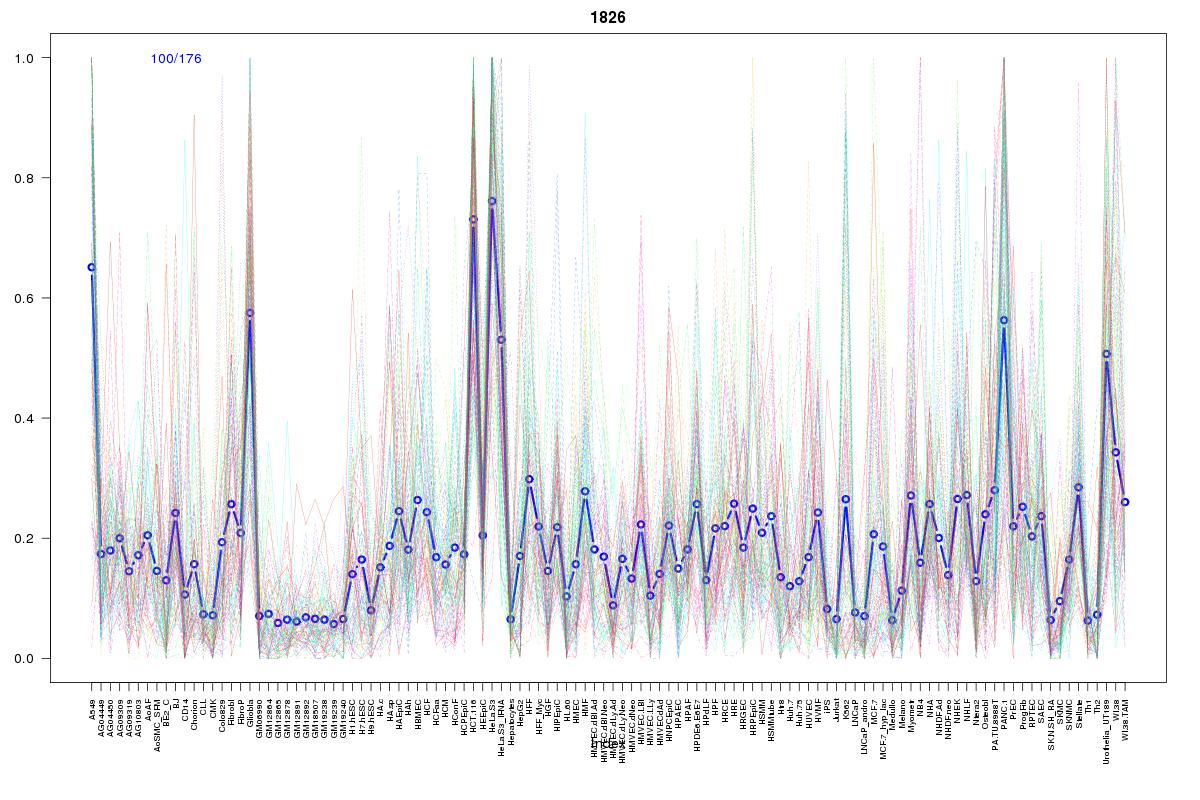 | 1826 | 2 |
 | 2279 | 1 |
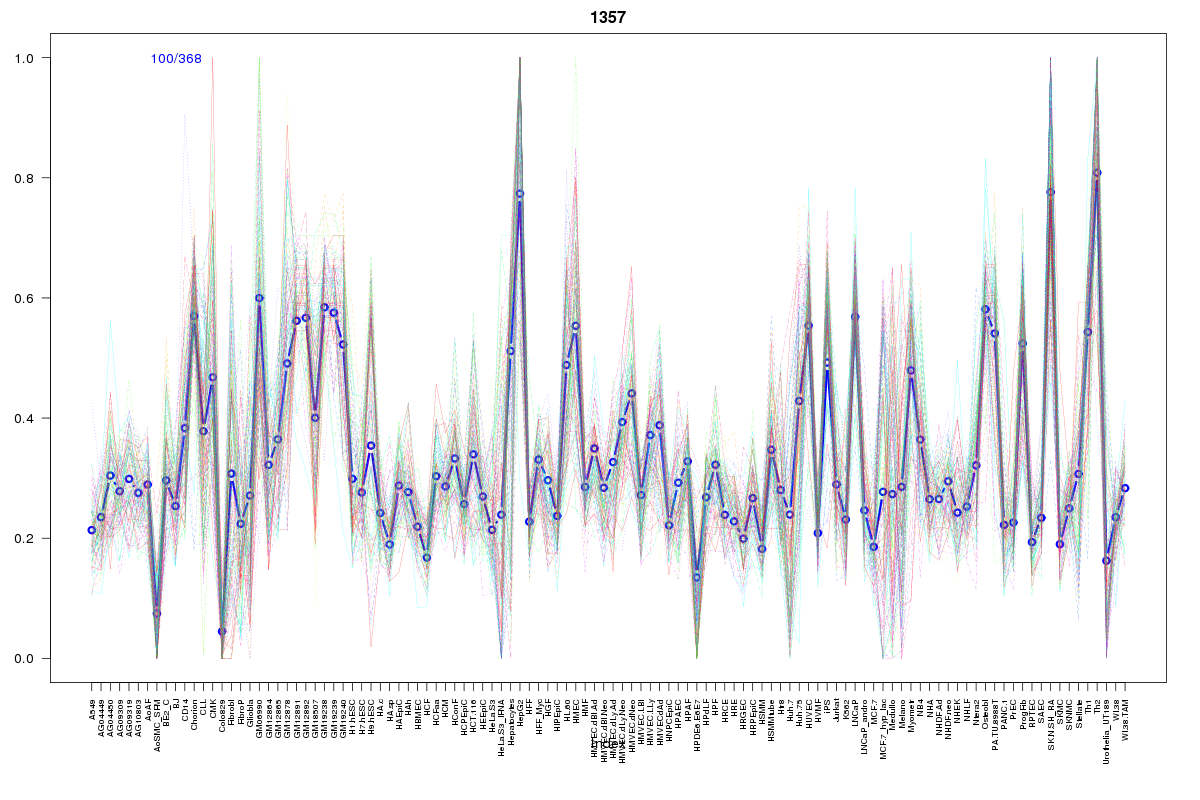 | 1357 | 1 |
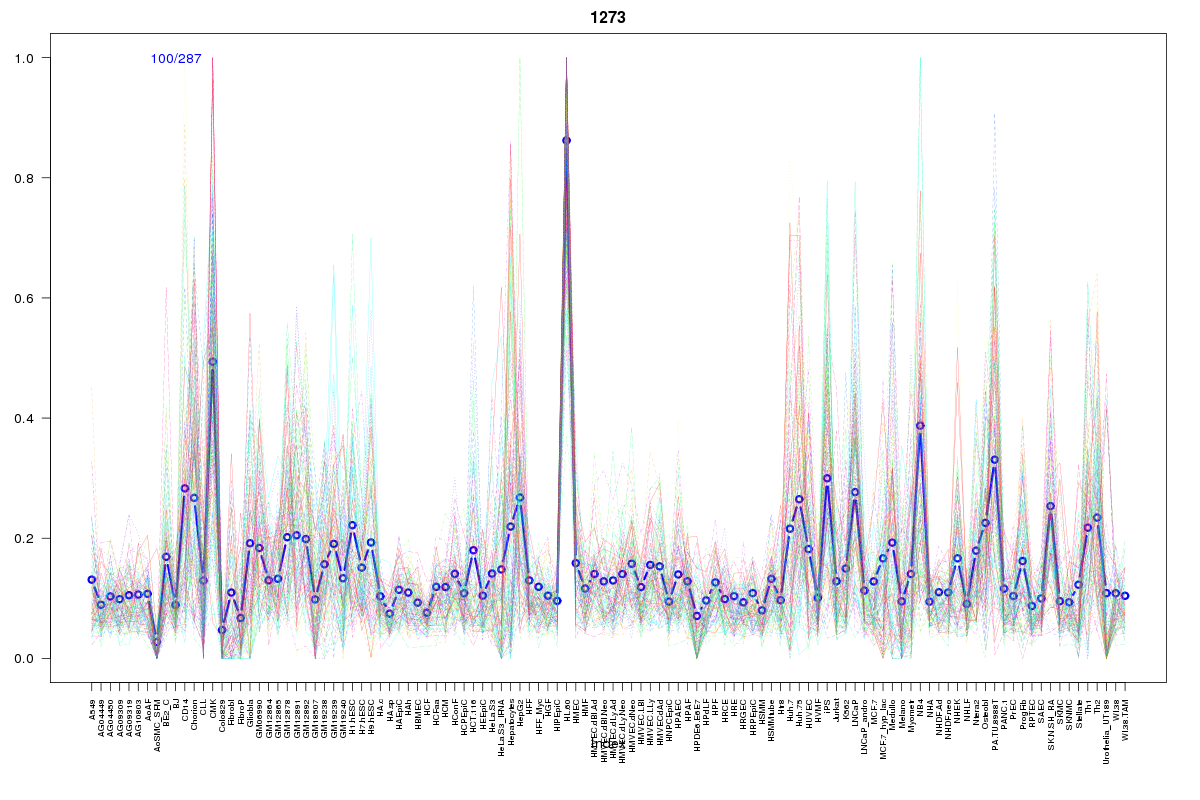 | 1273 | 1 |
 | 1225 | 1 |
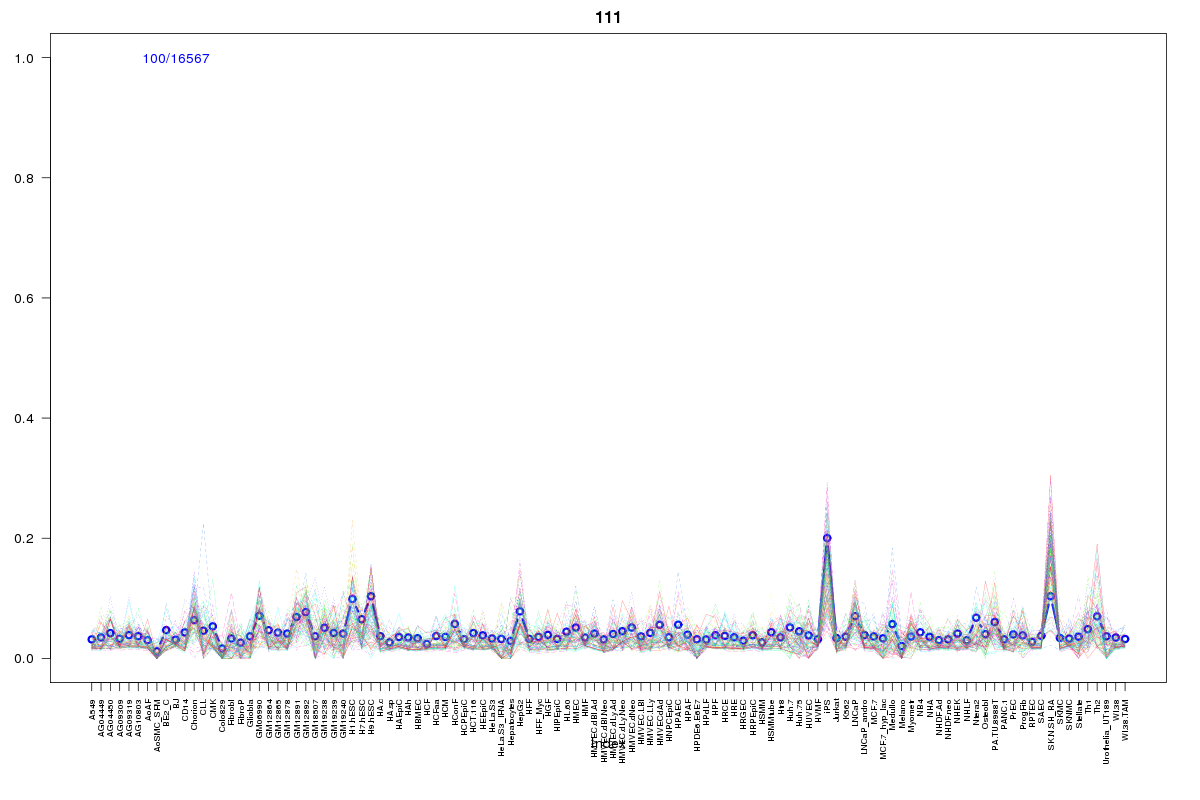 | 111 | 1 |
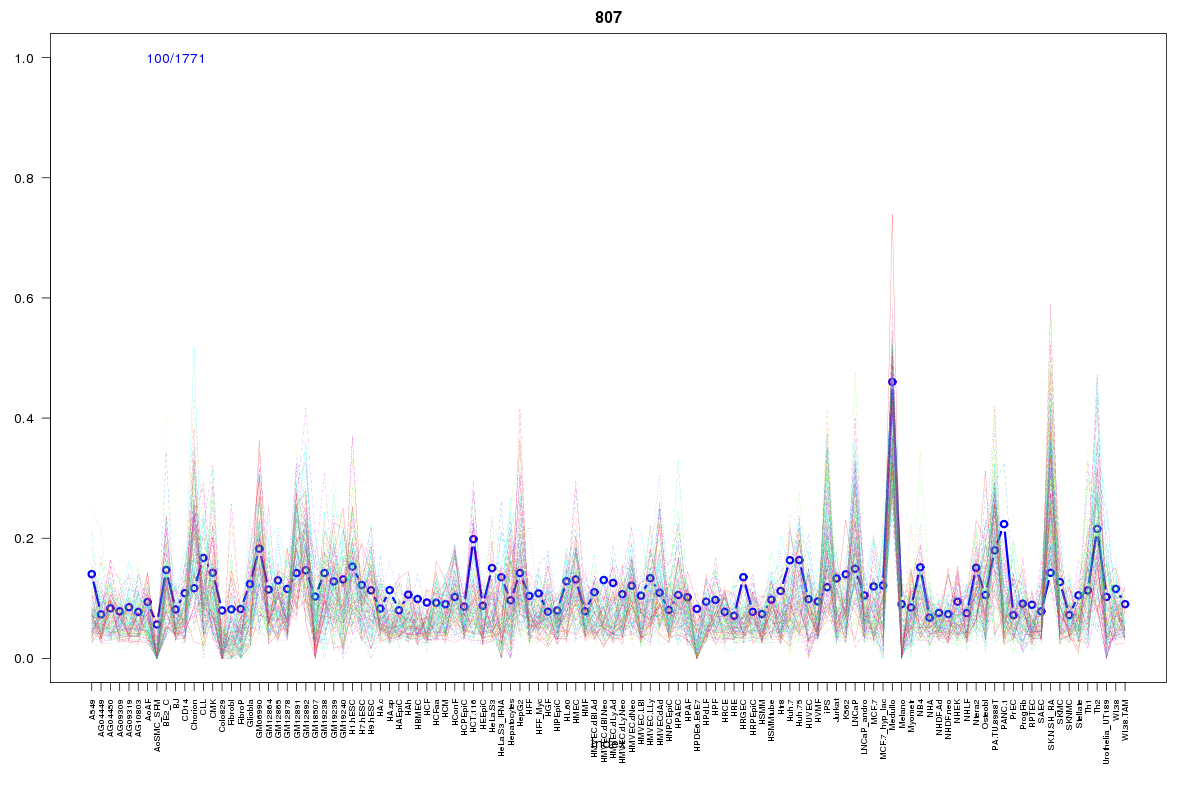 | 807 | 1 |
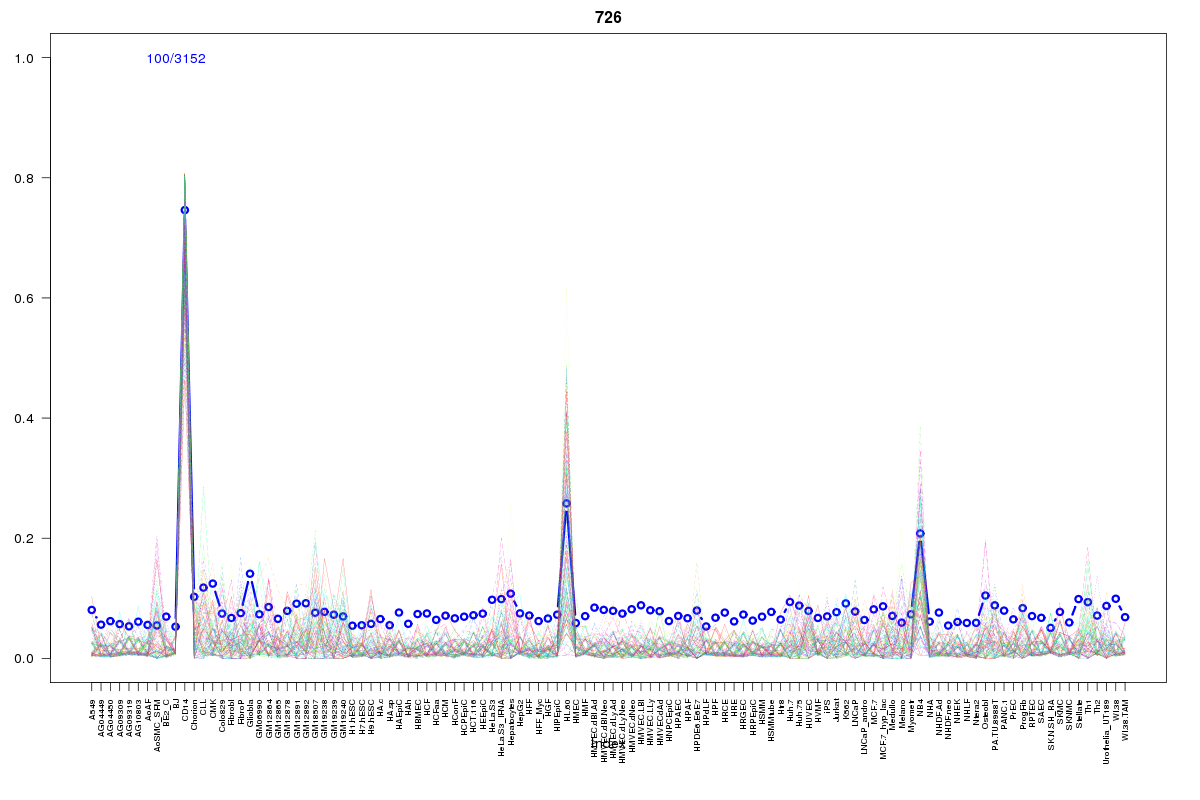 | 726 | 1 |
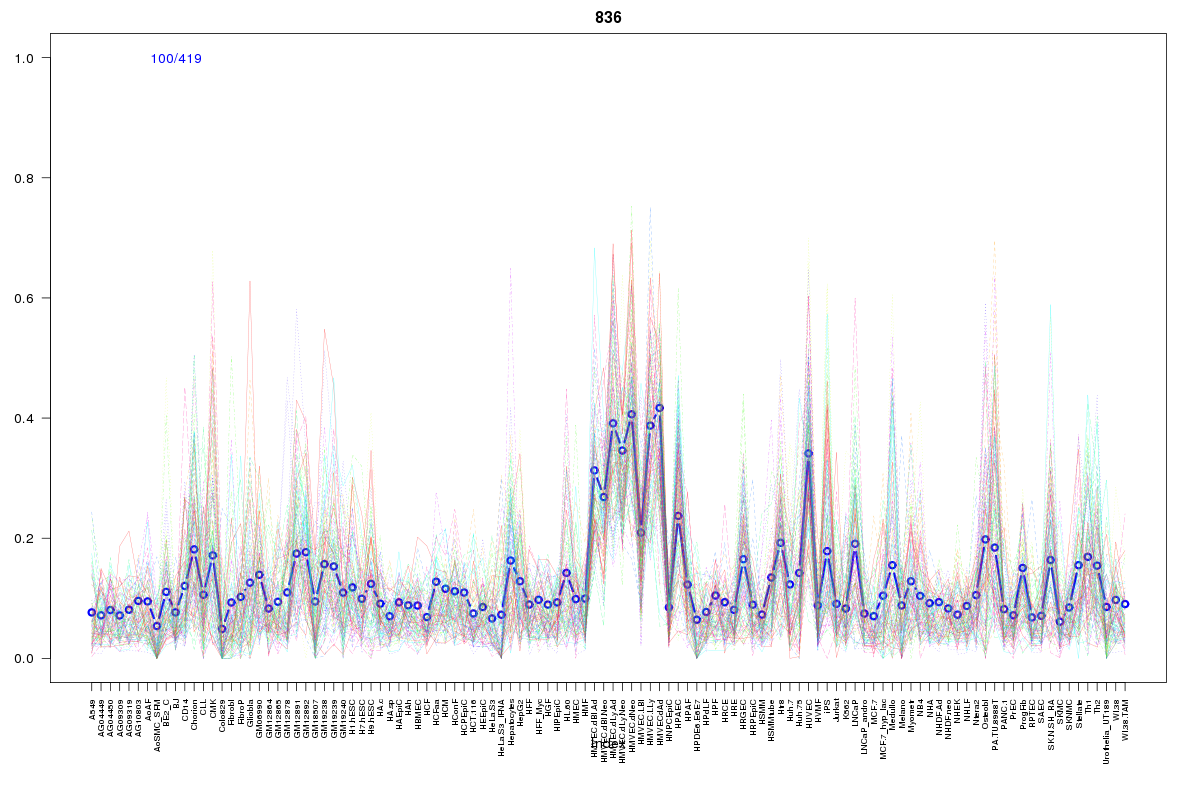 | 836 | 1 |
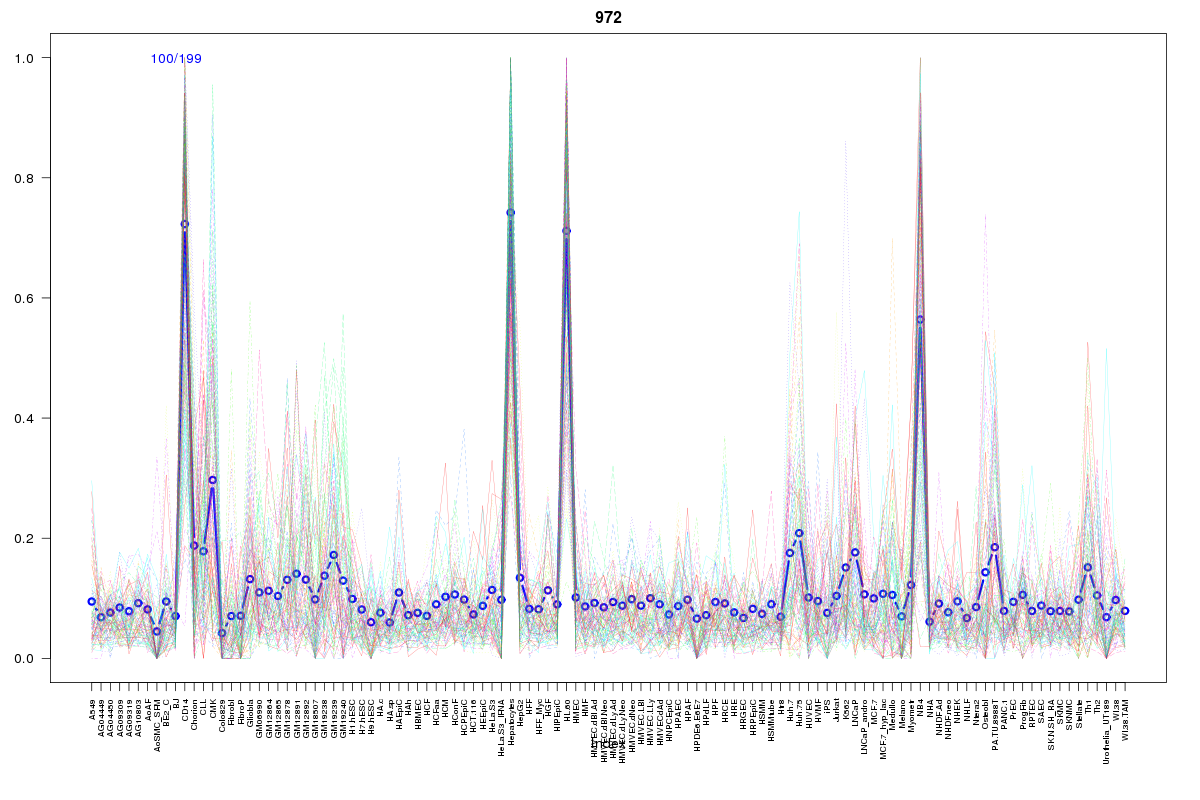 | 972 | 1 |
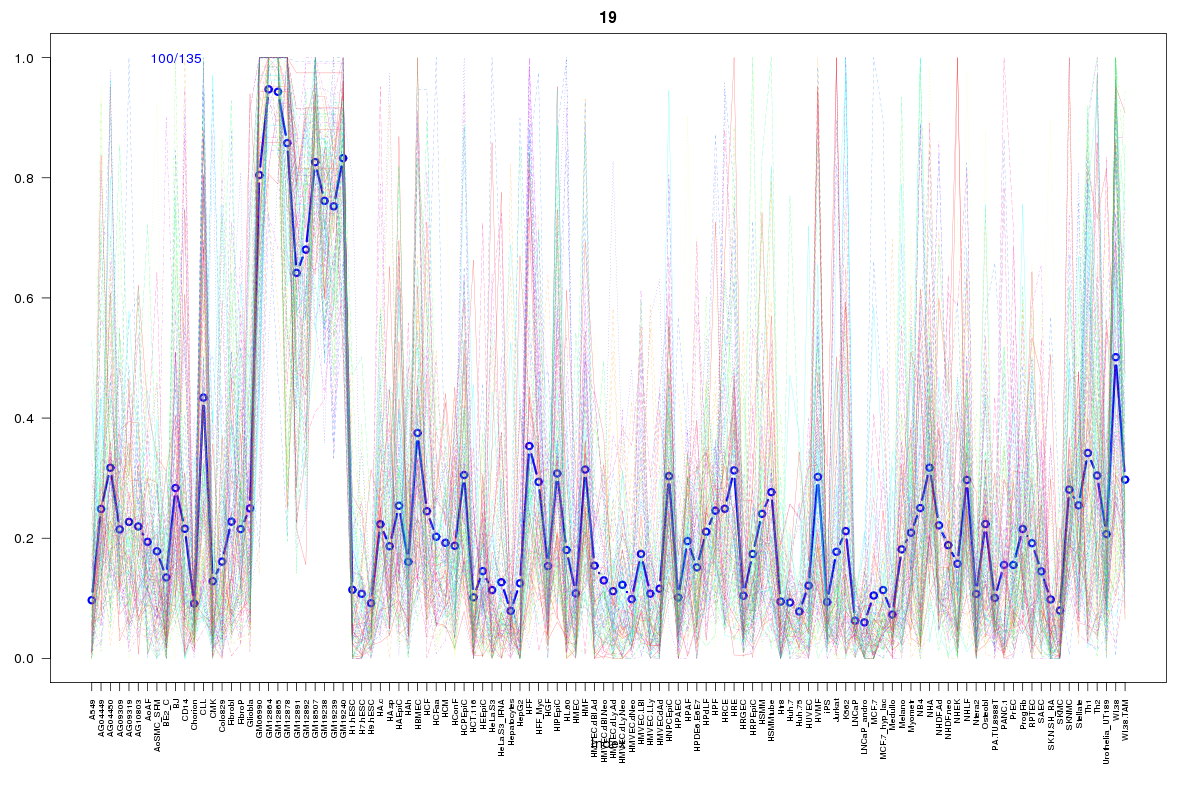 | 19 | 1 |
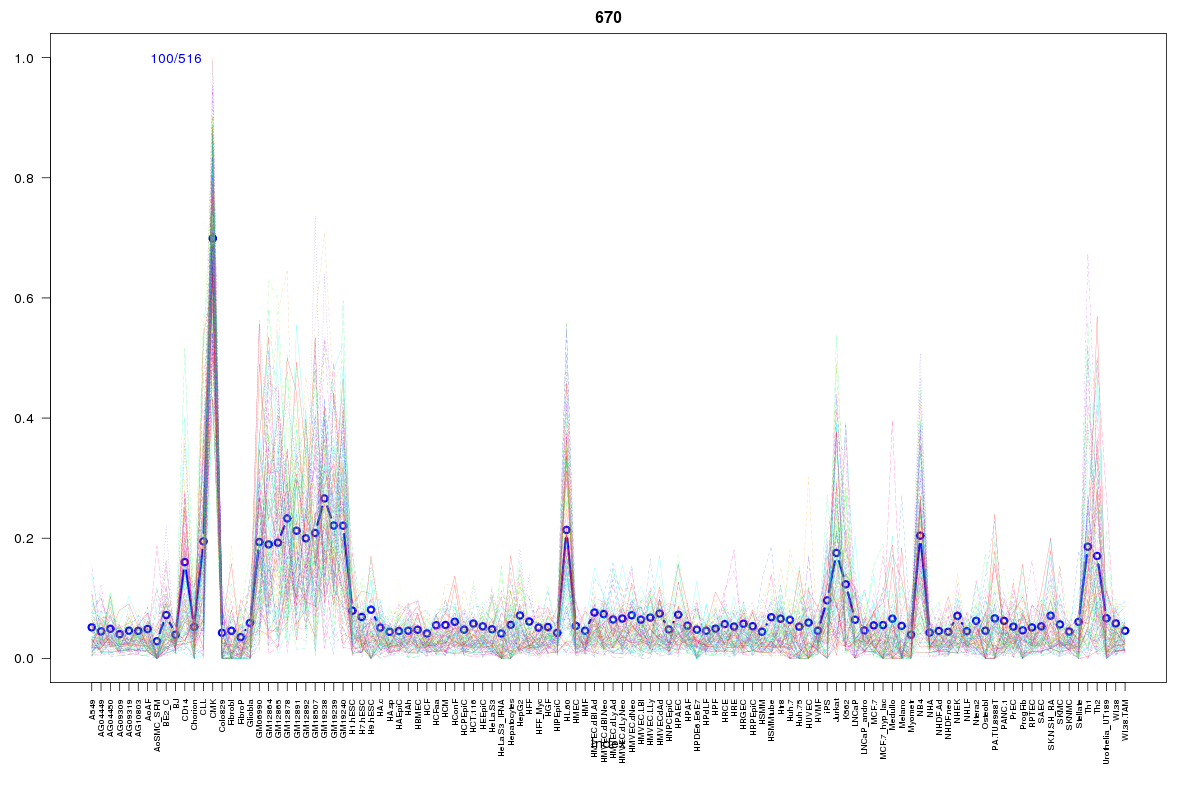 | 670 | 1 |
 | 570 | 1 |
 | 1865 | 1 |
 | 1724 | 1 |
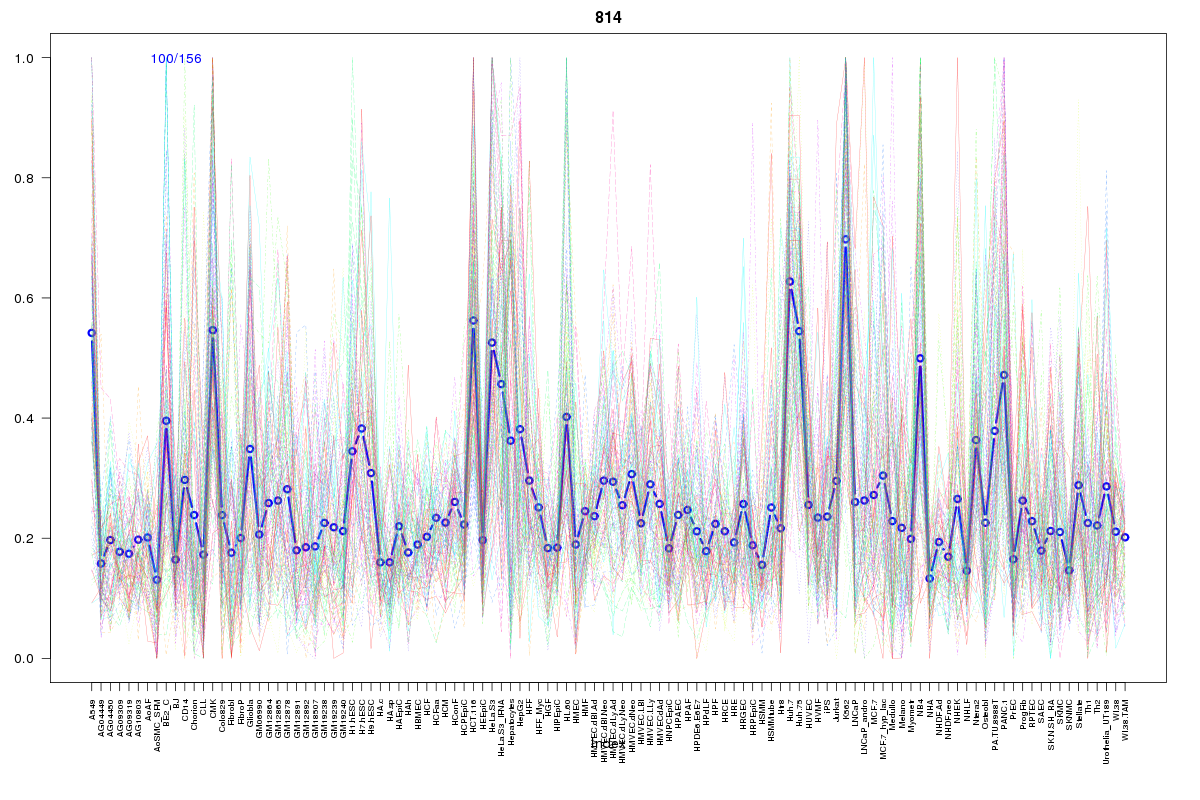 | 814 | 1 |
 | 416 | 1 |
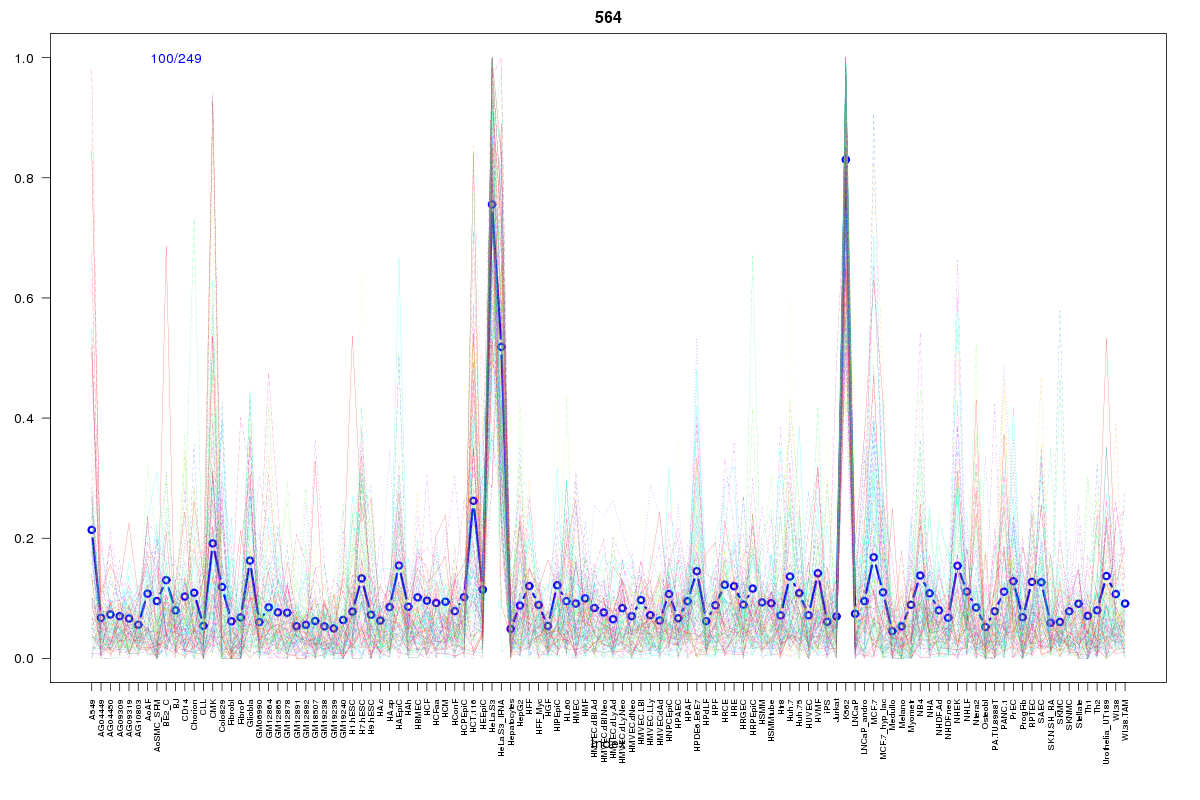 | 564 | 1 |
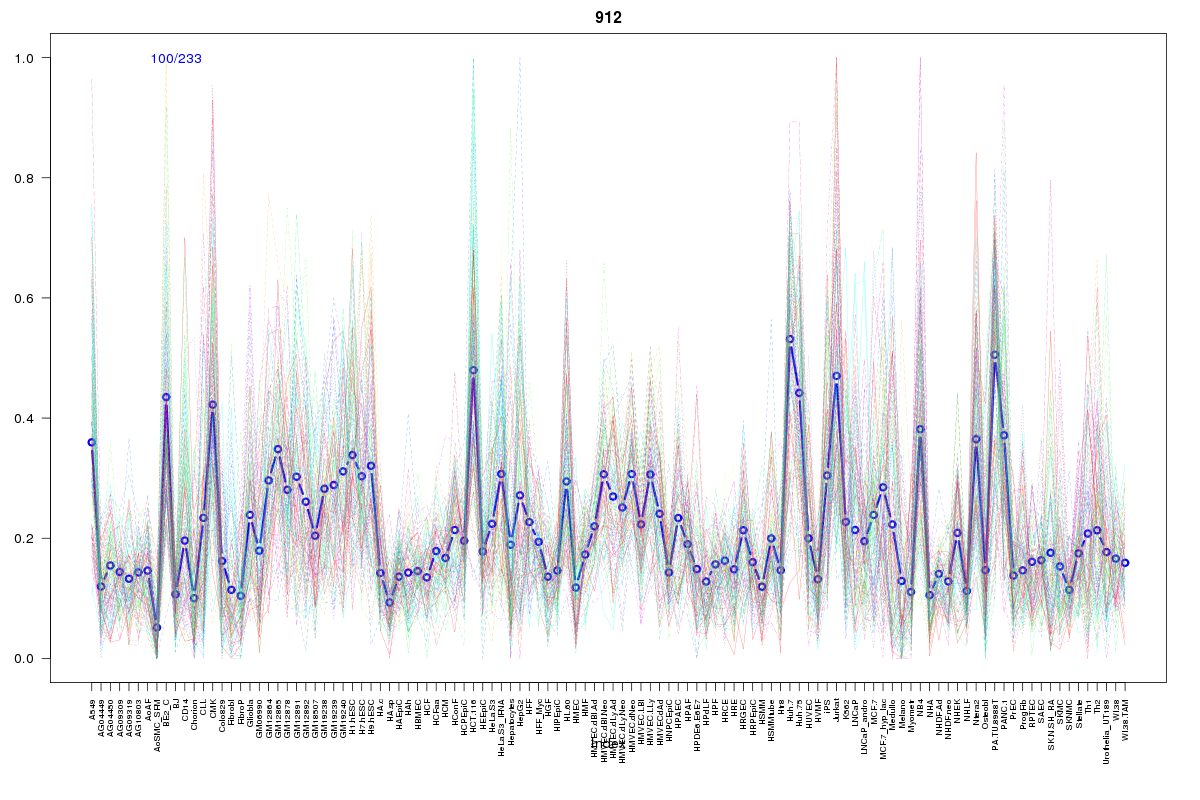 | 912 | 1 |
 | 862 | 1 |
 | 881 | 1 |
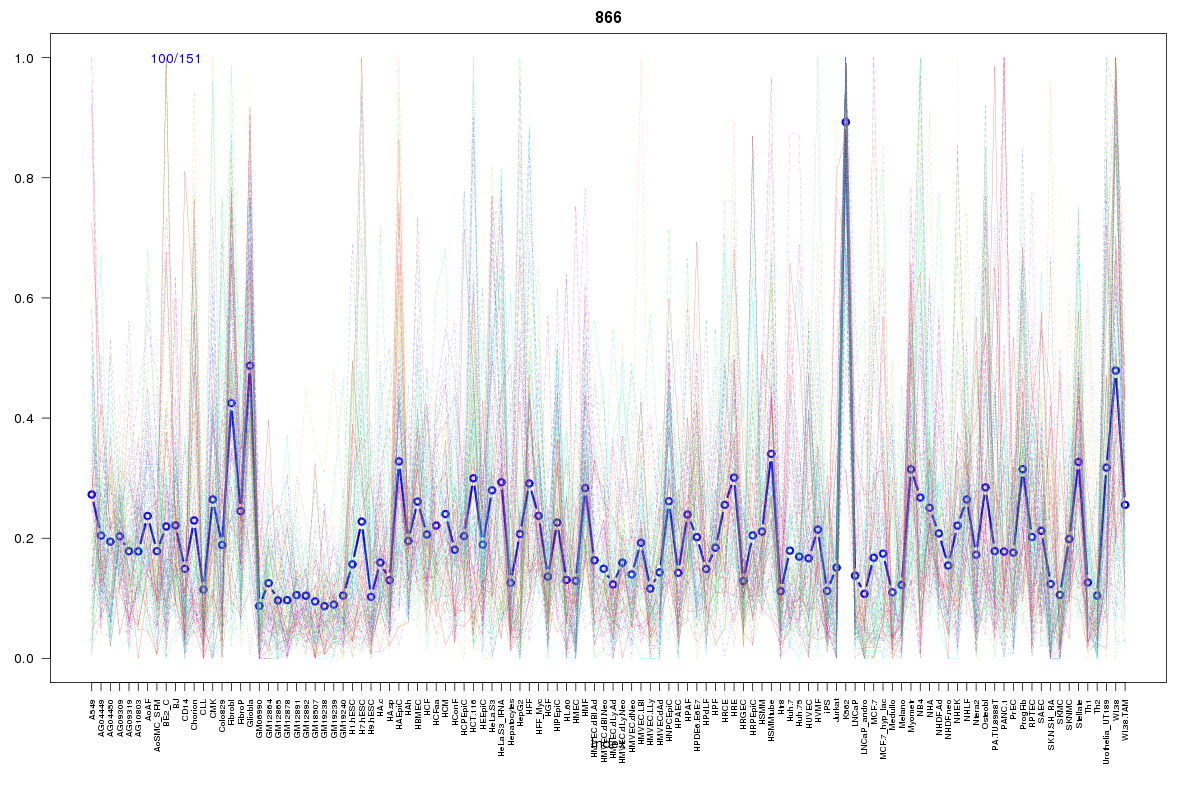 | 866 | 1 |
Resources
BED file downloads
Connects to 51 DHS sitesTop 10 Correlated DHS Sites
p-values indiciate significant higher or lower correlation| Location | Cluster | P-value |
|---|---|---|
| chr19:3562480-3562630 | 1826 | 0.001 |
| chr19:3684180-3684330 | 19 | 0.003 |
| chr19:3576300-3576450 | 1078 | 0.006 |
| chr19:3563040-3563190 | 1724 | 0.008 |
| chr19:3569005-3569155 | 1777 | 0.01 |
| chr19:3570585-3570735 | 1777 | 0.012 |
| chr19:3568820-3568970 | 564 | 0.012 |
| chr19:3565300-3565450 | 1826 | 0.012 |
| chr19:3539460-3539610 | 1777 | 0.012 |
| chr19:3539740-3539890 | 1777 | 0.013 |
| chr19:3518680-3518830 | 862 | 0.016 |
External Databases
UCSCEnsembl (ENSG00000105298)