Gene: ECM1
chr1: 150480537-150486029Expression Profile
(log scale)
Graphical Connections
Distribution of linked clusters:
You may find it interesting if many of the connected DHS sites belong to the same cluster.| Cluster Profile | Cluster ID | Number of DHS sites in this cluster |
|---|---|---|
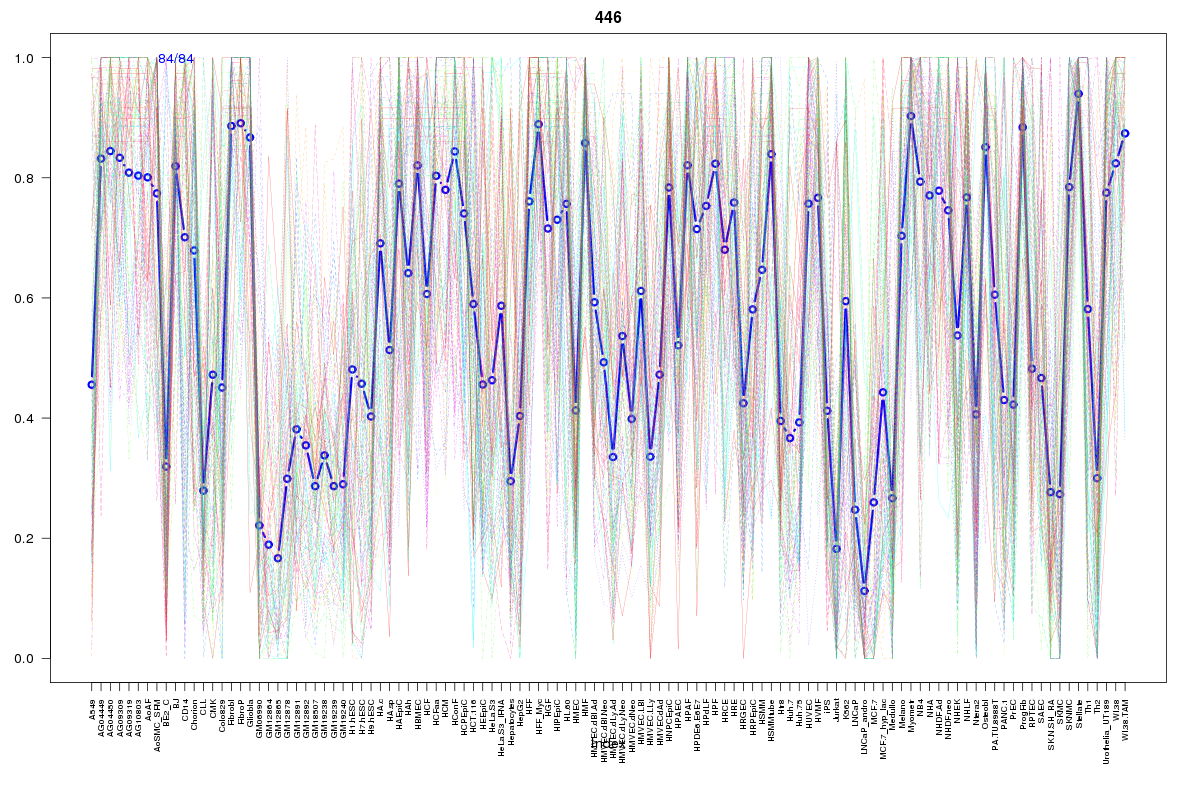 | 446 | 2 |
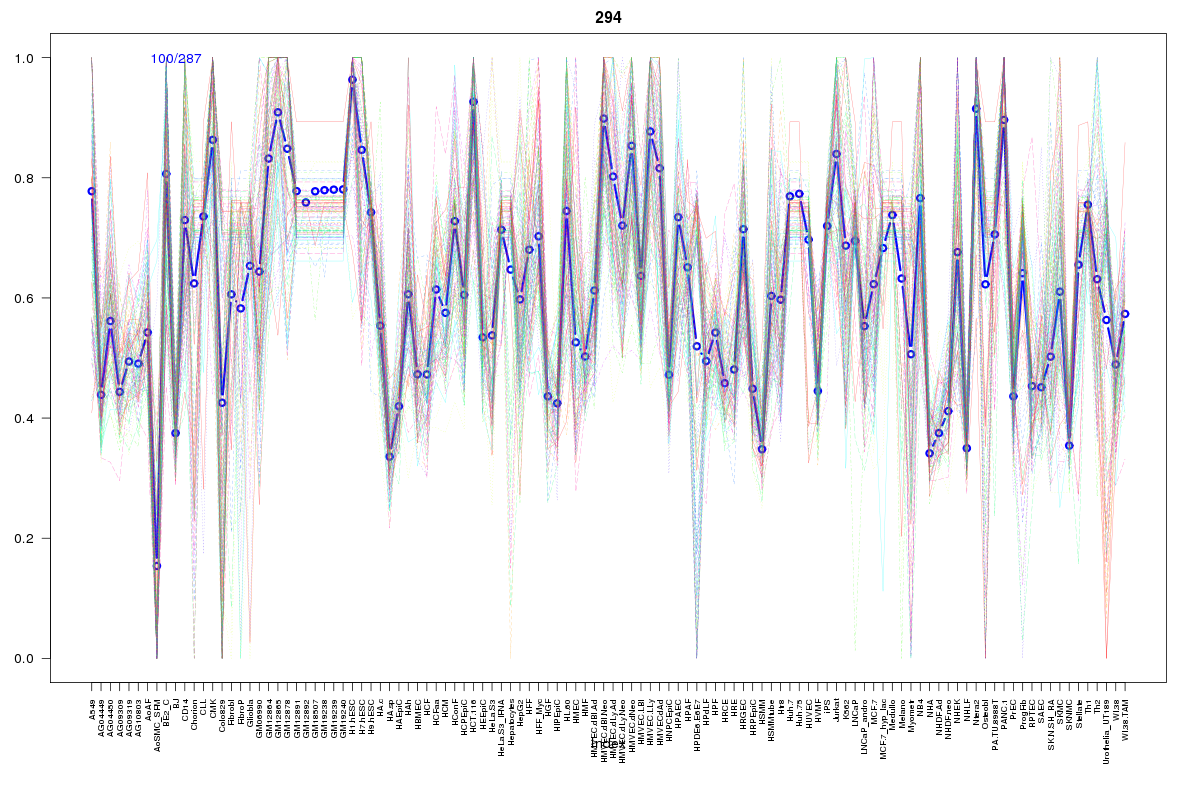 | 294 | 1 |
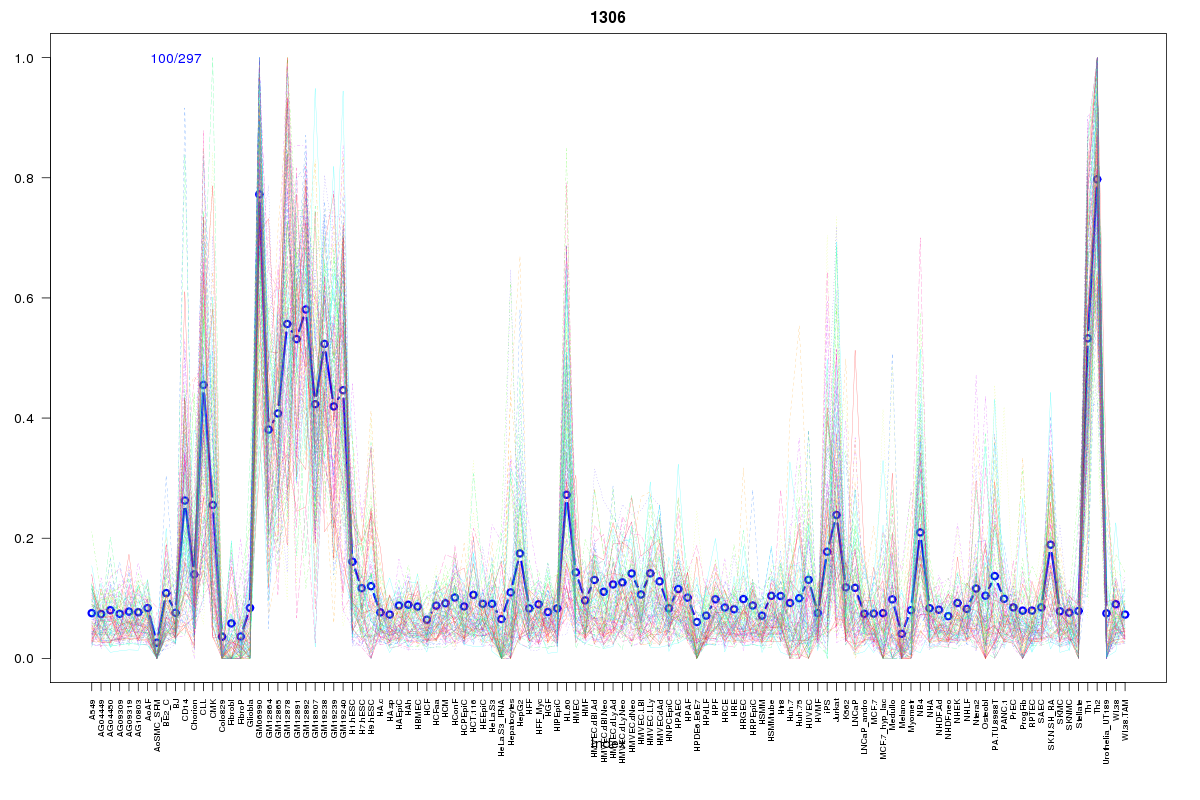 | 1306 | 1 |
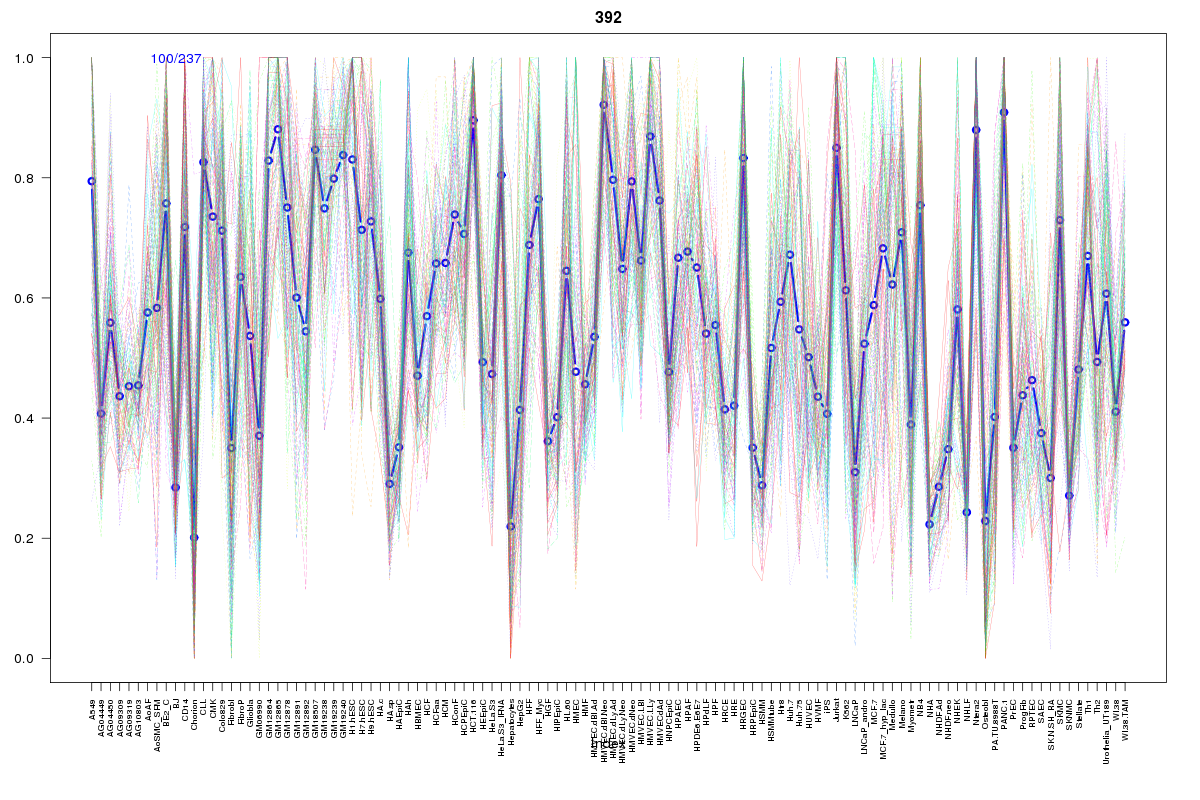 | 392 | 1 |
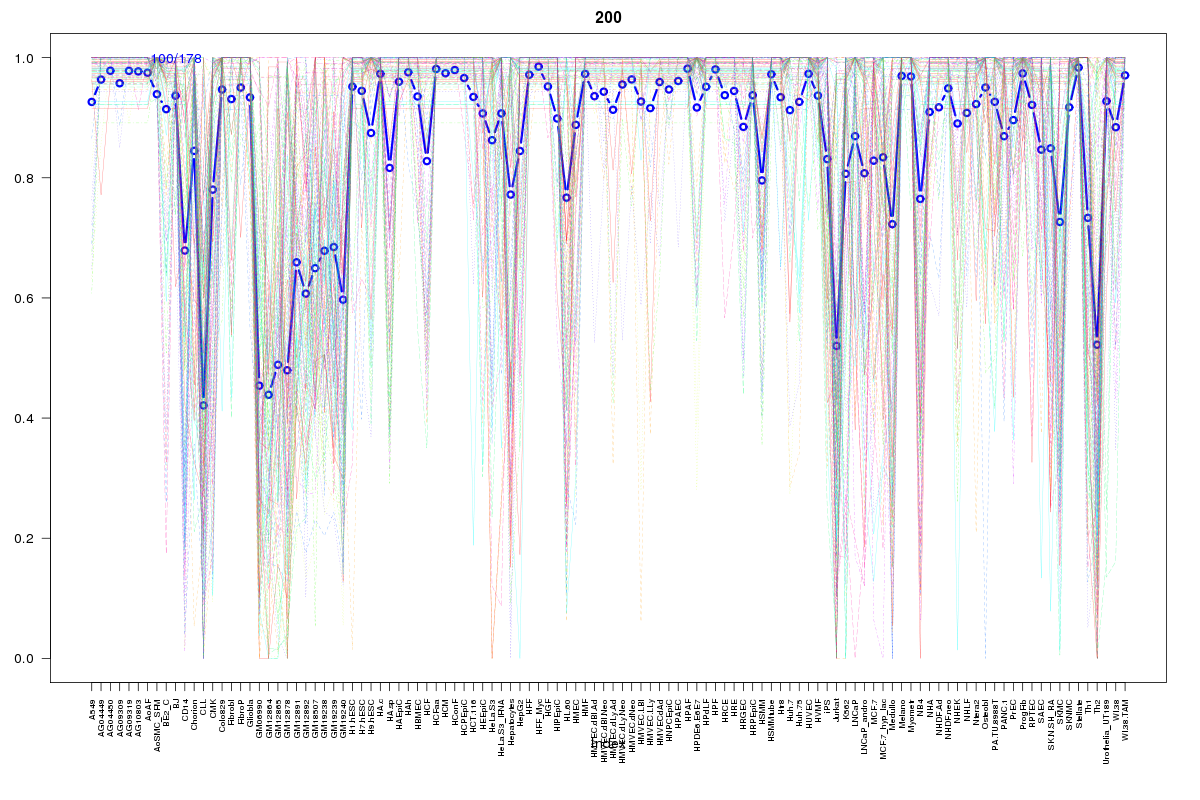 | 200 | 1 |
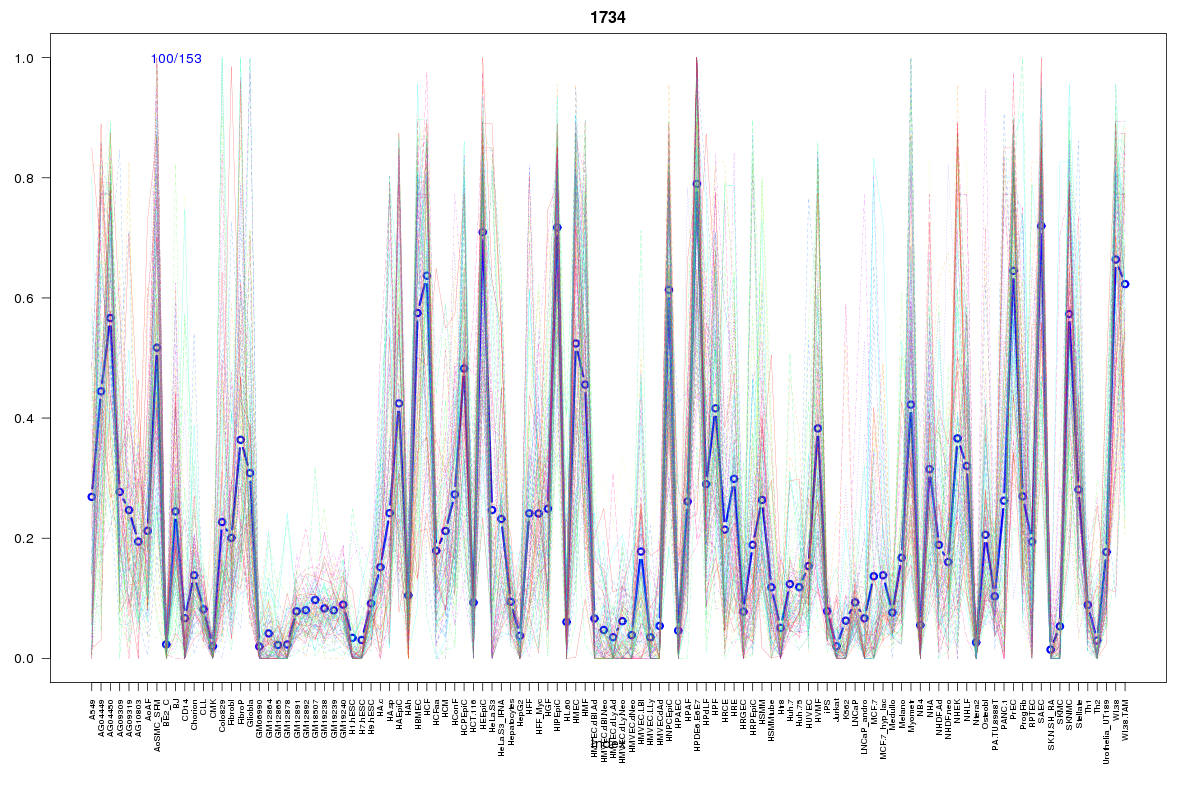 | 1734 | 1 |
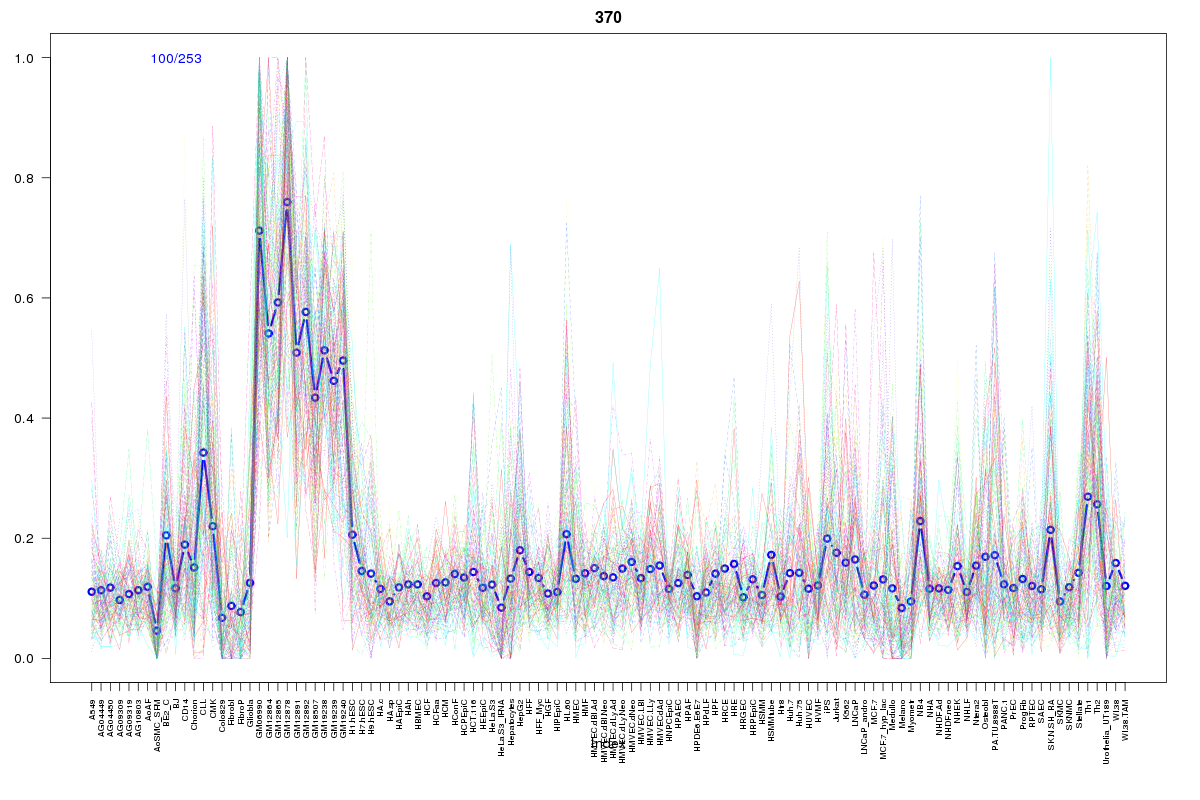 | 370 | 1 |
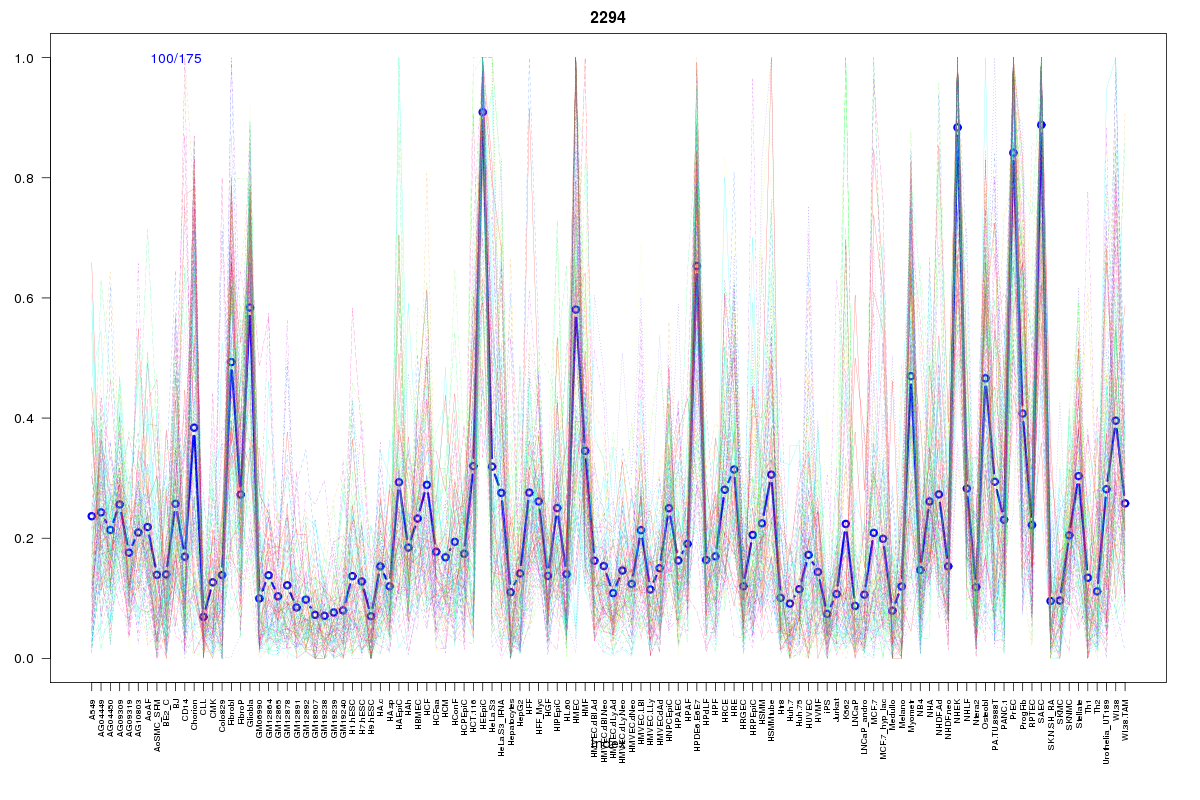 | 2294 | 1 |
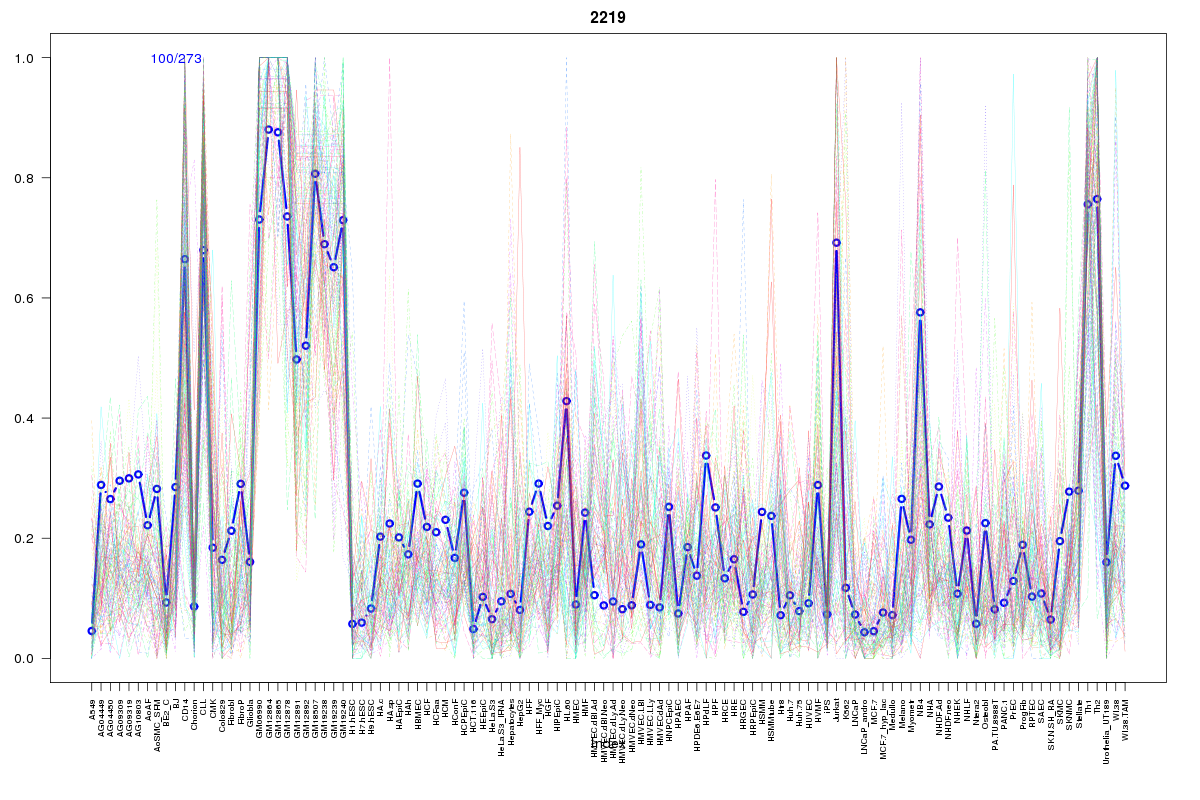 | 2219 | 1 |
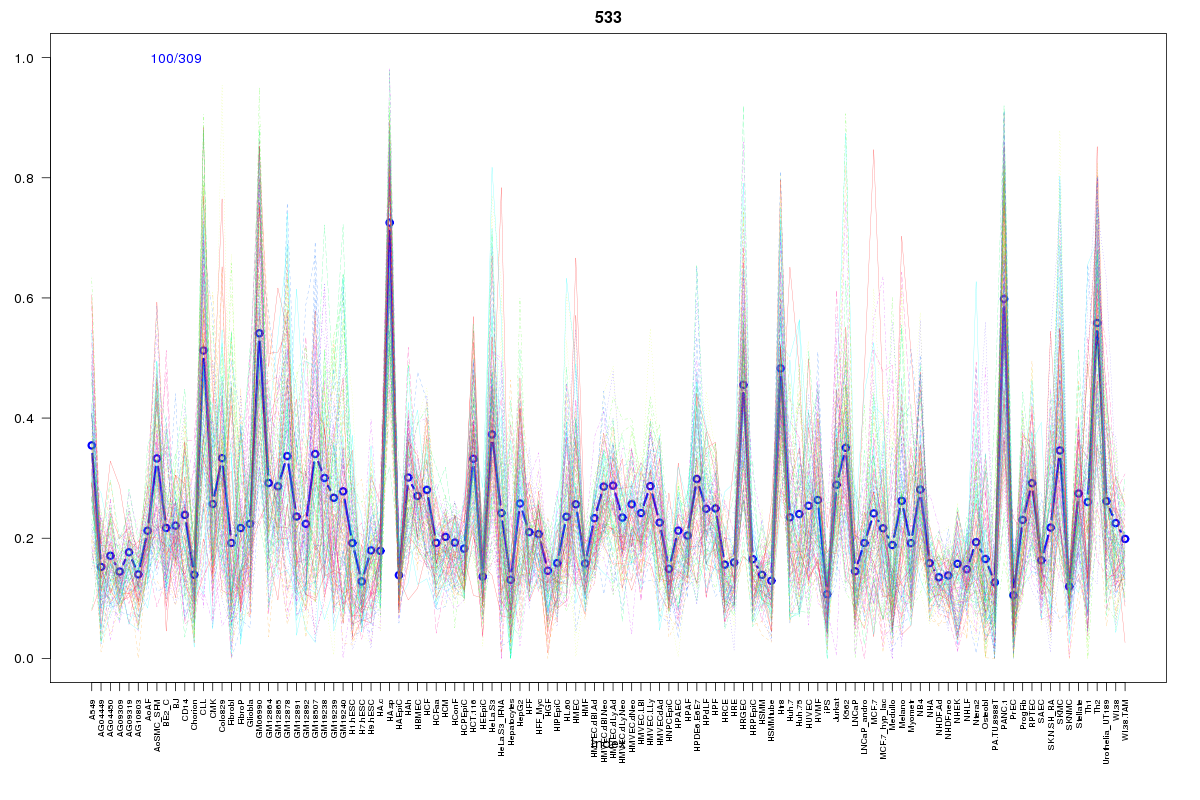 | 533 | 1 |
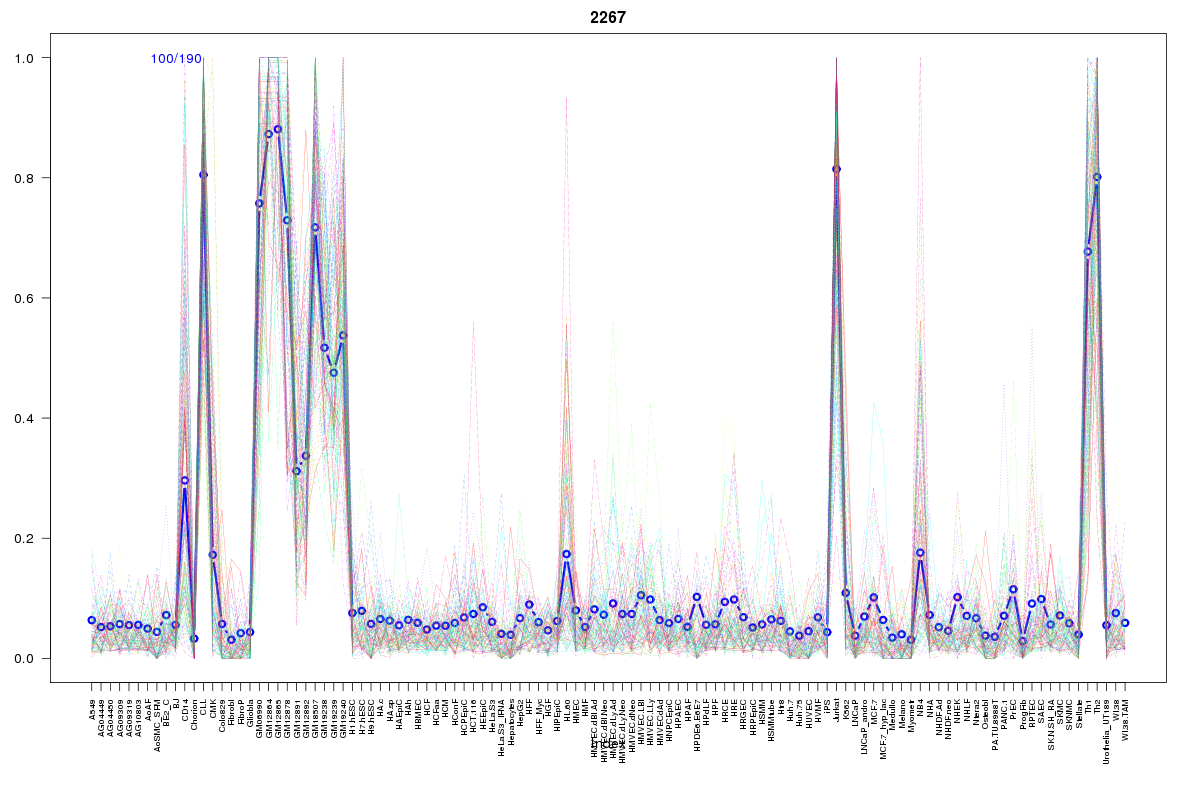 | 2267 | 1 |
 | 1923 | 1 |
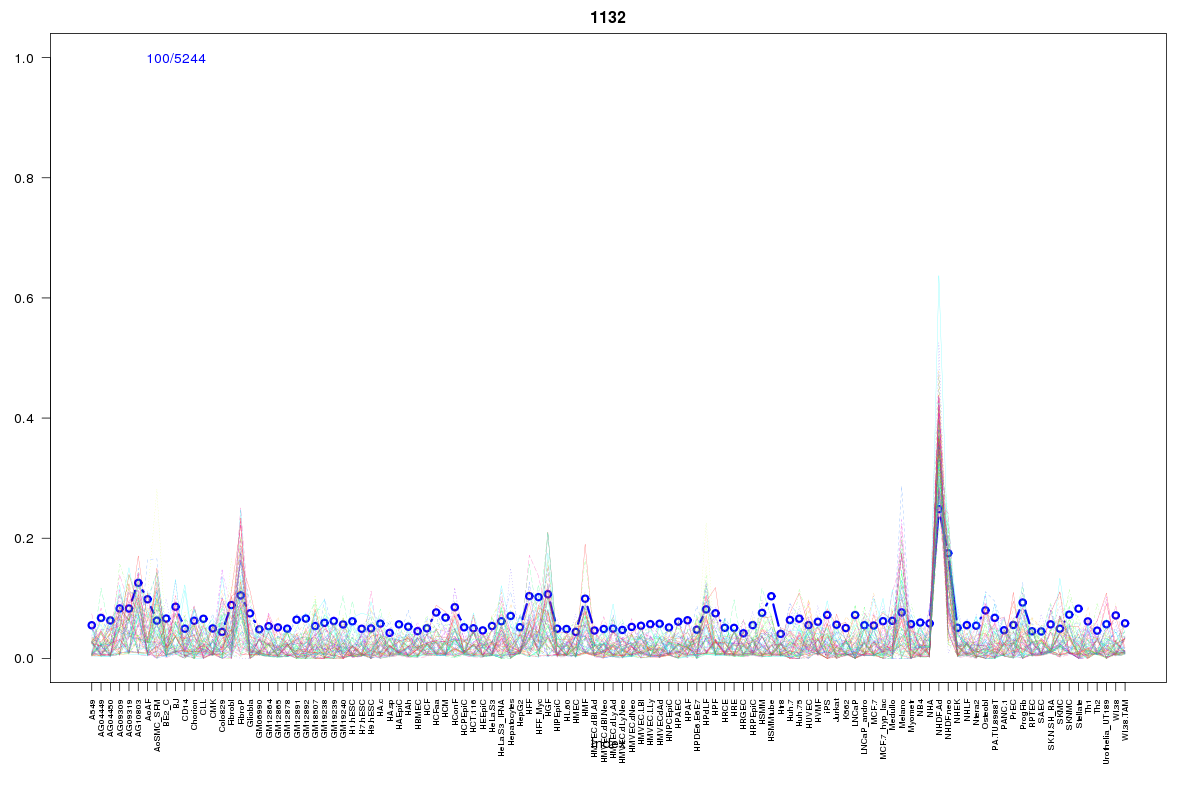 | 1132 | 1 |
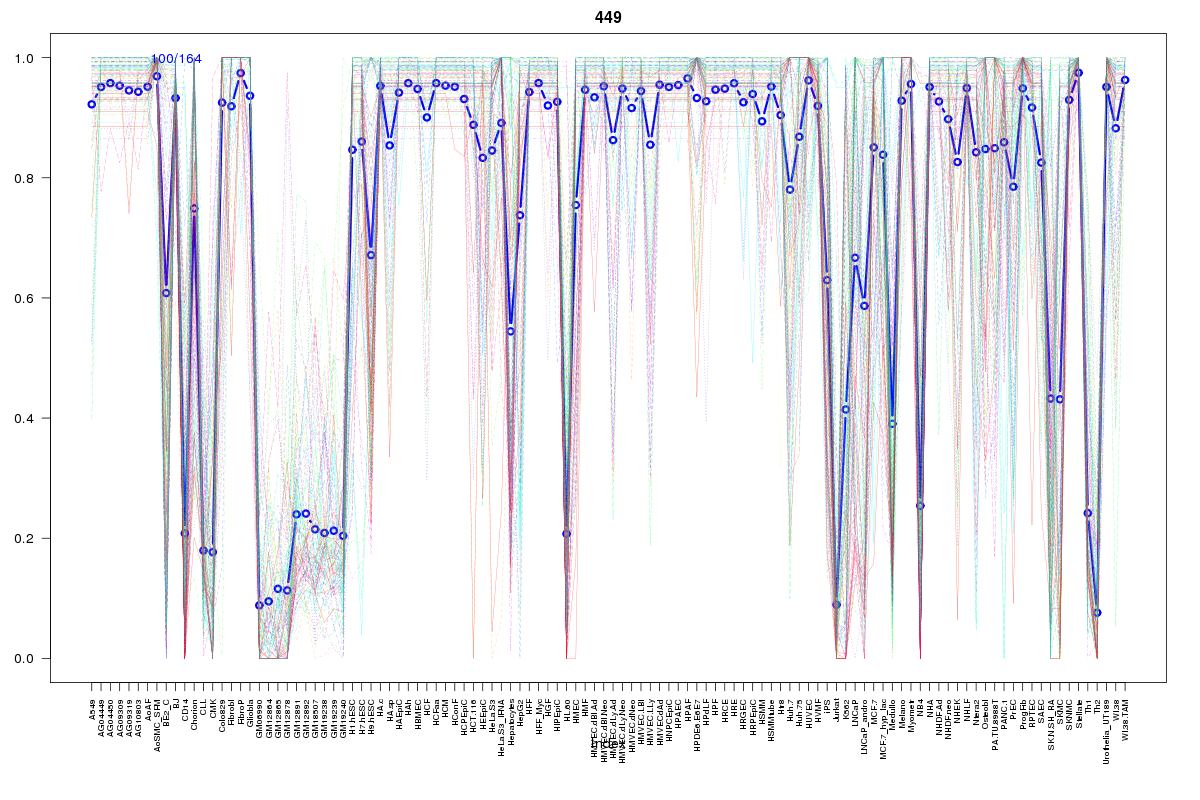 | 449 | 1 |
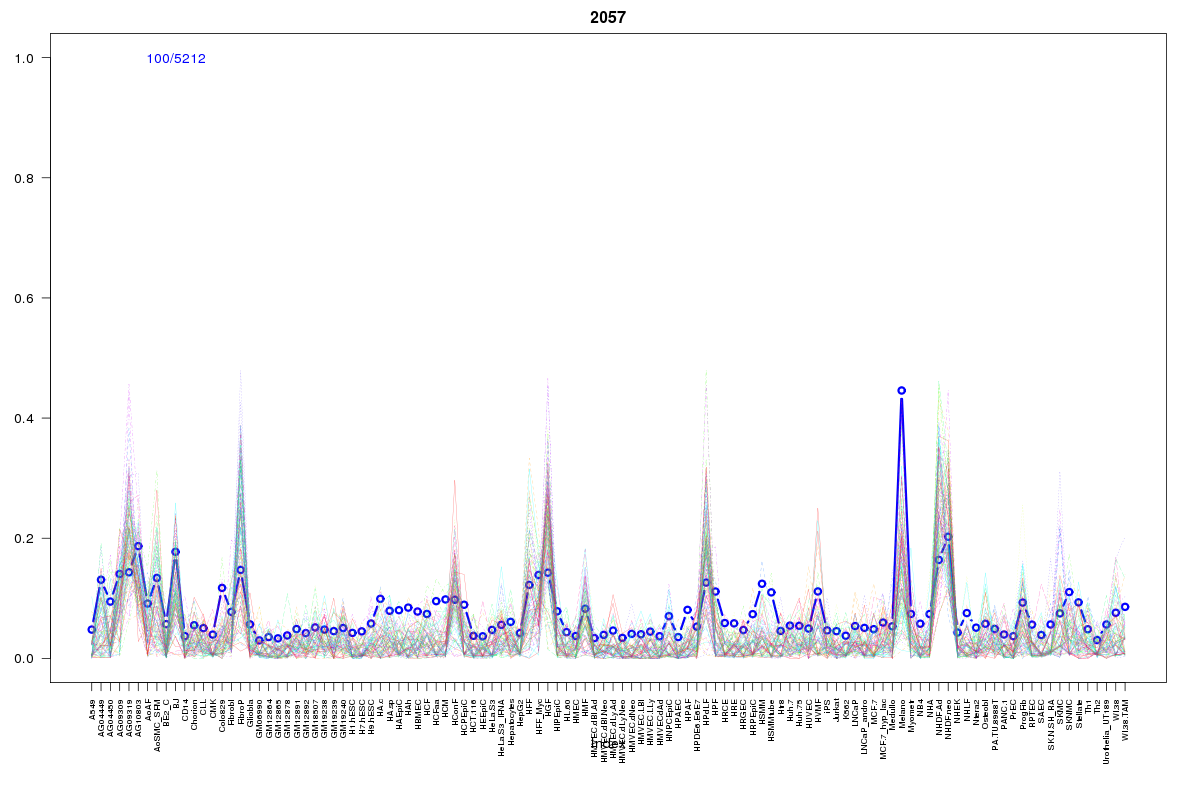 | 2057 | 1 |
 | 445 | 1 |
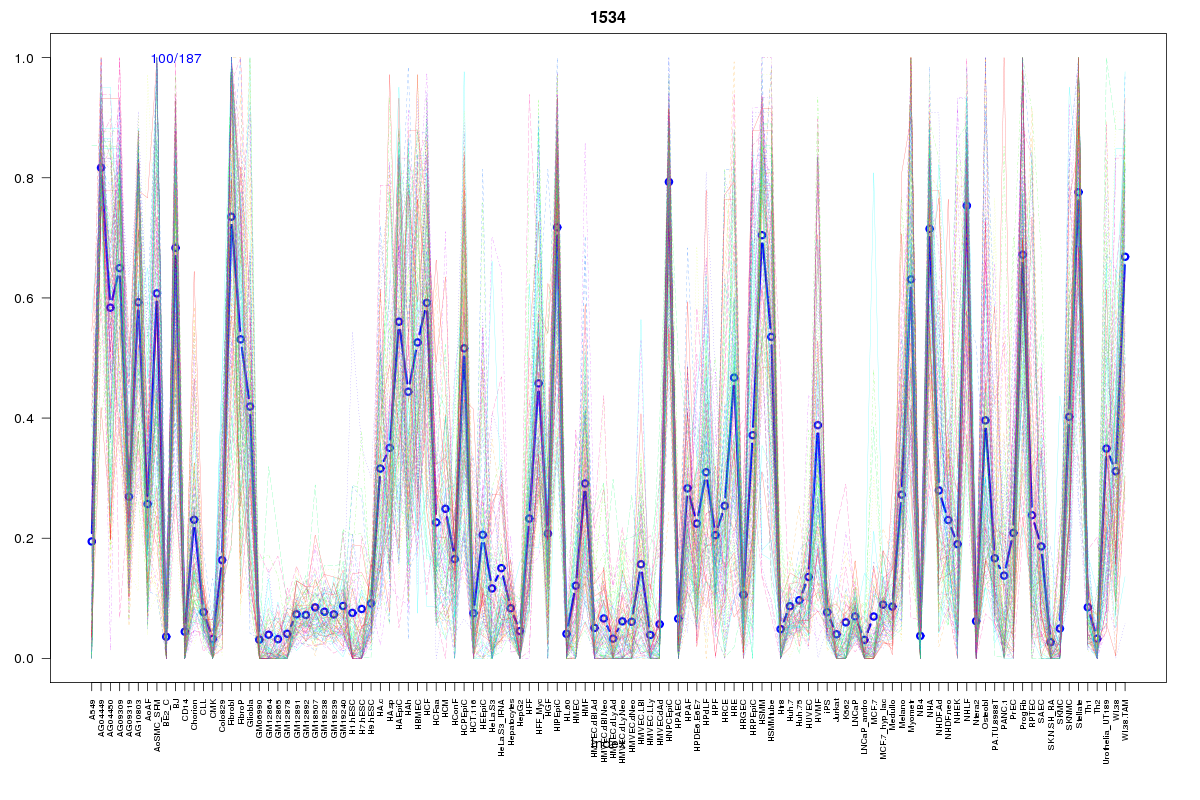 | 1534 | 1 |
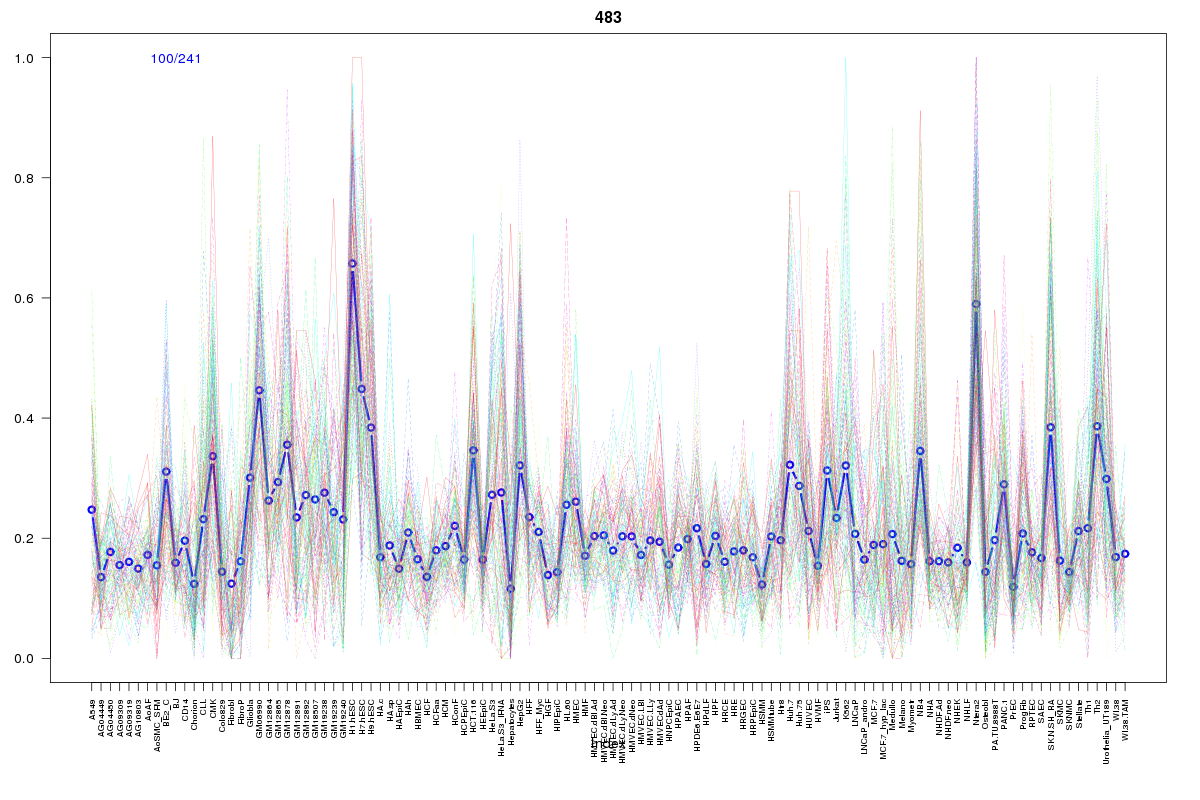 | 483 | 1 |
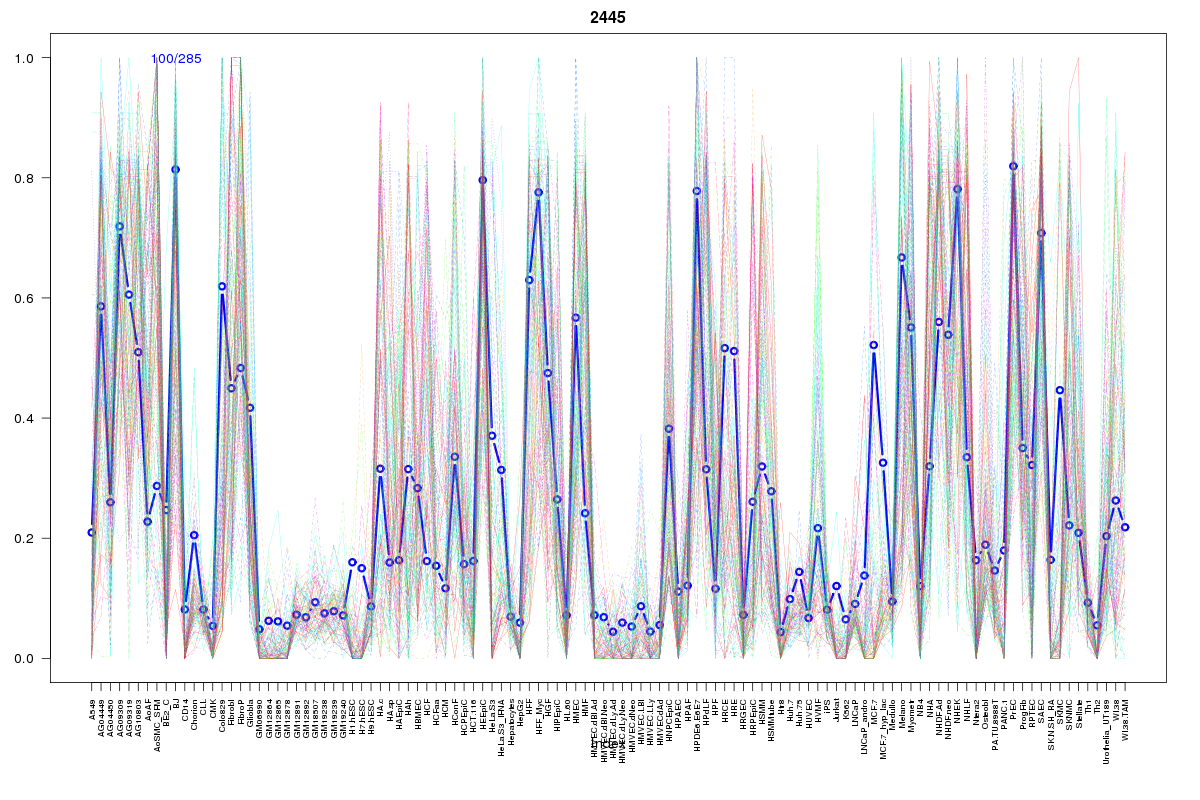 | 2445 | 1 |
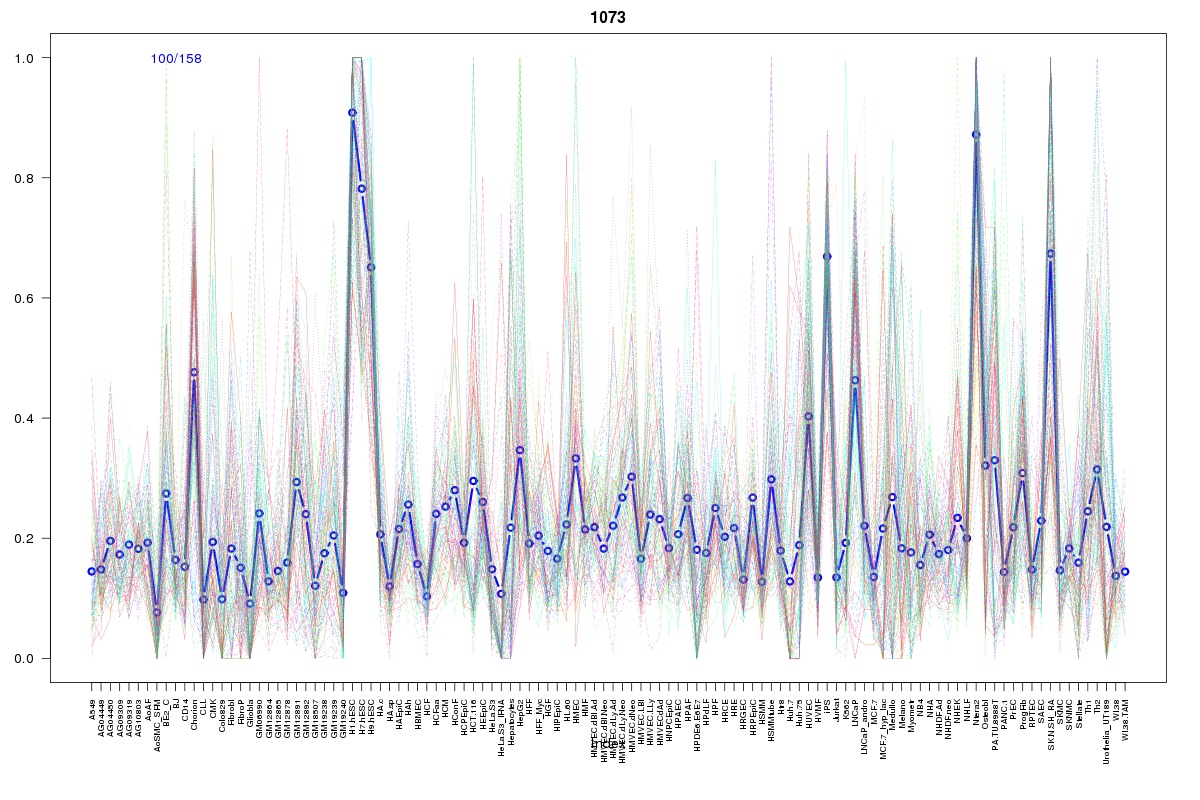 | 1073 | 1 |
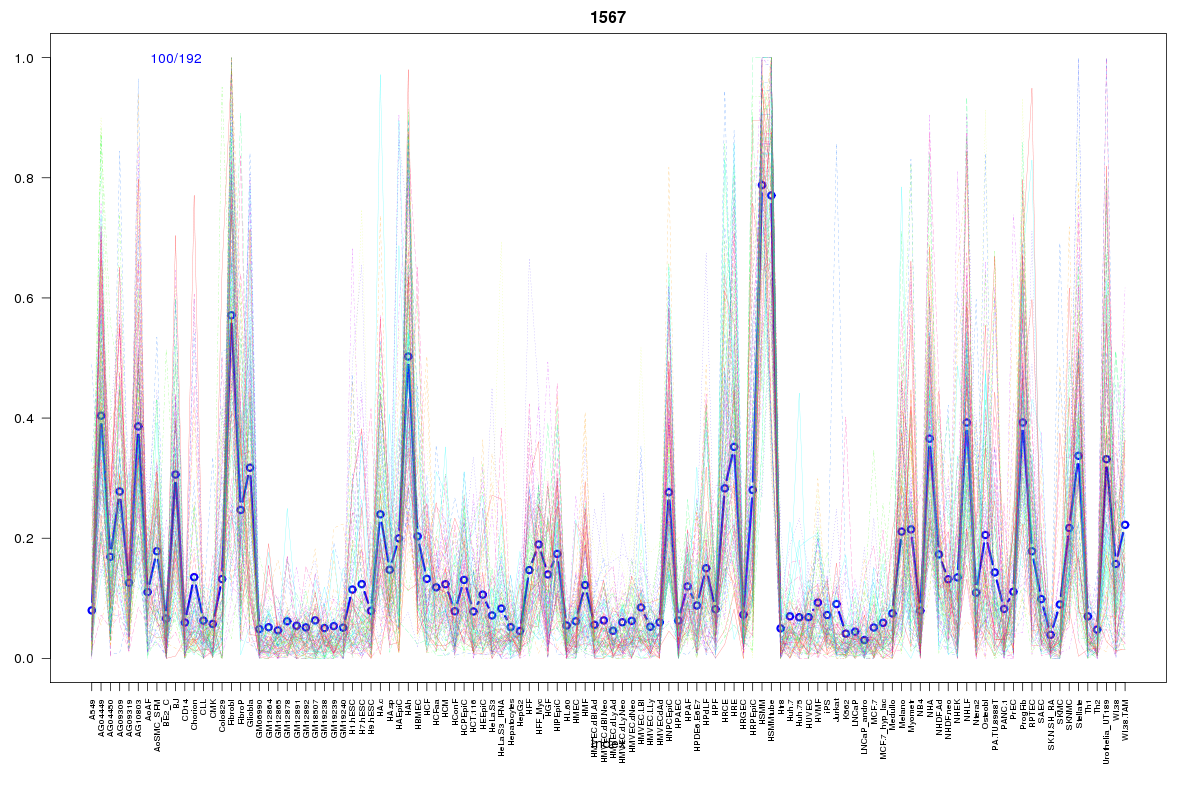 | 1567 | 1 |
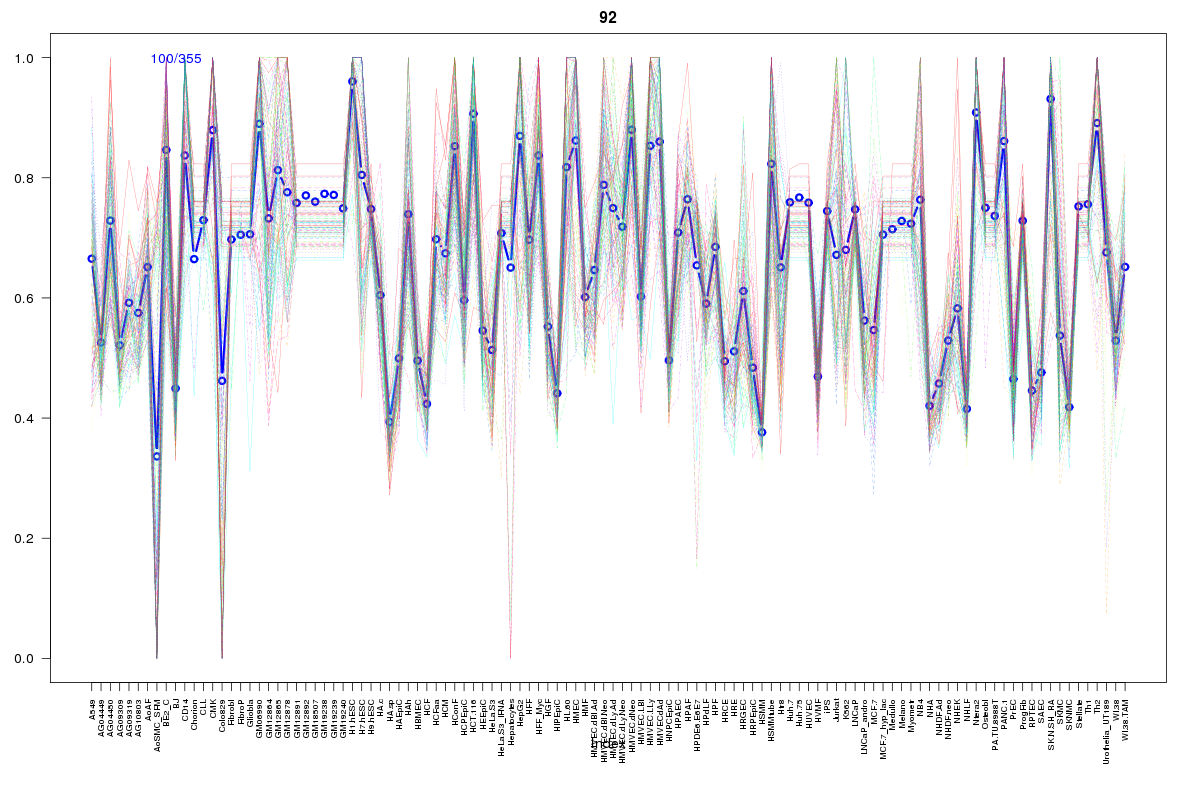 | 92 | 1 |
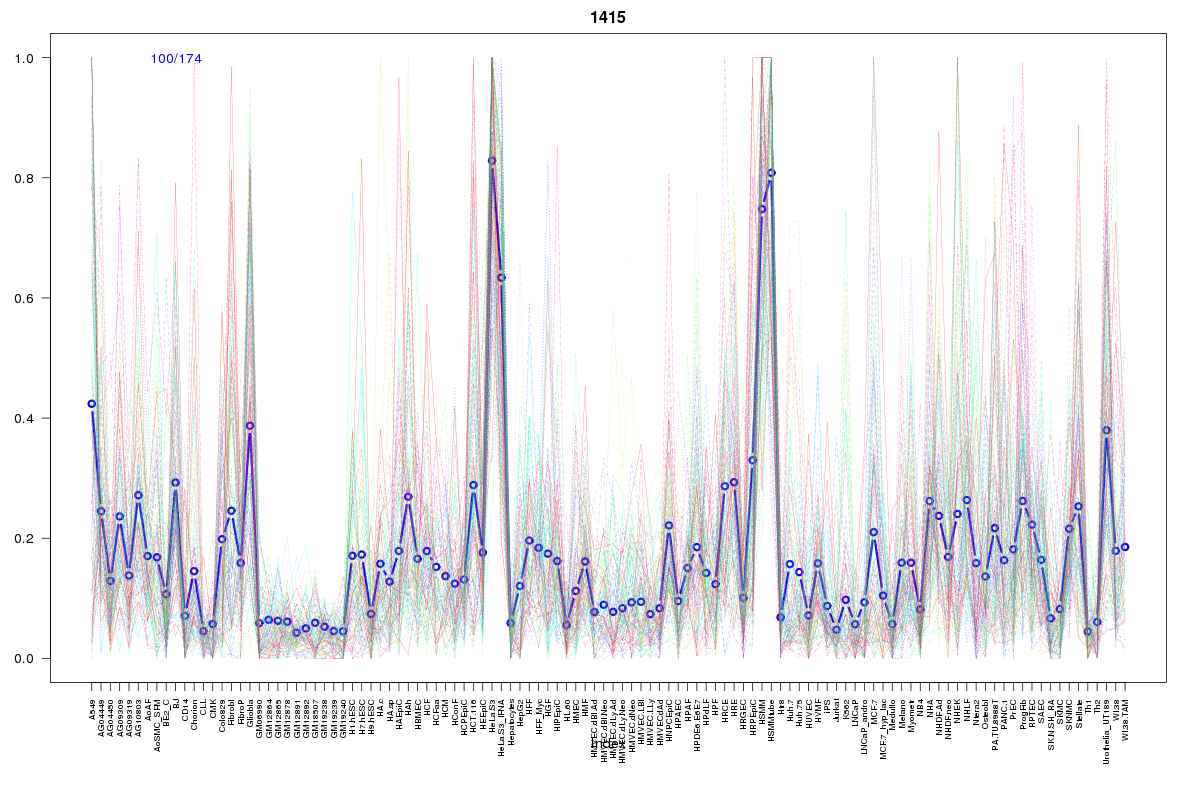 | 1415 | 1 |
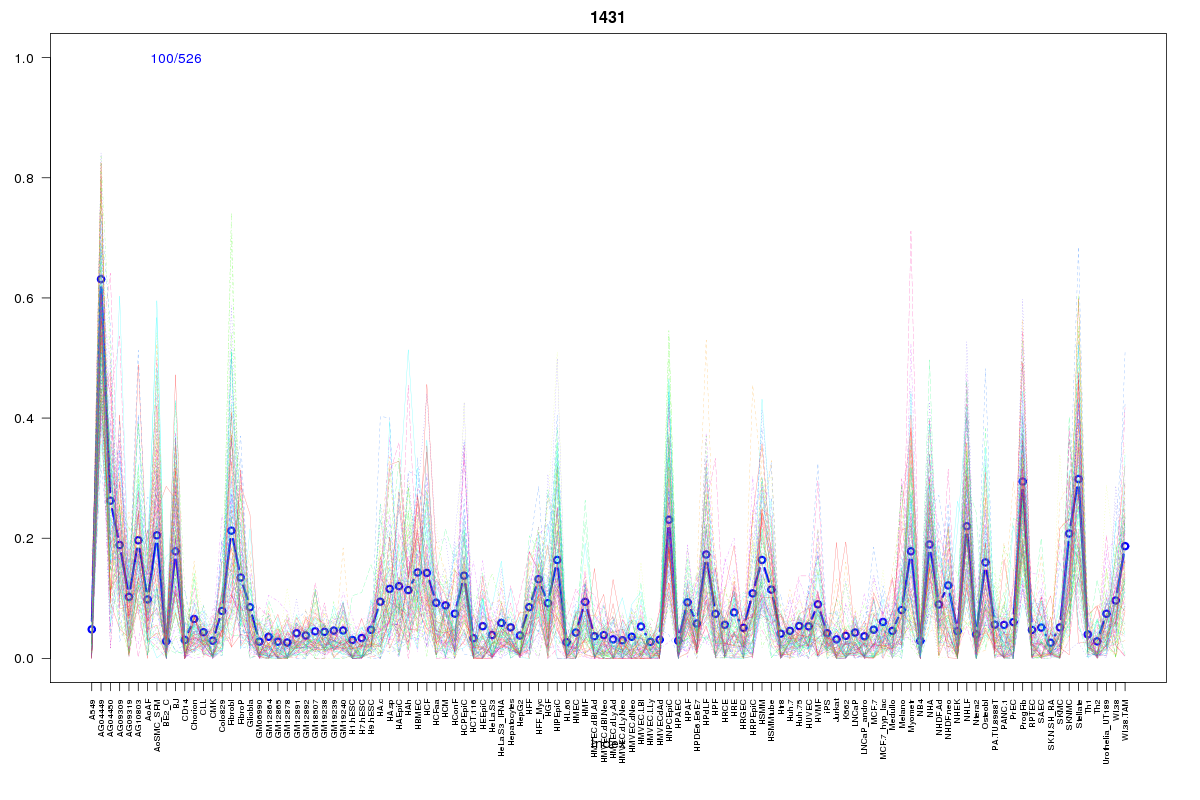 | 1431 | 1 |
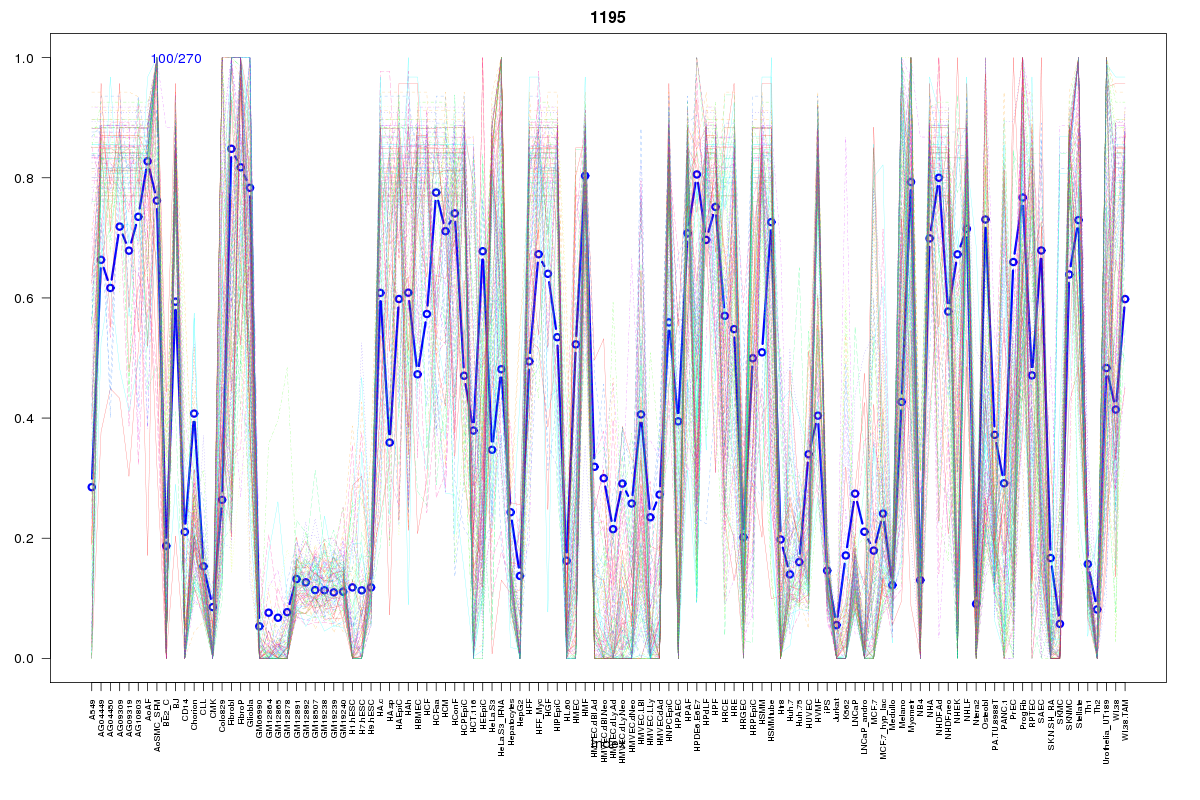 | 1195 | 1 |
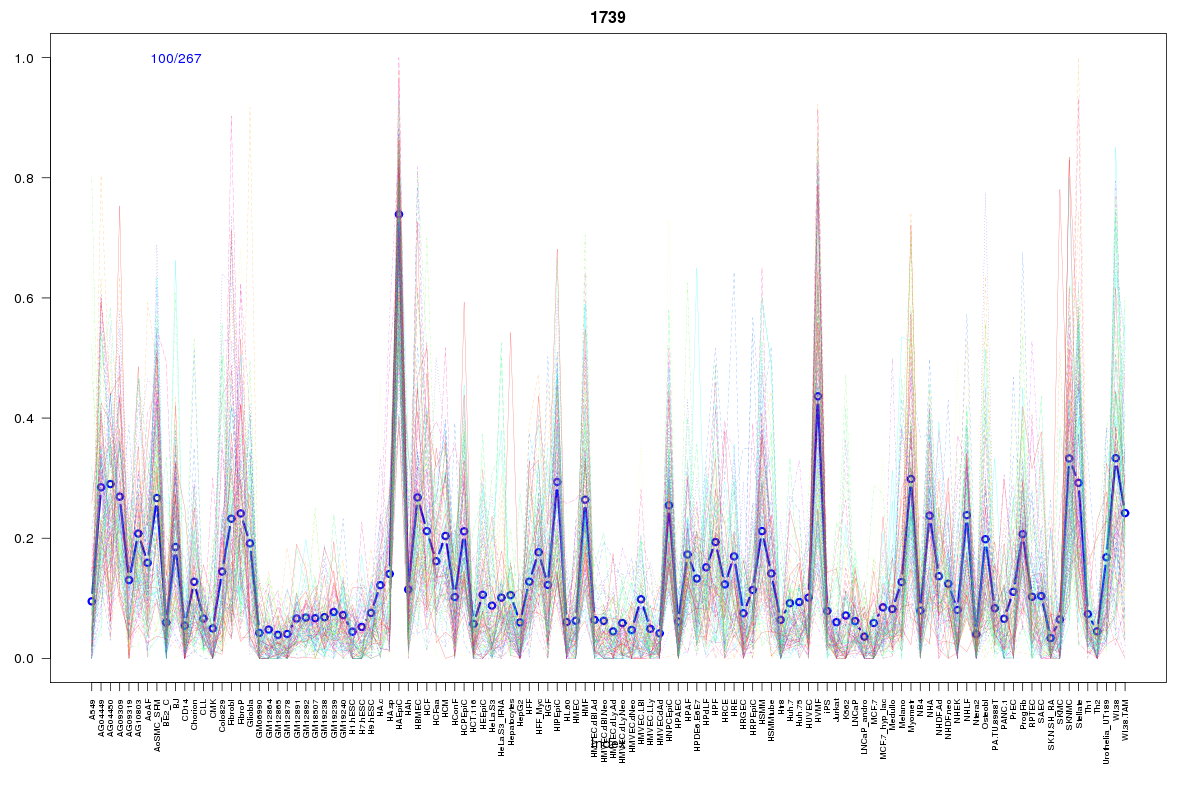 | 1739 | 1 |
 | 1070 | 1 |
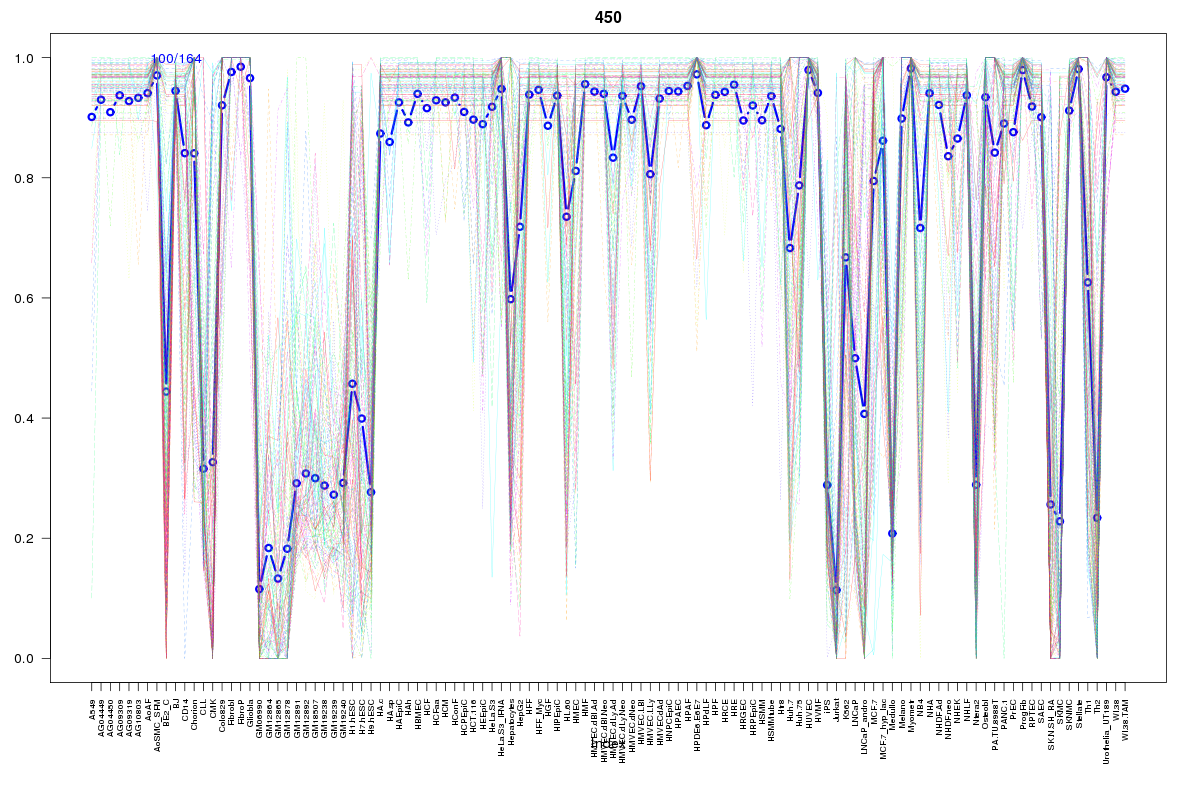 | 450 | 1 |
 | 1078 | 1 |
Resources
BED file downloads
Connects to 30 DHS sitesTop 10 Correlated DHS Sites
p-values indiciate significant higher or lower correlation| Location | Cluster | P-value |
|---|---|---|
| chr1:150480420-150480570 | 446 | 0 |
| chr1:150500840-150500990 | 1534 | 0 |
| chr1:150510580-150510730 | 1195 | 0.001 |
| chr1:150501620-150501770 | 2445 | 0.004 |
| chr1:150524920-150525070 | 446 | 0.006 |
| chr1:150577300-150577450 | 450 | 0.006 |
| chr1:150540780-150540930 | 449 | 0.009 |
| chr1:150521120-150521270 | 1070 | 0.009 |
| chr1:150508520-150508670 | 1415 | 0.009 |
| chr1:150485440-150485590 | 2057 | 0.01 |
| chr1:150533920-150534070 | 200 | 0.015 |
External Databases
UCSCEnsembl (ENSG00000143369)