Gene: FITM2
chr20: 42931477-42939809Expression Profile
(log scale)
Graphical Connections
Distribution of linked clusters:
You may find it interesting if many of the connected DHS sites belong to the same cluster.| Cluster Profile | Cluster ID | Number of DHS sites in this cluster |
|---|---|---|
 | 1355 | 3 |
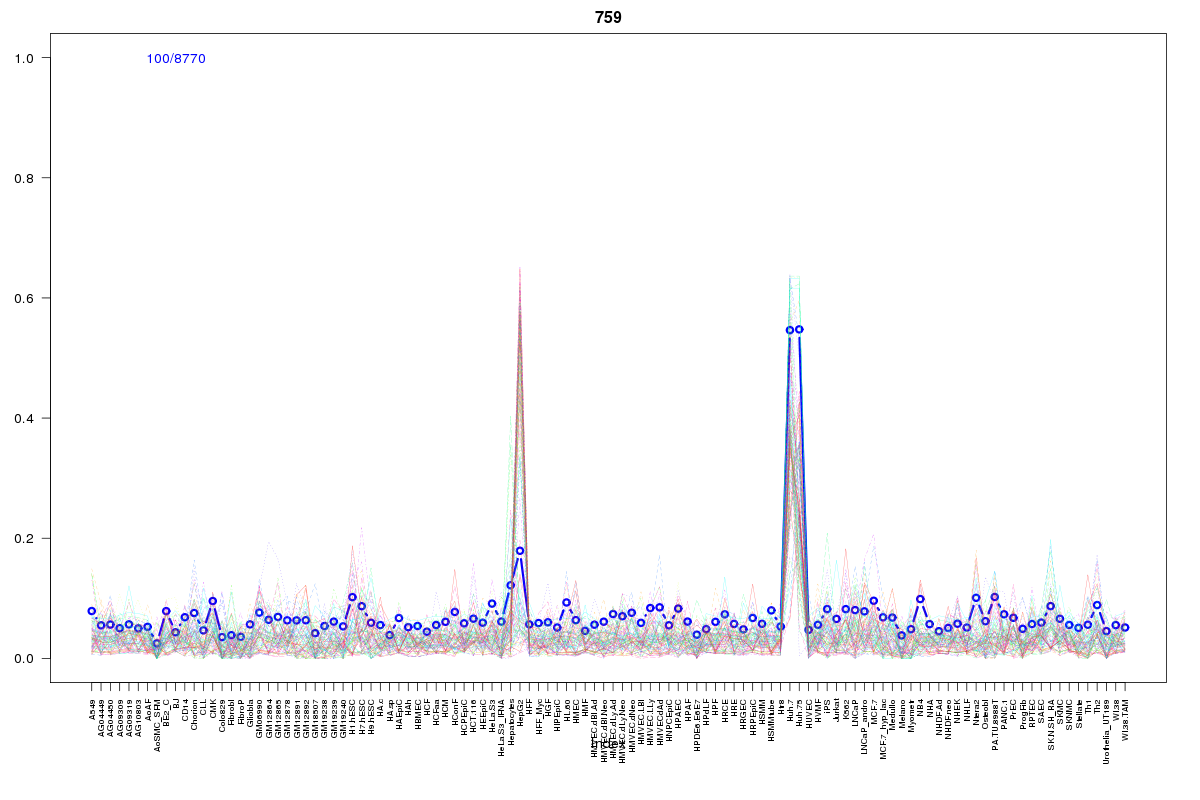 | 759 | 2 |
 | 1724 | 2 |
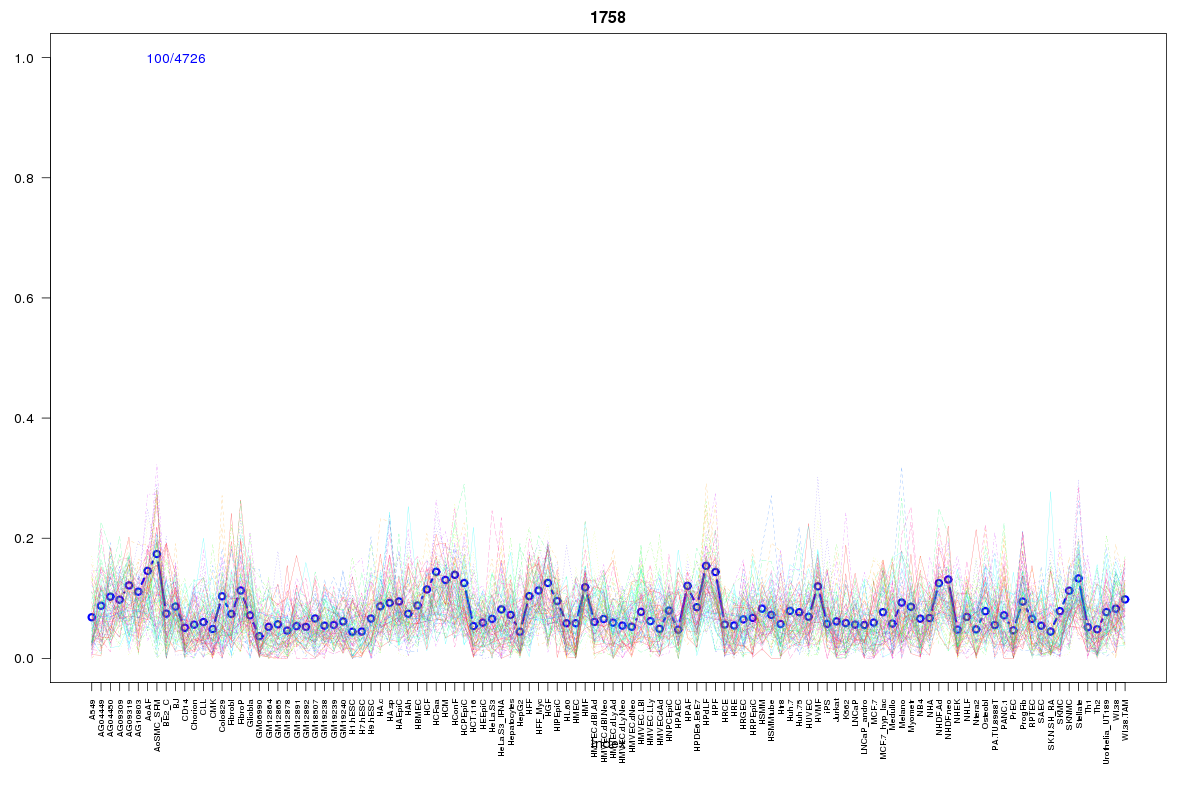 | 1758 | 2 |
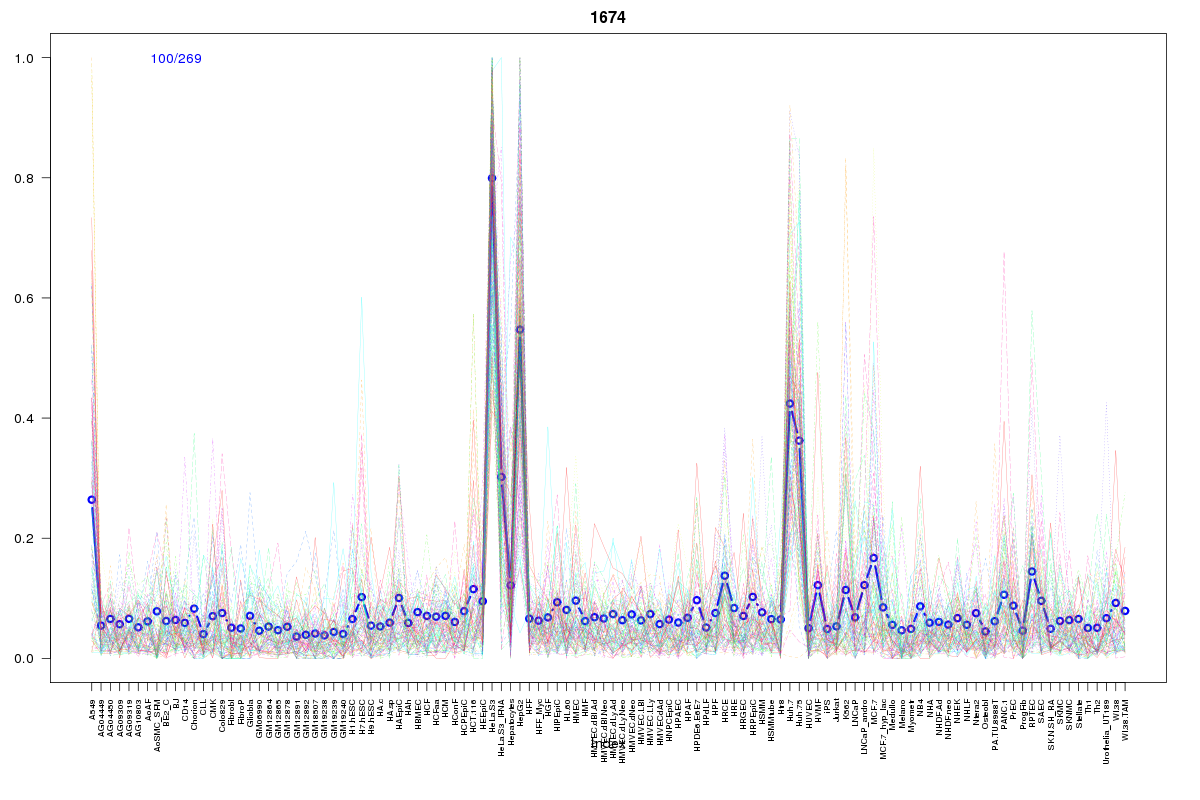 | 1674 | 2 |
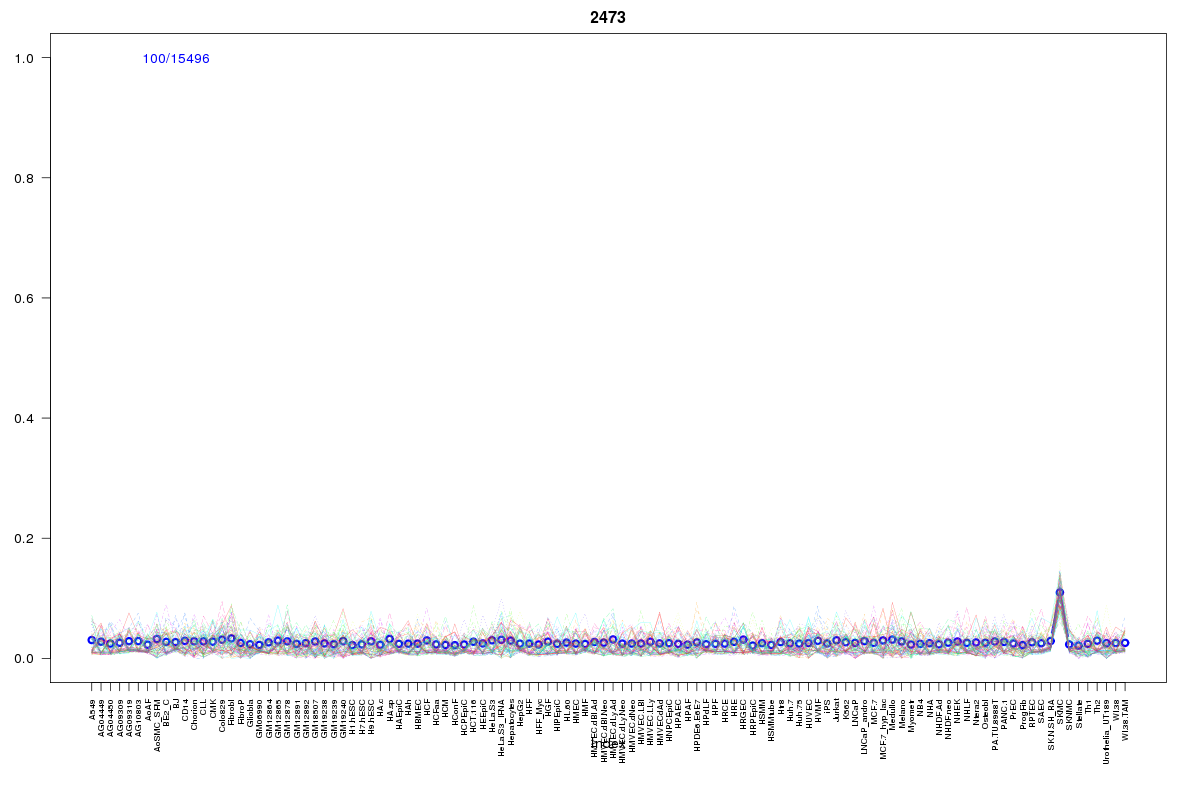 | 2473 | 1 |
 | 416 | 1 |
 | 2055 | 1 |
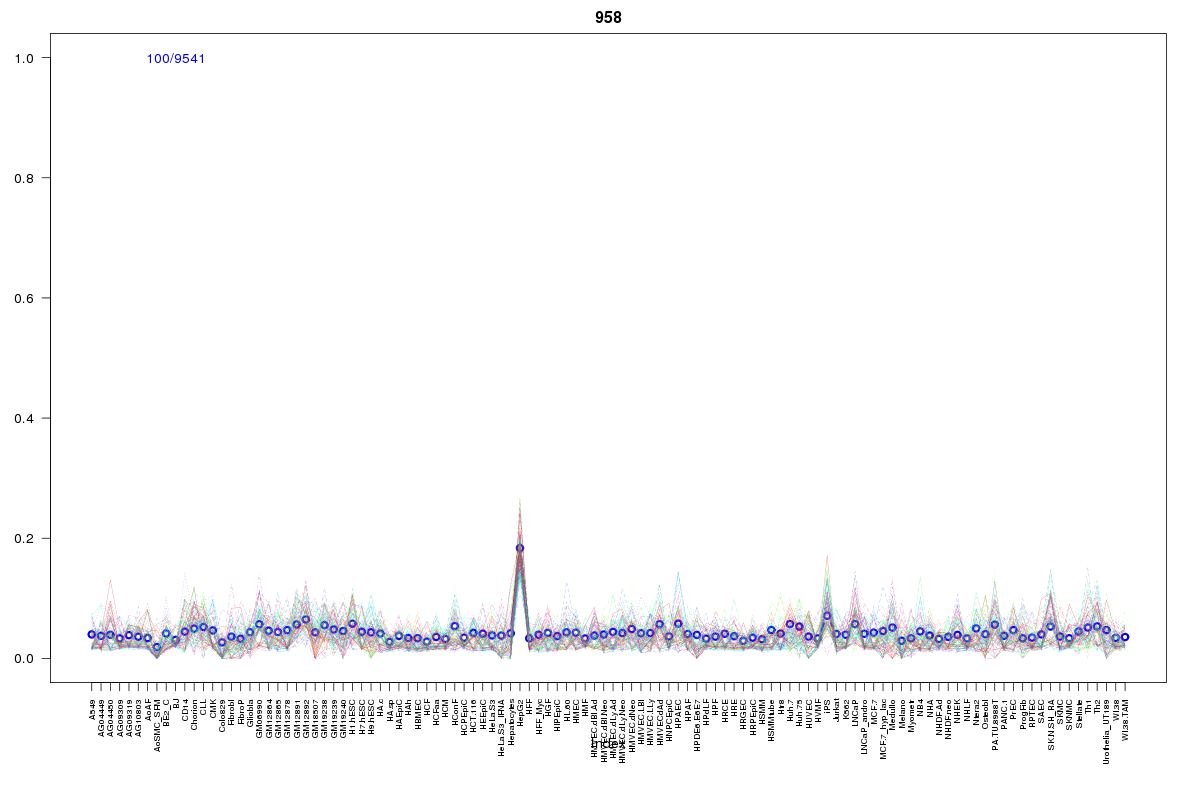 | 958 | 1 |
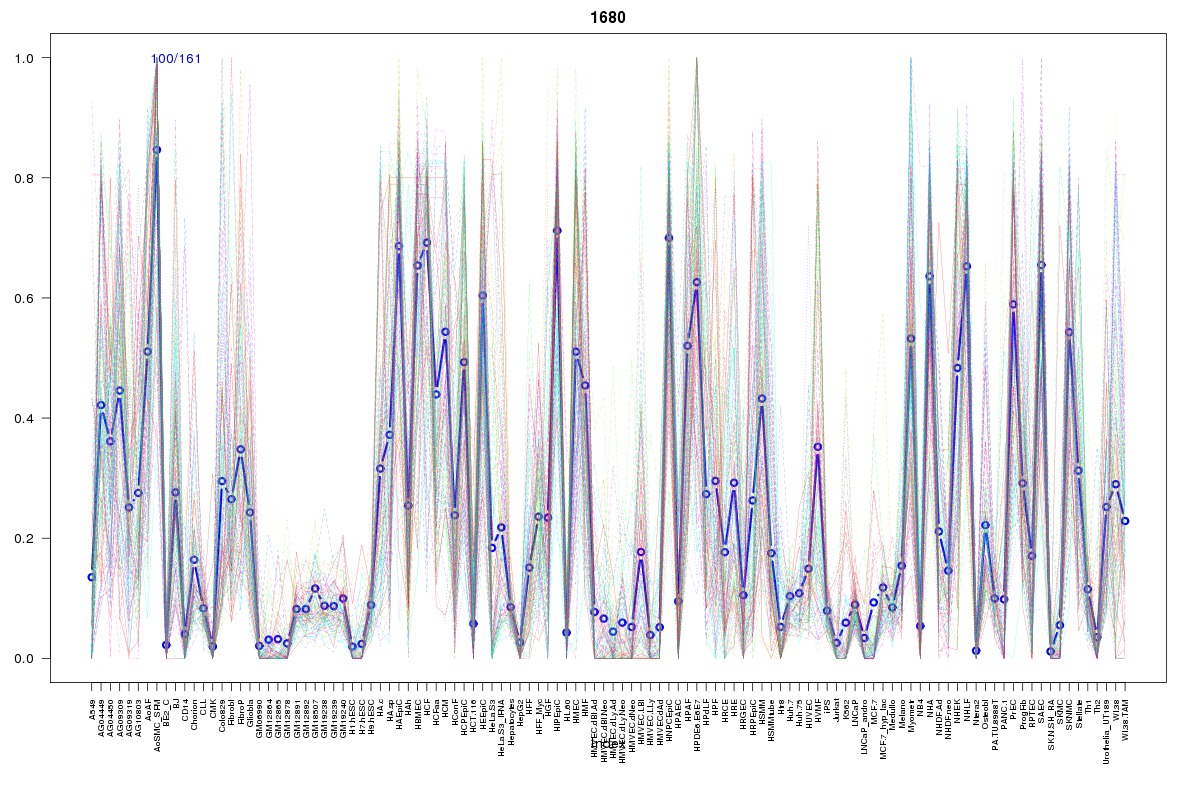 | 1680 | 1 |
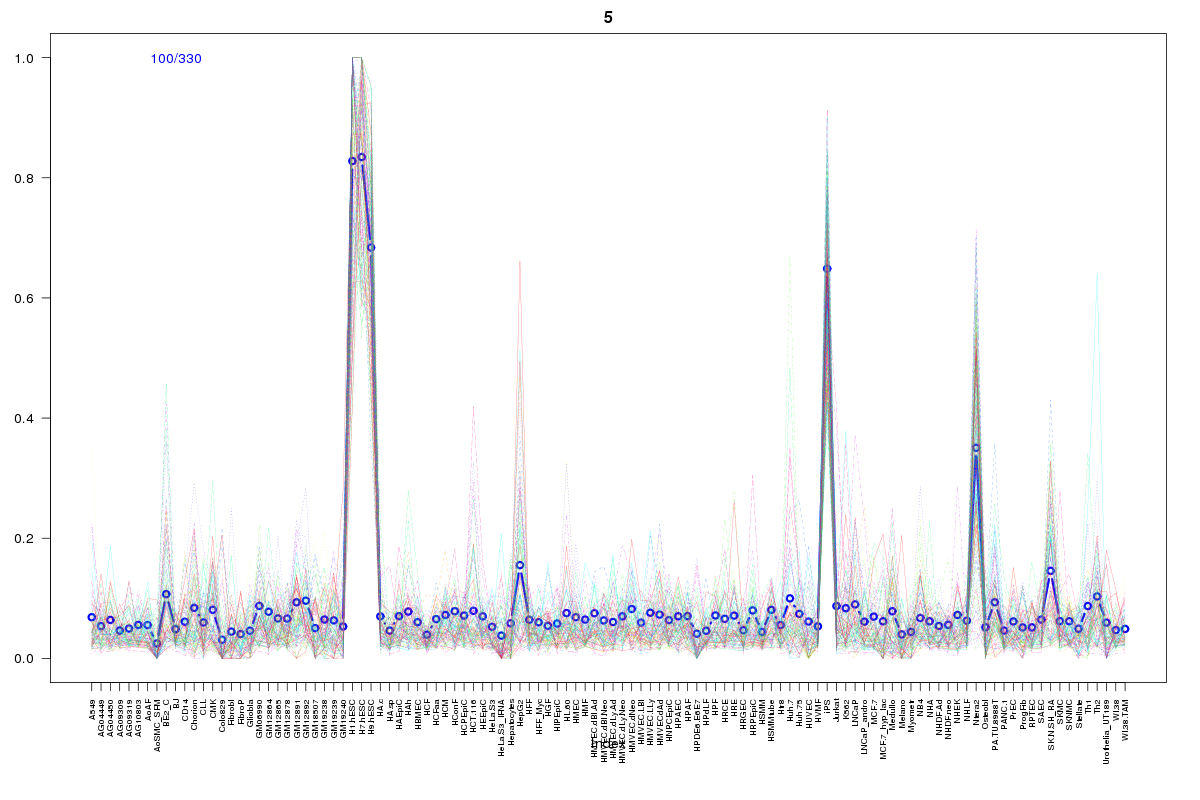 | 5 | 1 |
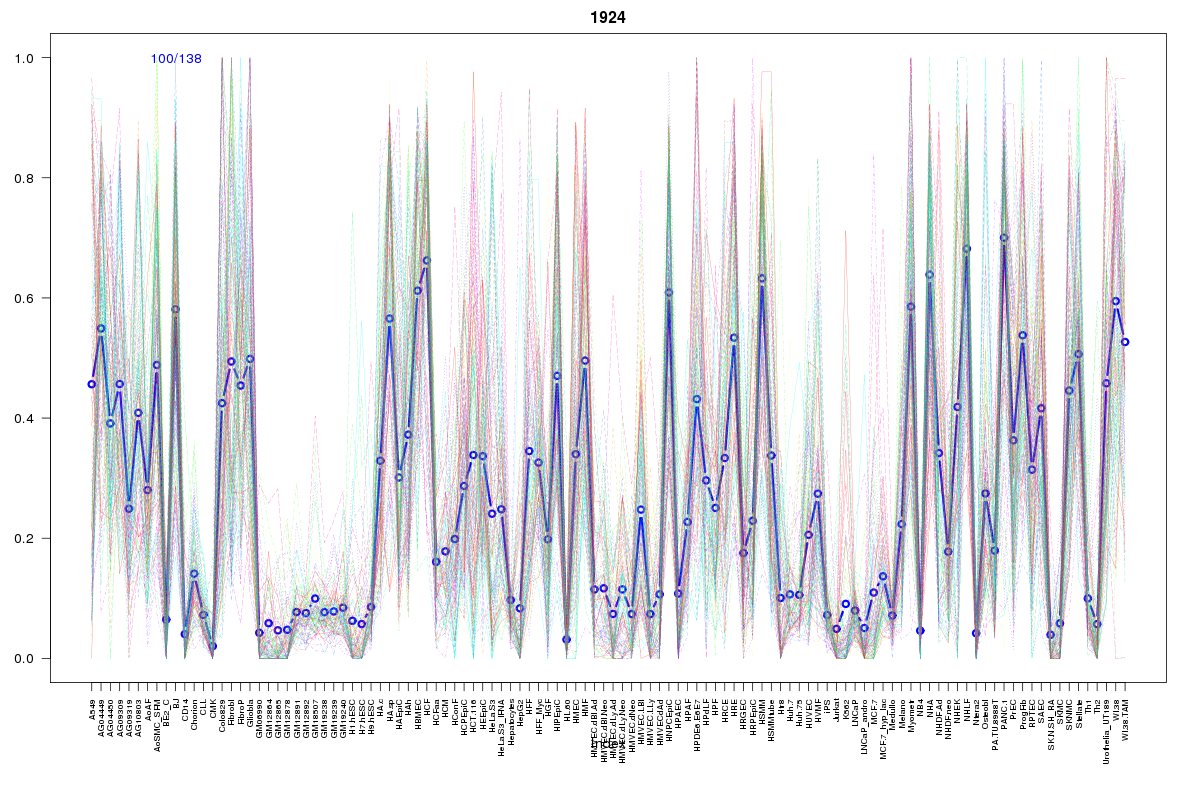 | 1924 | 1 |
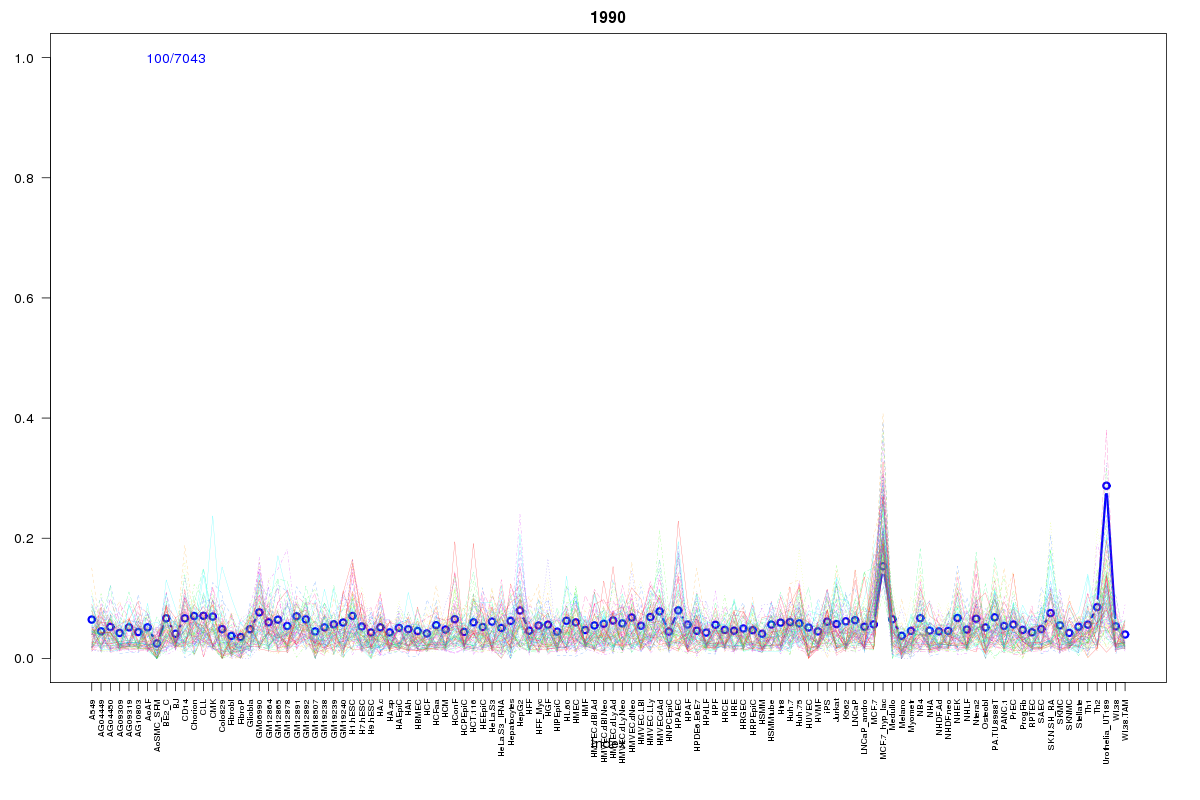 | 1990 | 1 |
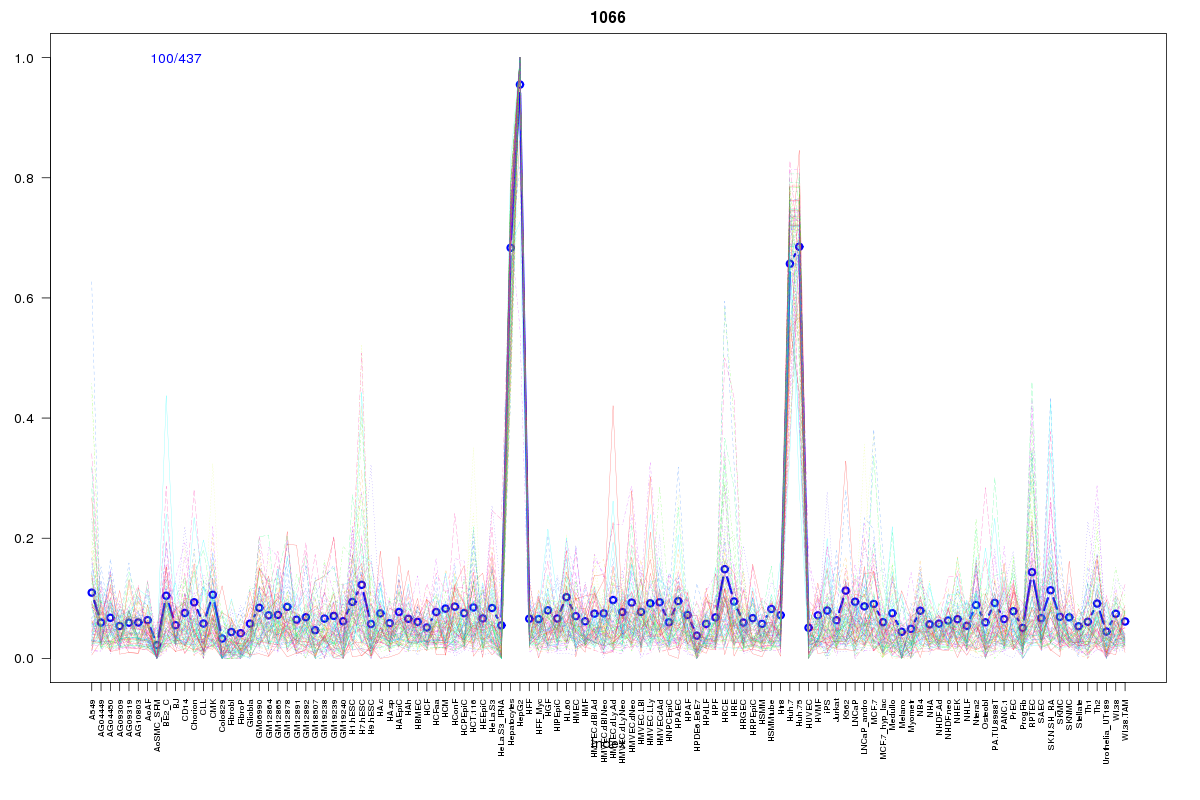 | 1066 | 1 |
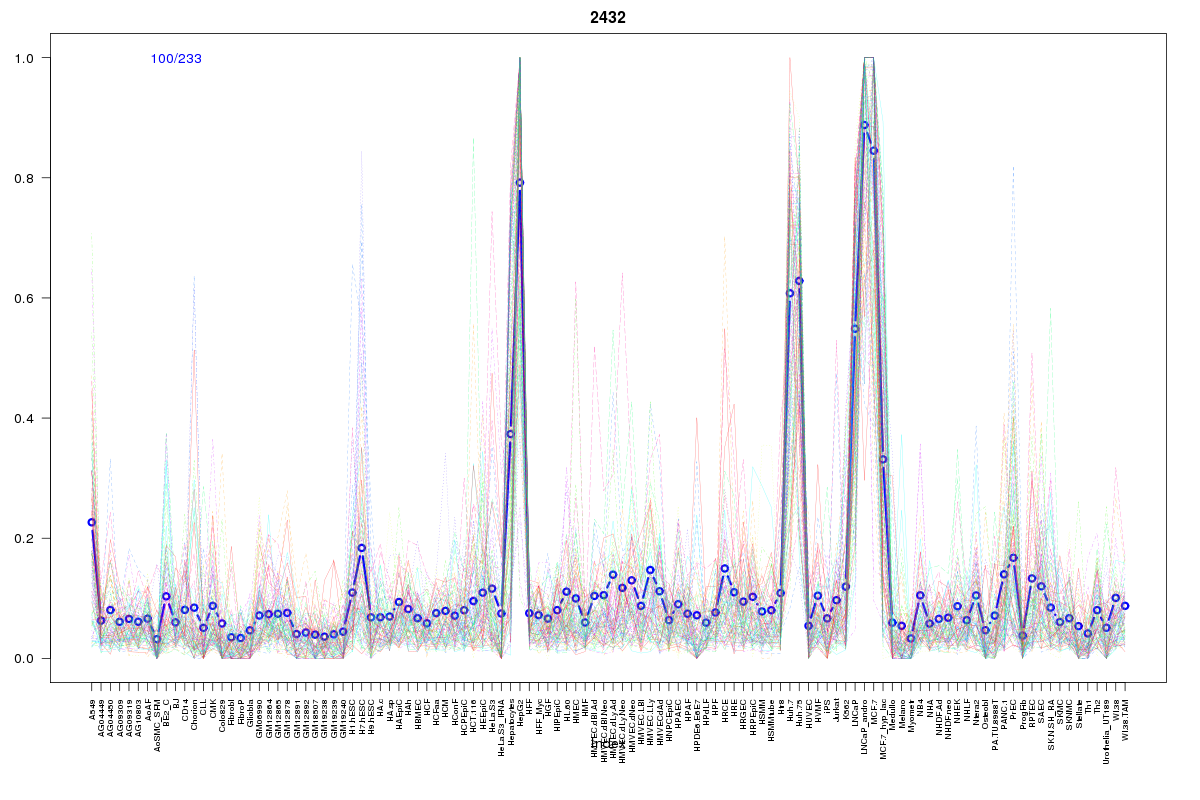 | 2432 | 1 |
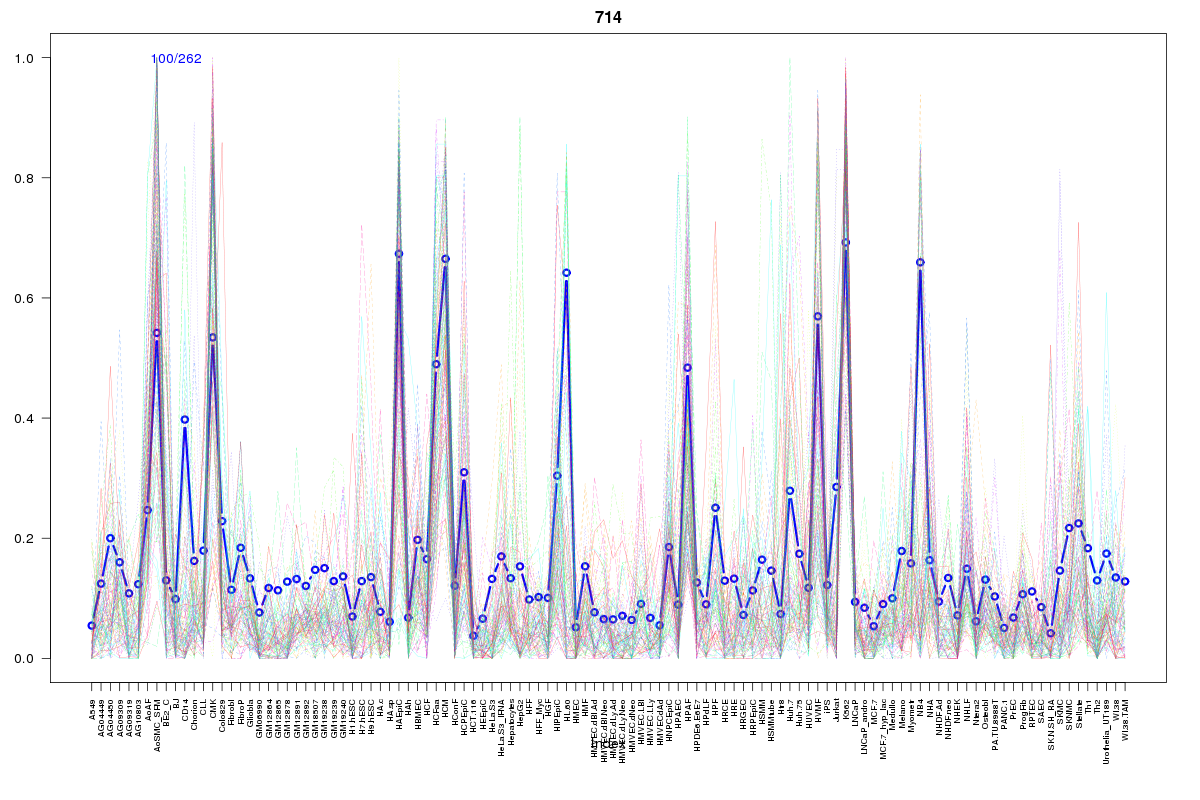 | 714 | 1 |
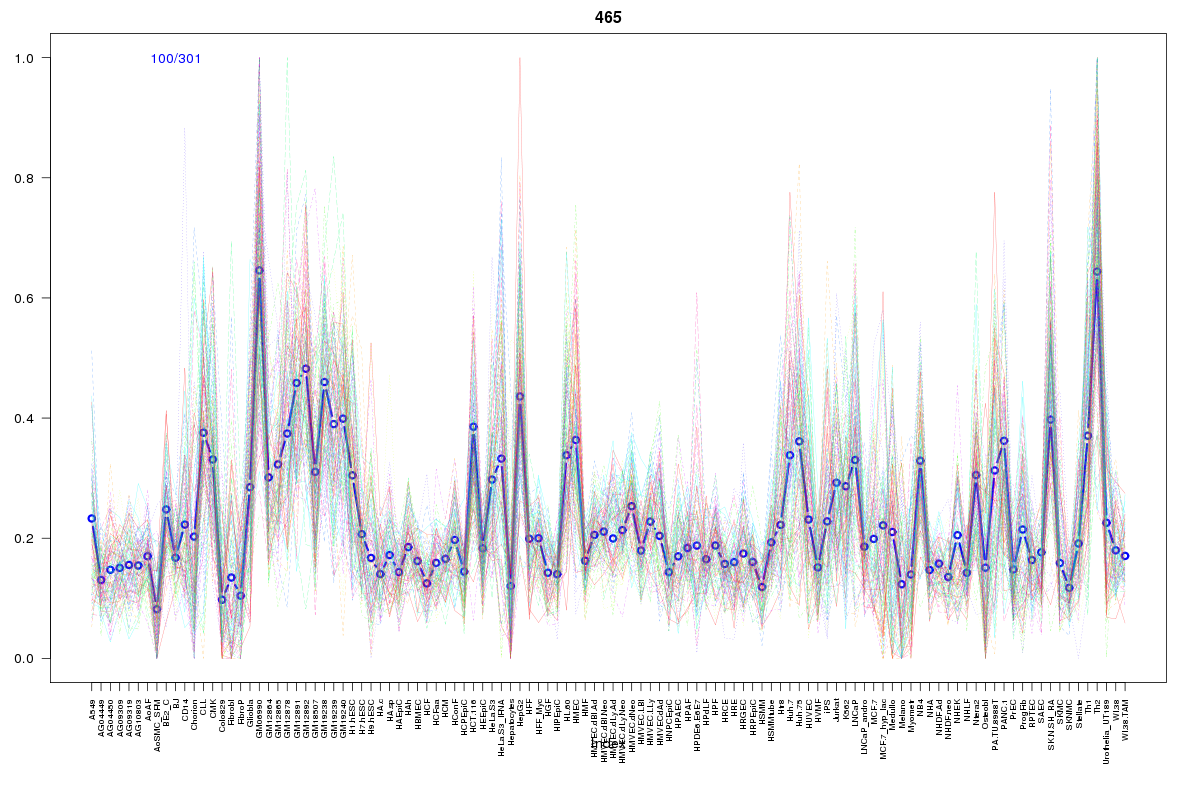 | 465 | 1 |
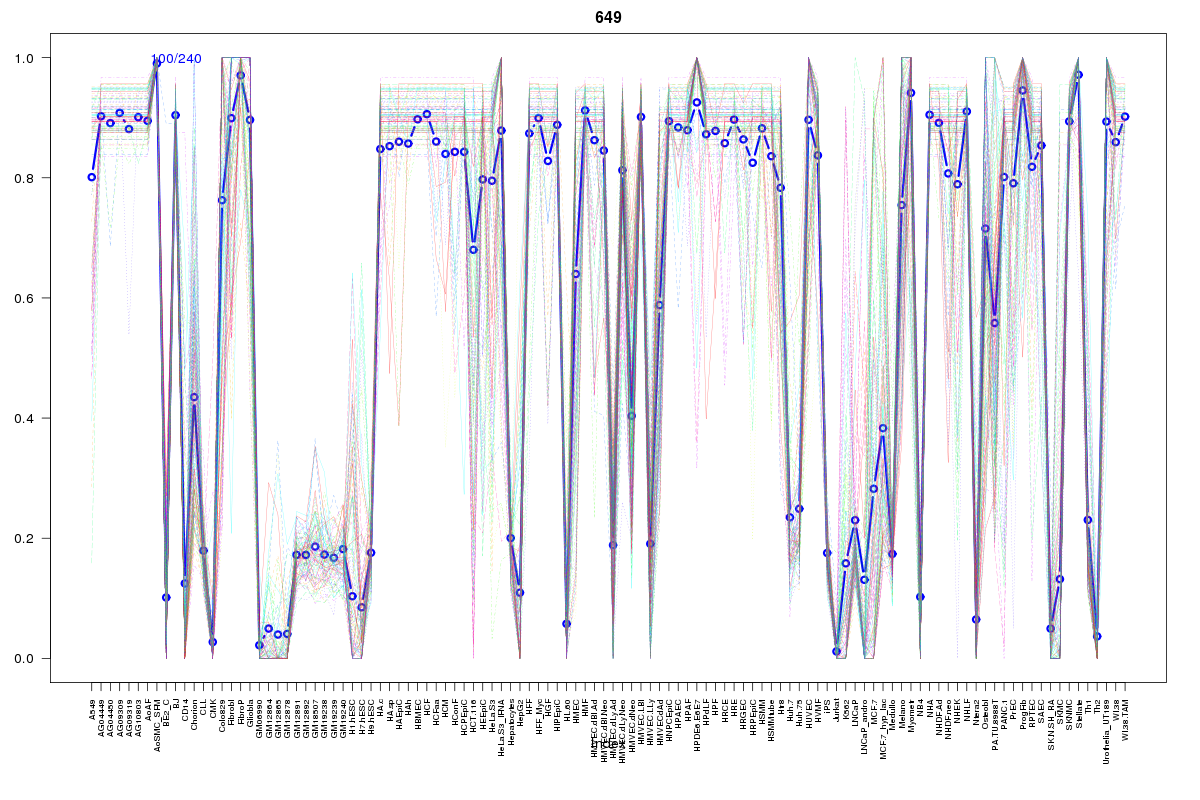 | 649 | 1 |
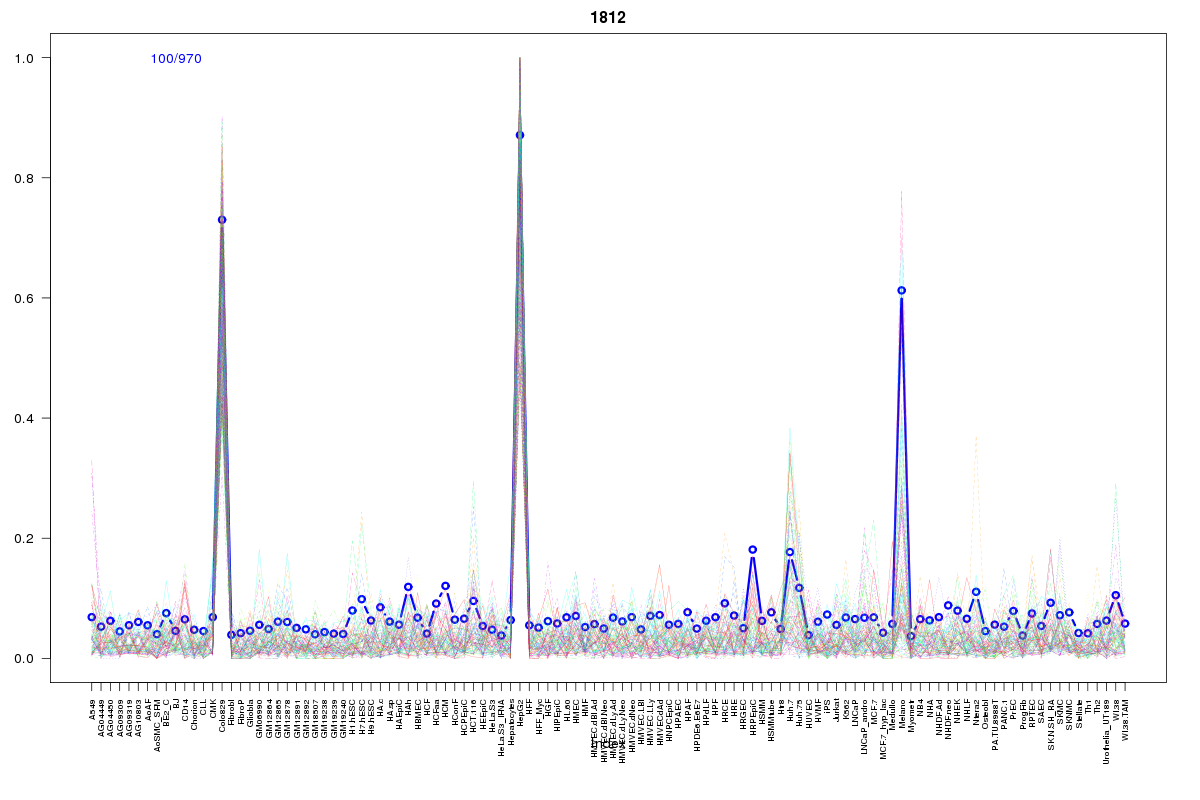 | 1812 | 1 |
 | 1974 | 1 |
 | 2175 | 1 |
 | 2178 | 1 |
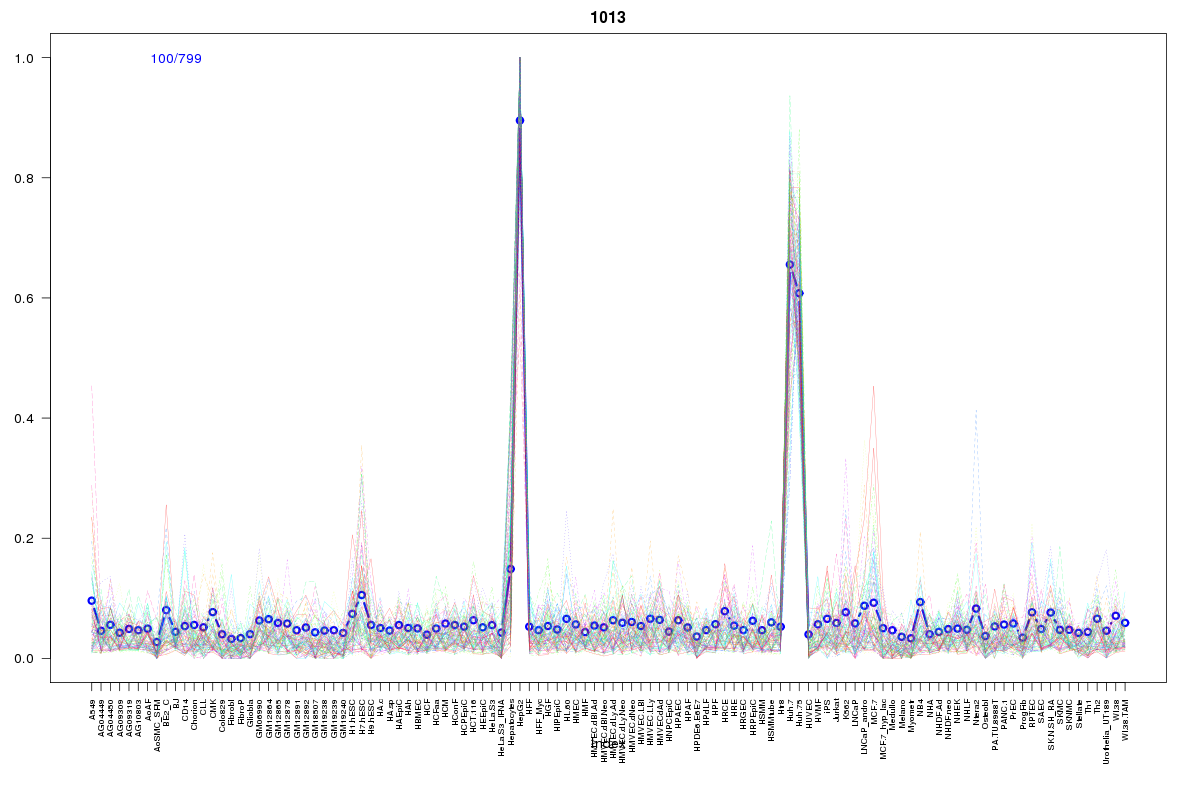 | 1013 | 1 |
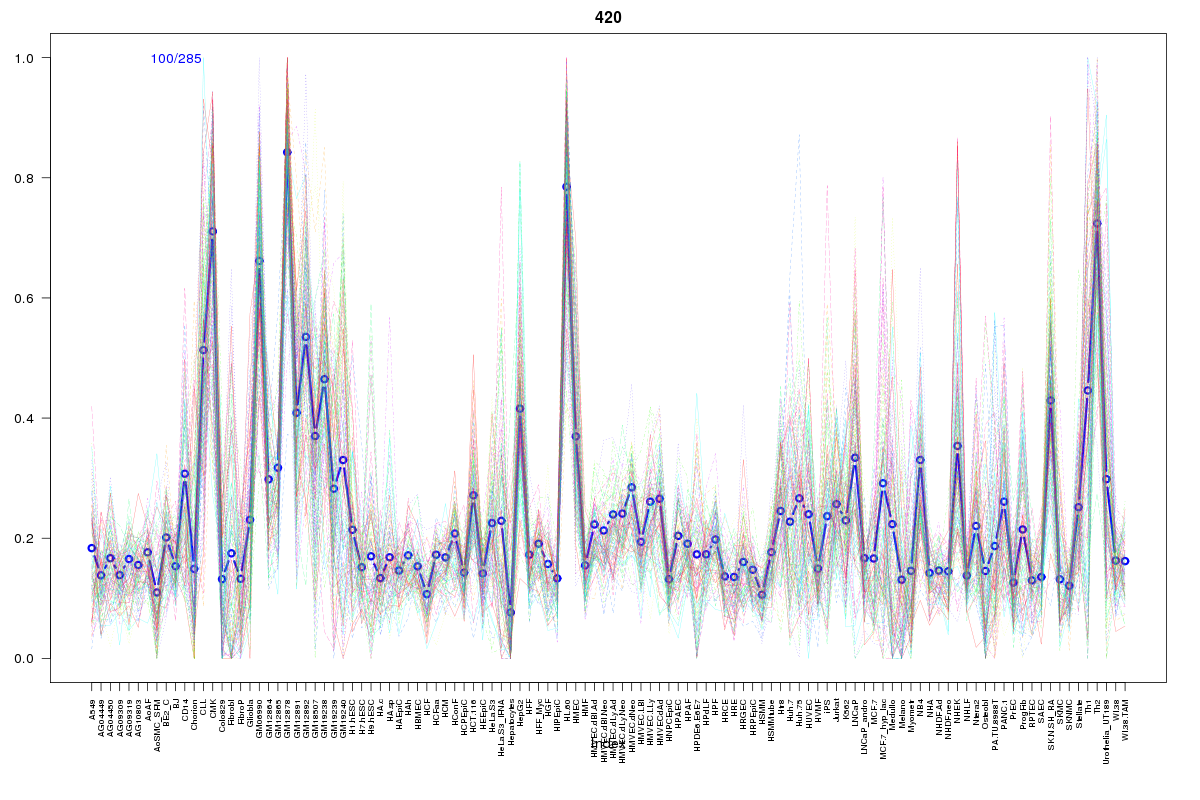 | 420 | 1 |
 | 15 | 1 |
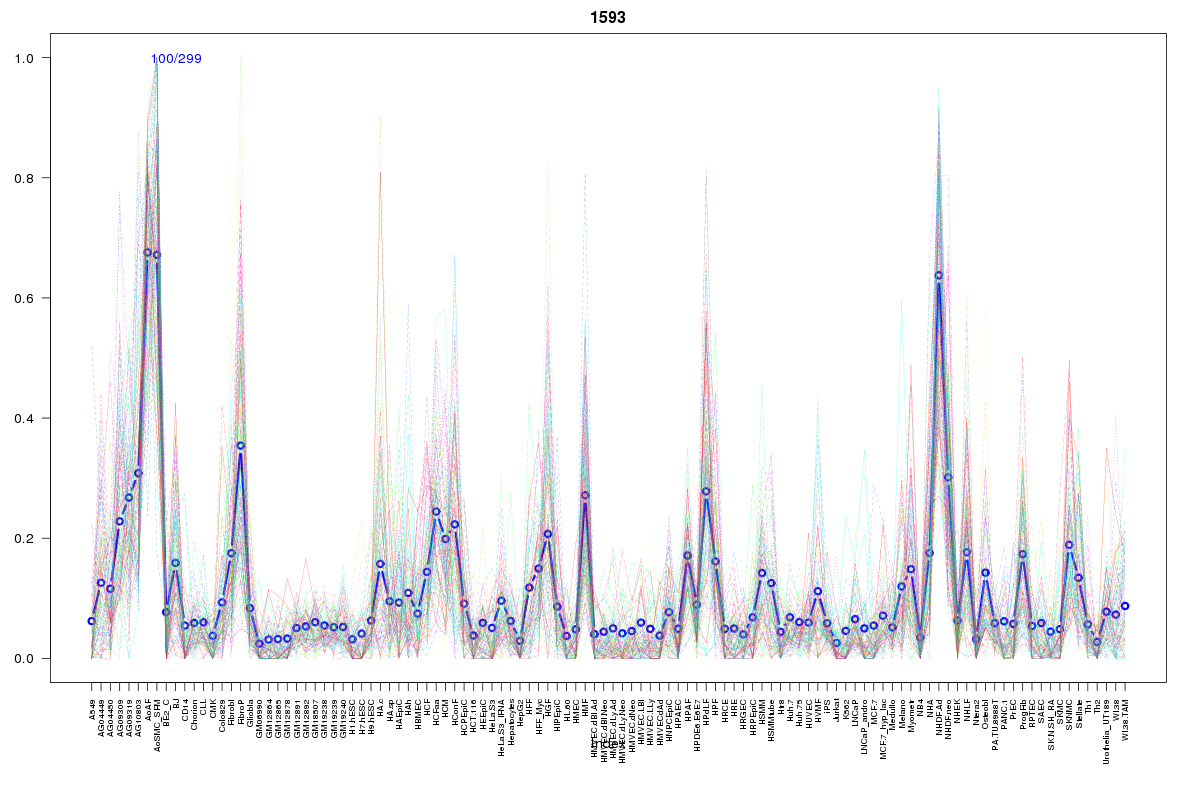 | 1593 | 1 |
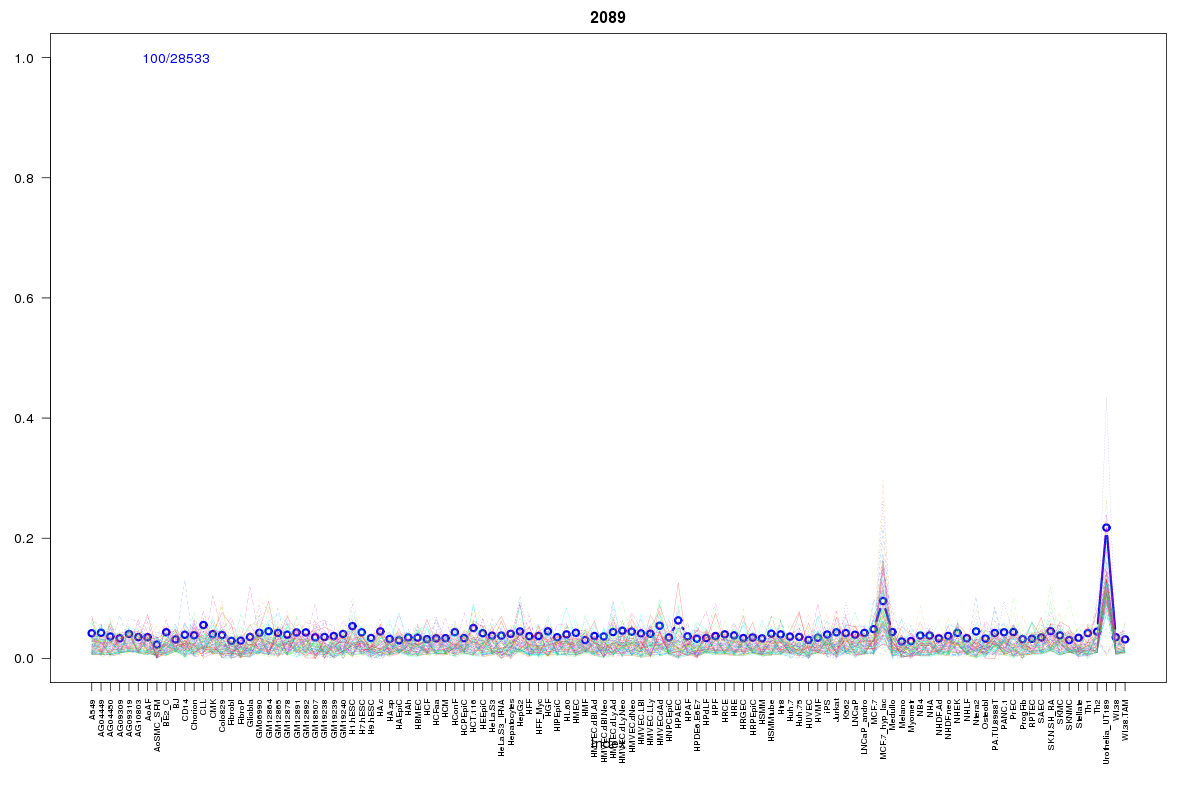 | 2089 | 1 |
Resources
BED file downloads
Connects to 33 DHS sitesTop 10 Correlated DHS Sites
p-values indiciate significant higher or lower correlation| Location | Cluster | P-value |
|---|---|---|
| chr20:42832860-42833010 | 649 | 0 |
| chr20:43033925-43034075 | 1758 | 0.001 |
| chr20:42837500-42837650 | 2178 | 0.001 |
| chr20:43033680-43033830 | 1758 | 0.005 |
| chr20:42931040-42931190 | 2432 | 0.005 |
| chr20:43039385-43039535 | 759 | 0.009 |
| chr20:42948600-42948750 | 1674 | 0.009 |
| chr20:42864540-42864690 | 2055 | 0.01 |
| chr20:42980760-42980910 | 1812 | 0.011 |
| chr20:43027545-43027695 | 1724 | 0.011 |
| chr20:42986780-42986930 | 15 | 0.011 |
External Databases
UCSCEnsembl (ENSG00000197296)