Gene: CACNA1S
chr1: 201008641-201081694Expression Profile
(log scale)
Graphical Connections
Distribution of linked clusters:
You may find it interesting if many of the connected DHS sites belong to the same cluster.| Cluster Profile | Cluster ID | Number of DHS sites in this cluster |
|---|---|---|
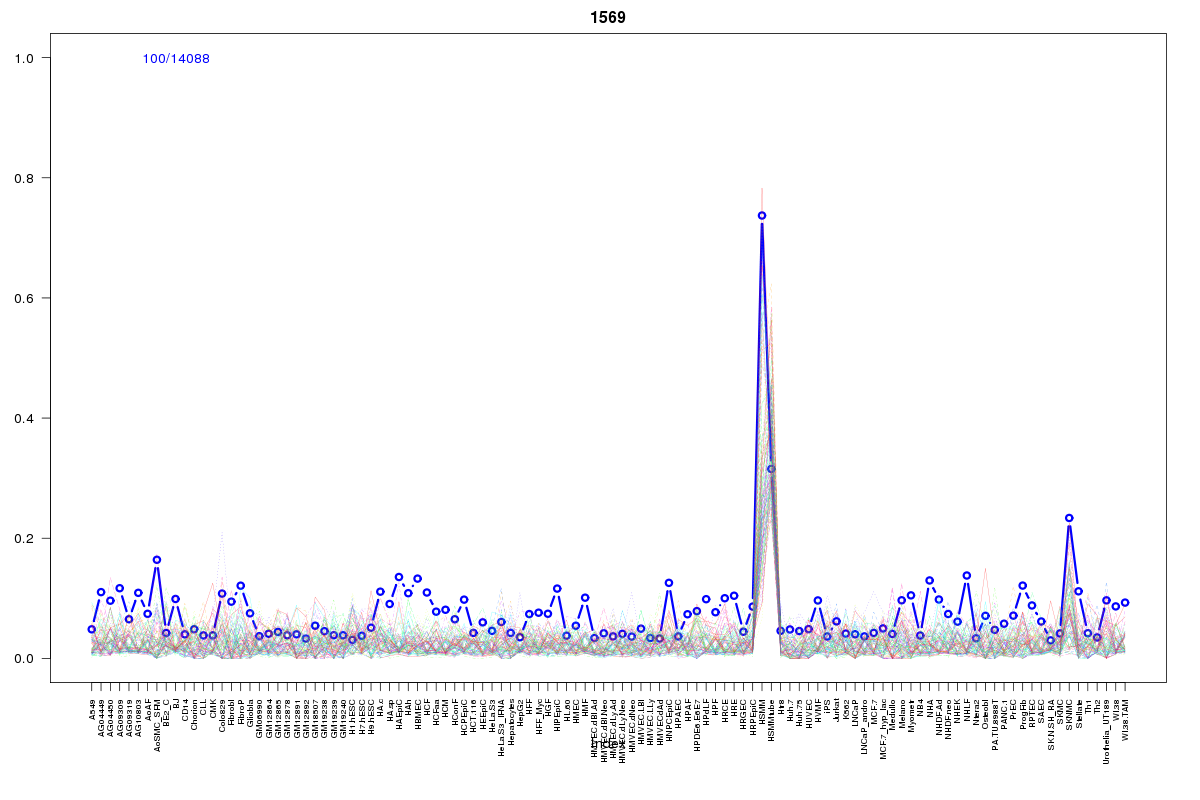 | 1569 | 8 |
 | 1721 | 6 |
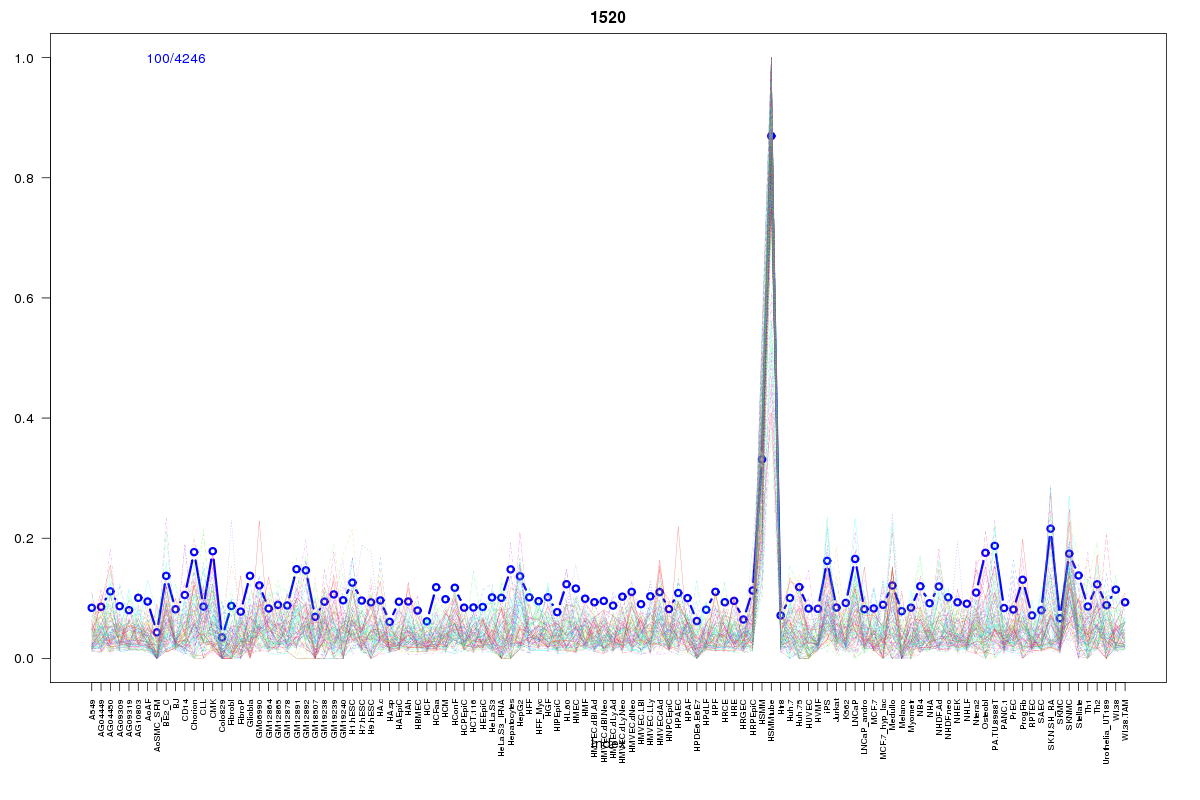 | 1520 | 3 |
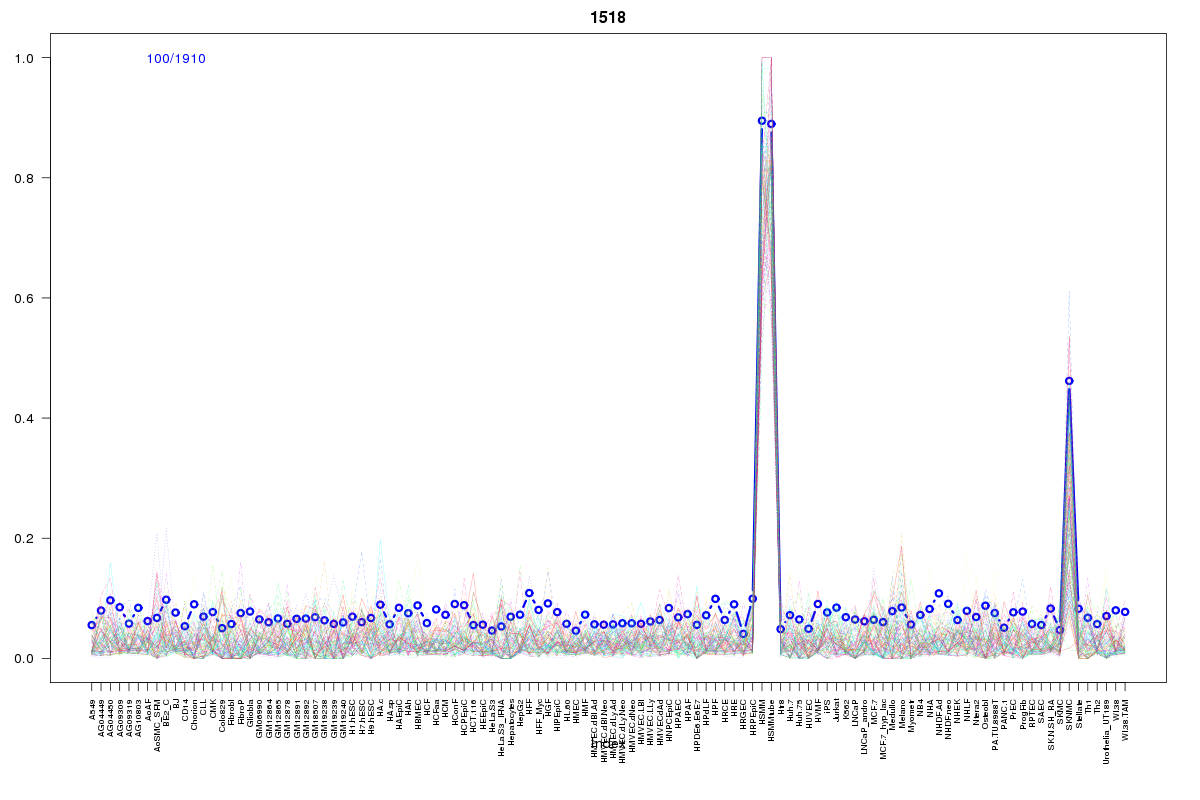 | 1518 | 3 |
 | 10 | 2 |
 | 570 | 2 |
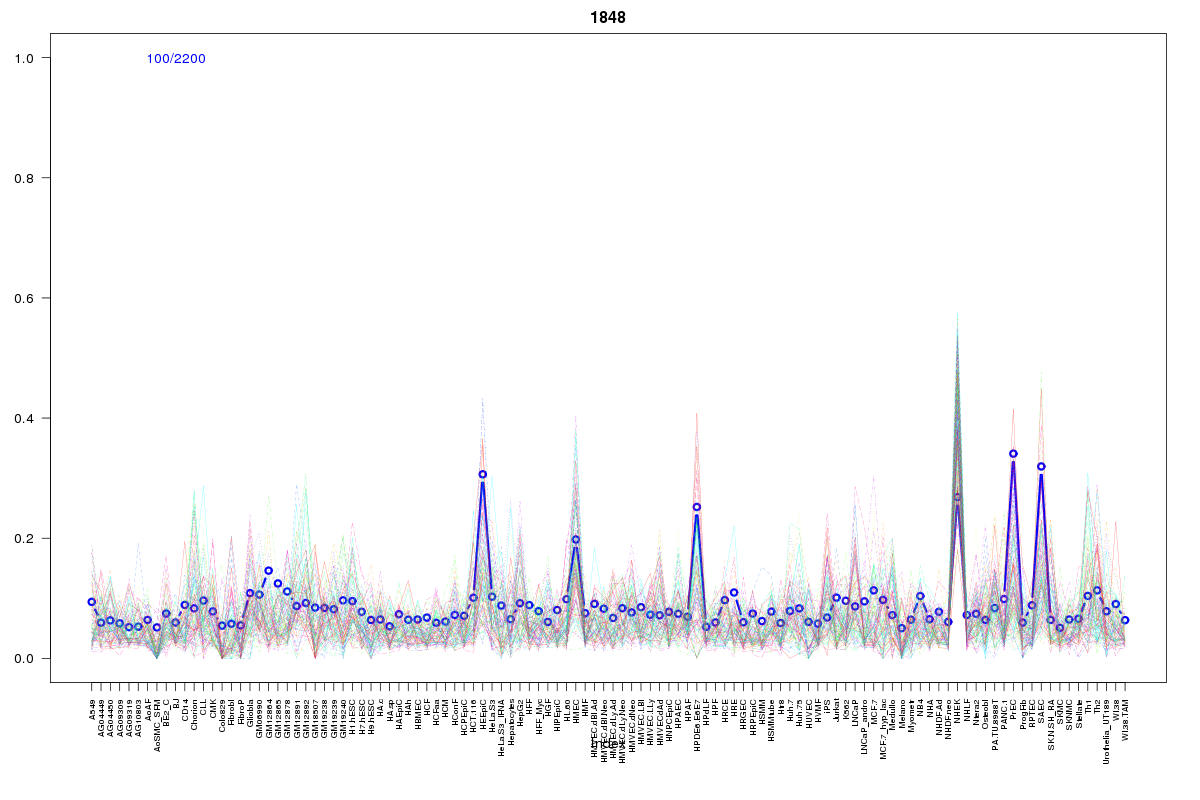 | 1848 | 2 |
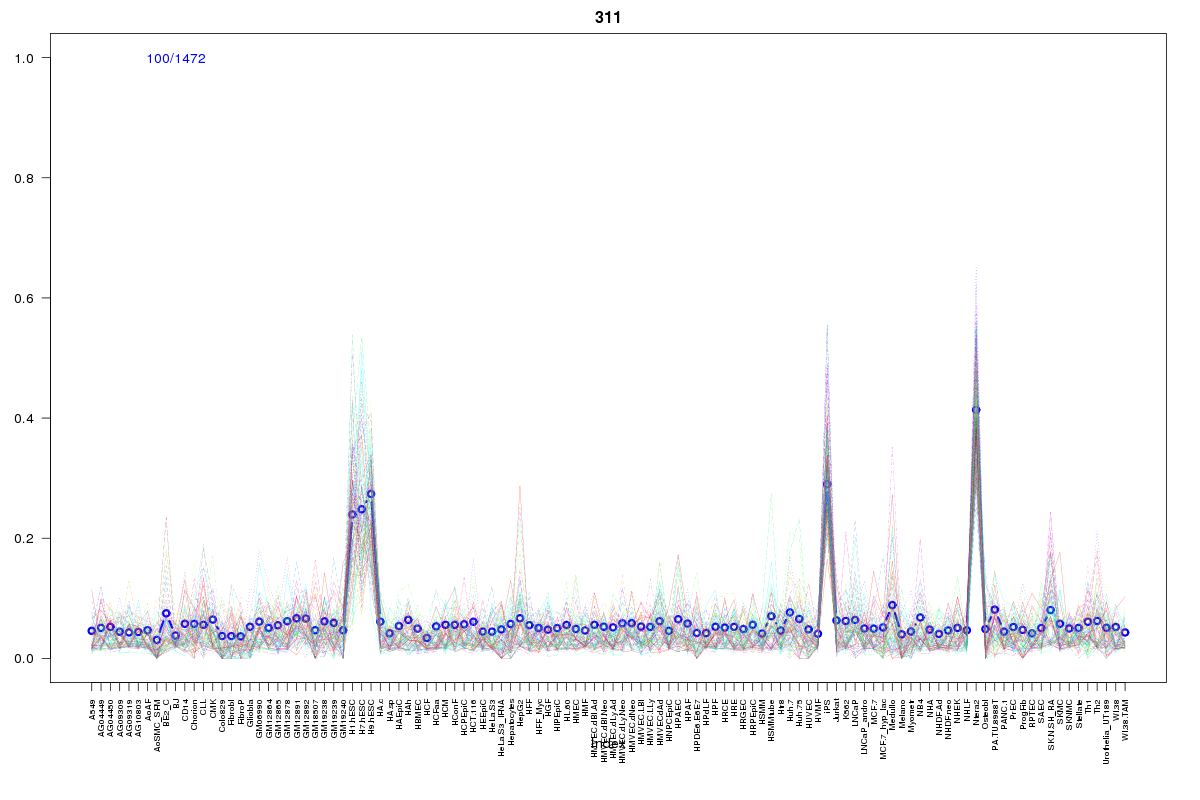 | 311 | 1 |
 | 860 | 1 |
 | 15 | 1 |
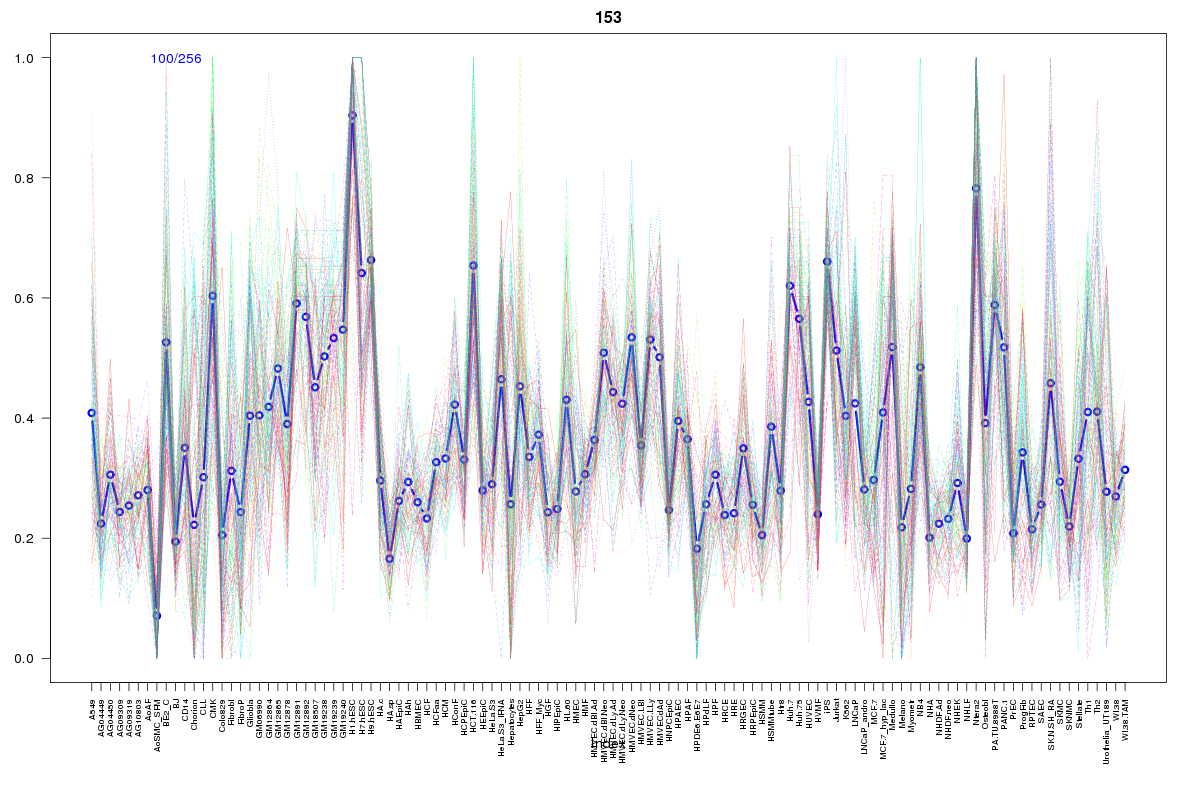 | 153 | 1 |
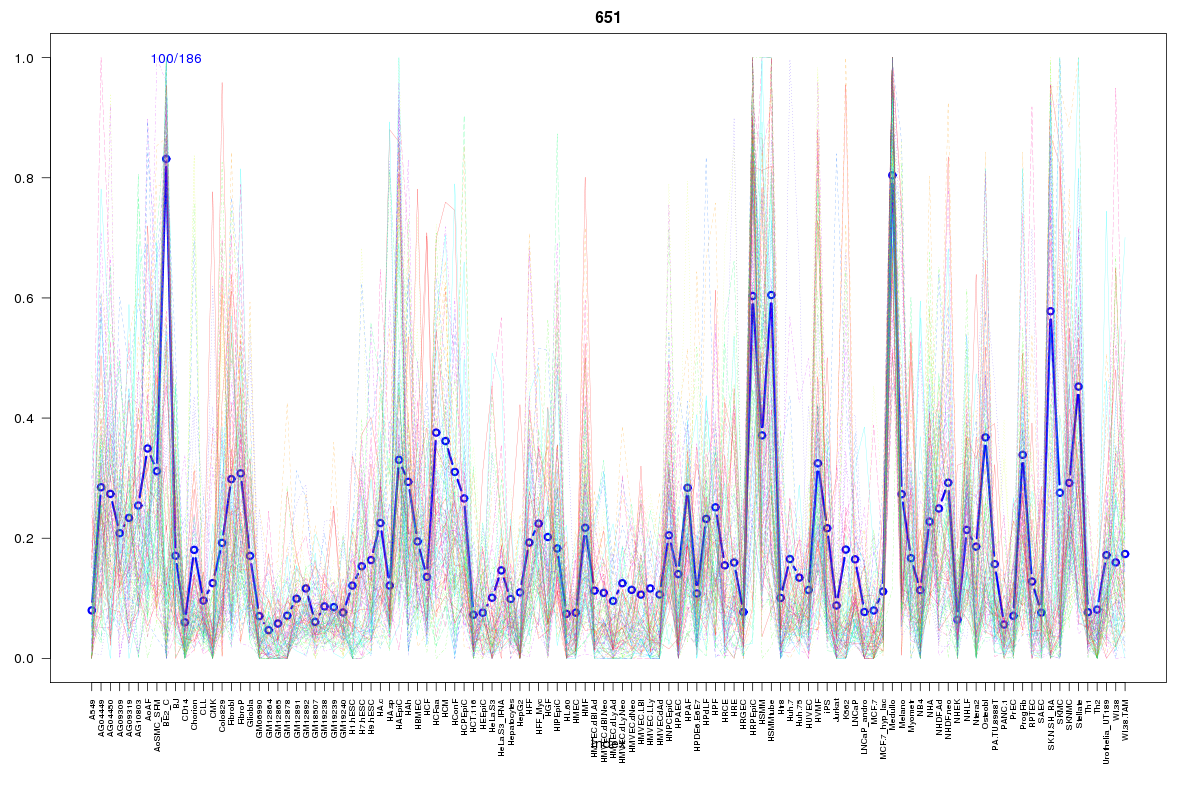 | 651 | 1 |
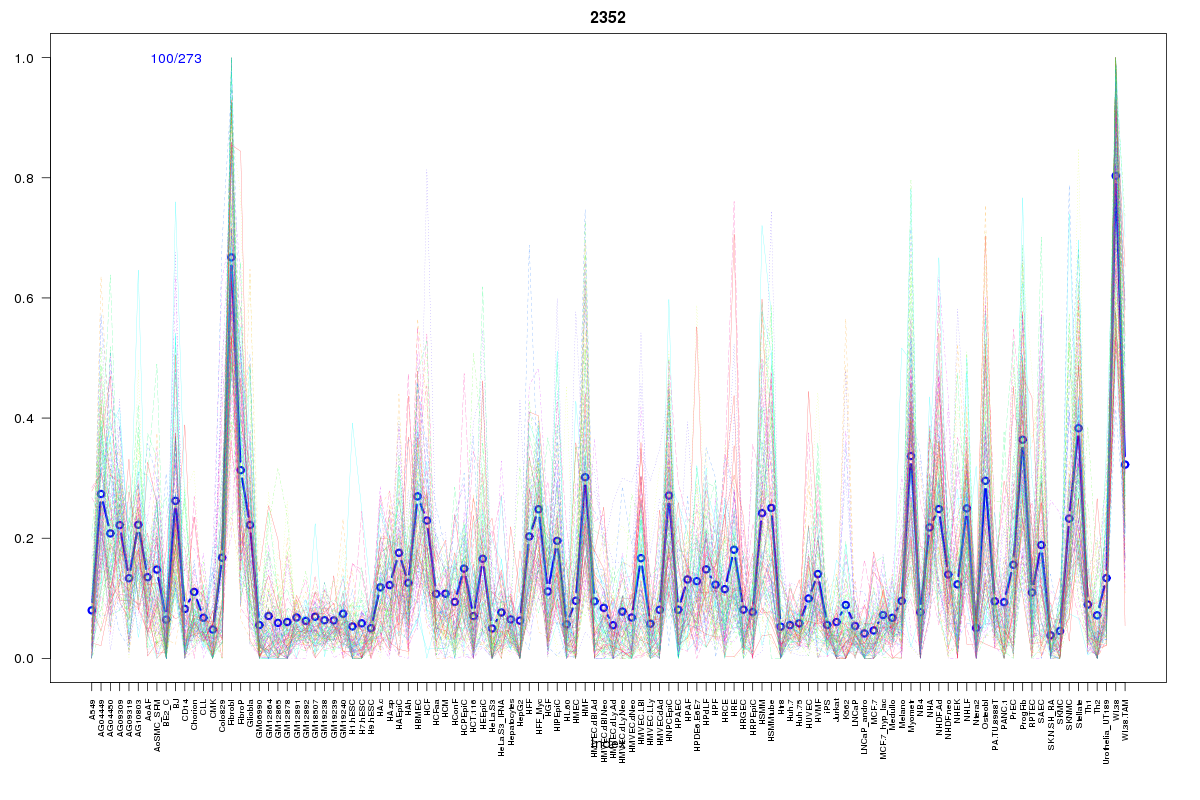 | 2352 | 1 |
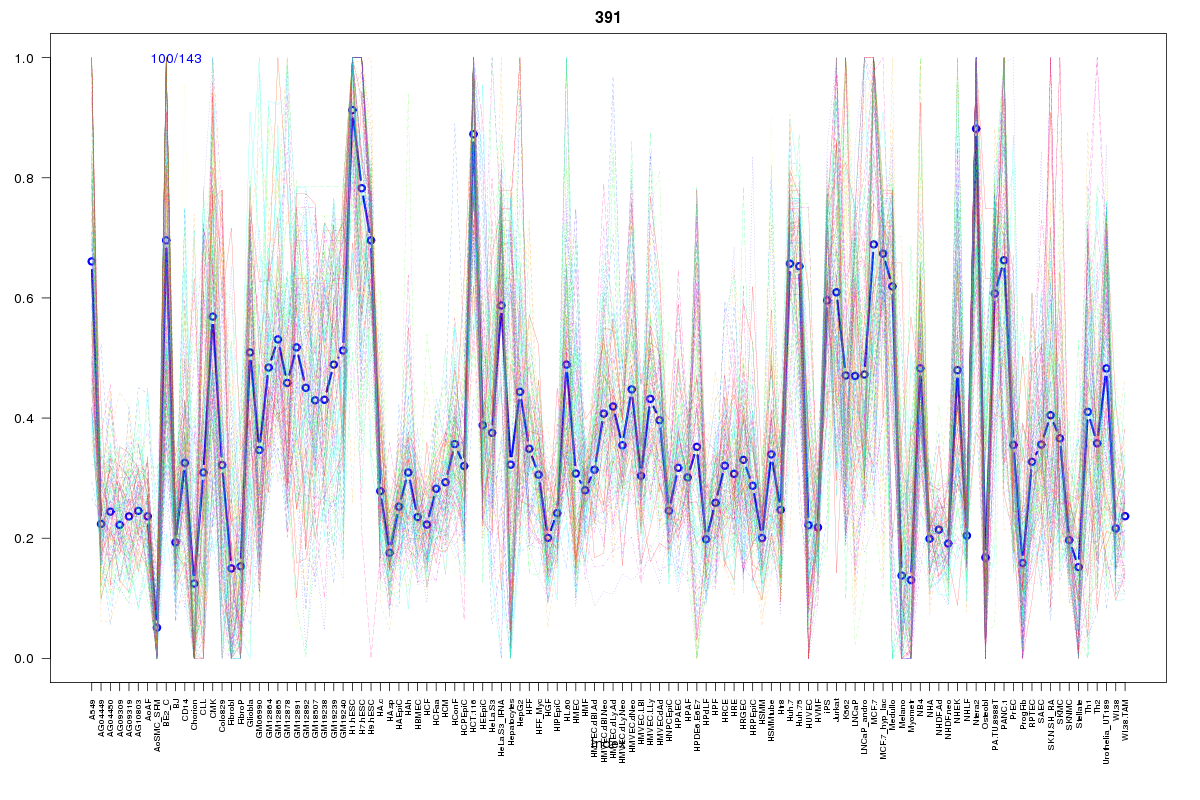 | 391 | 1 |
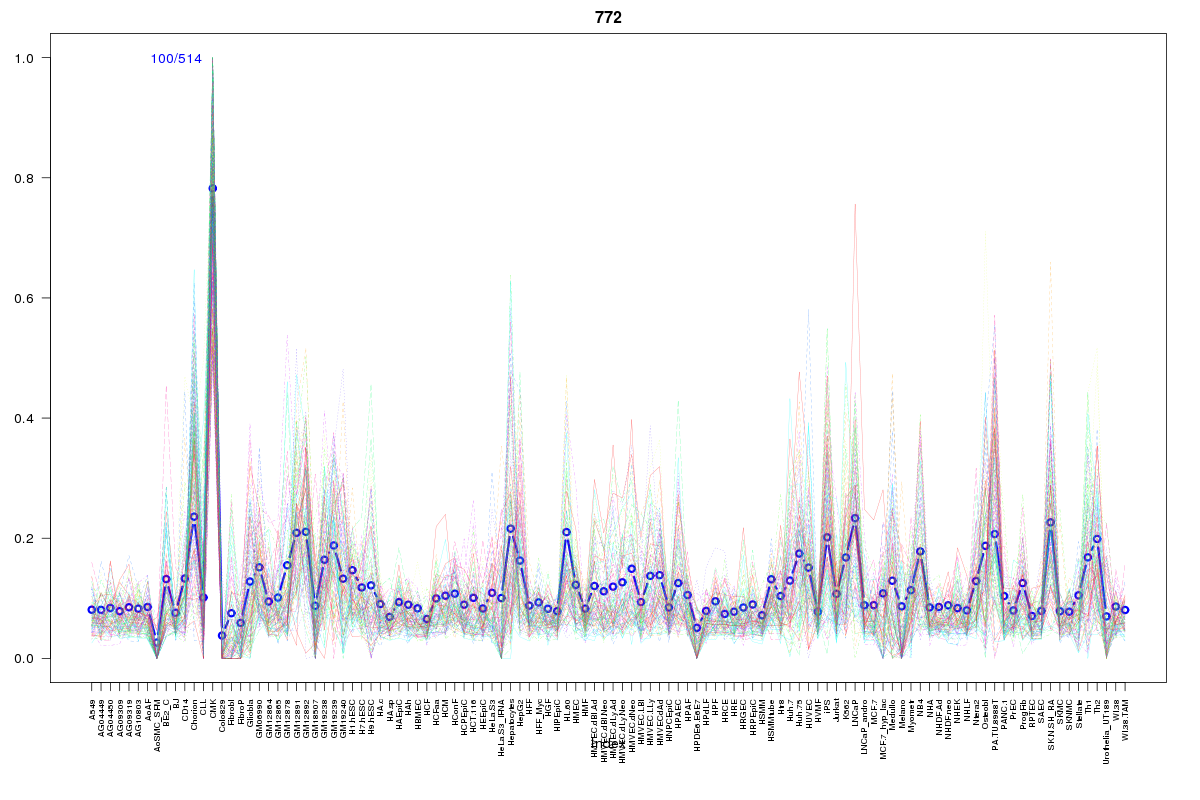 | 772 | 1 |
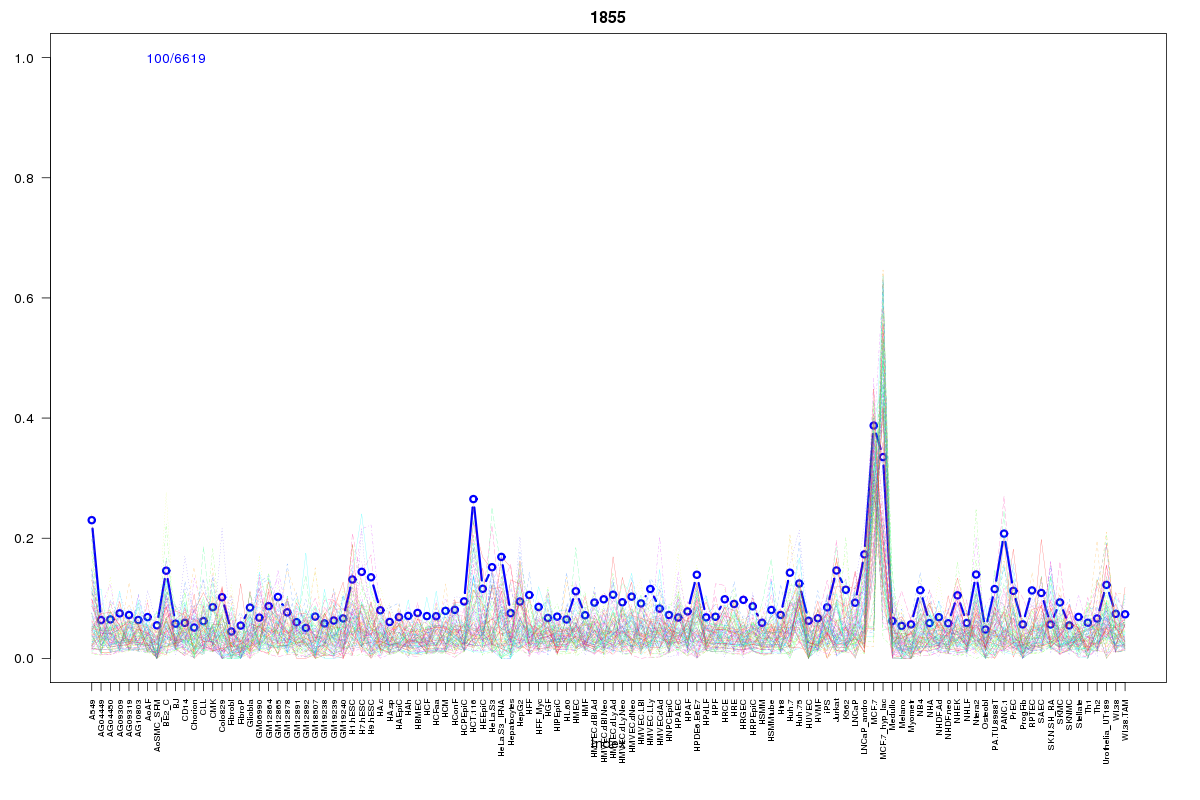 | 1855 | 1 |
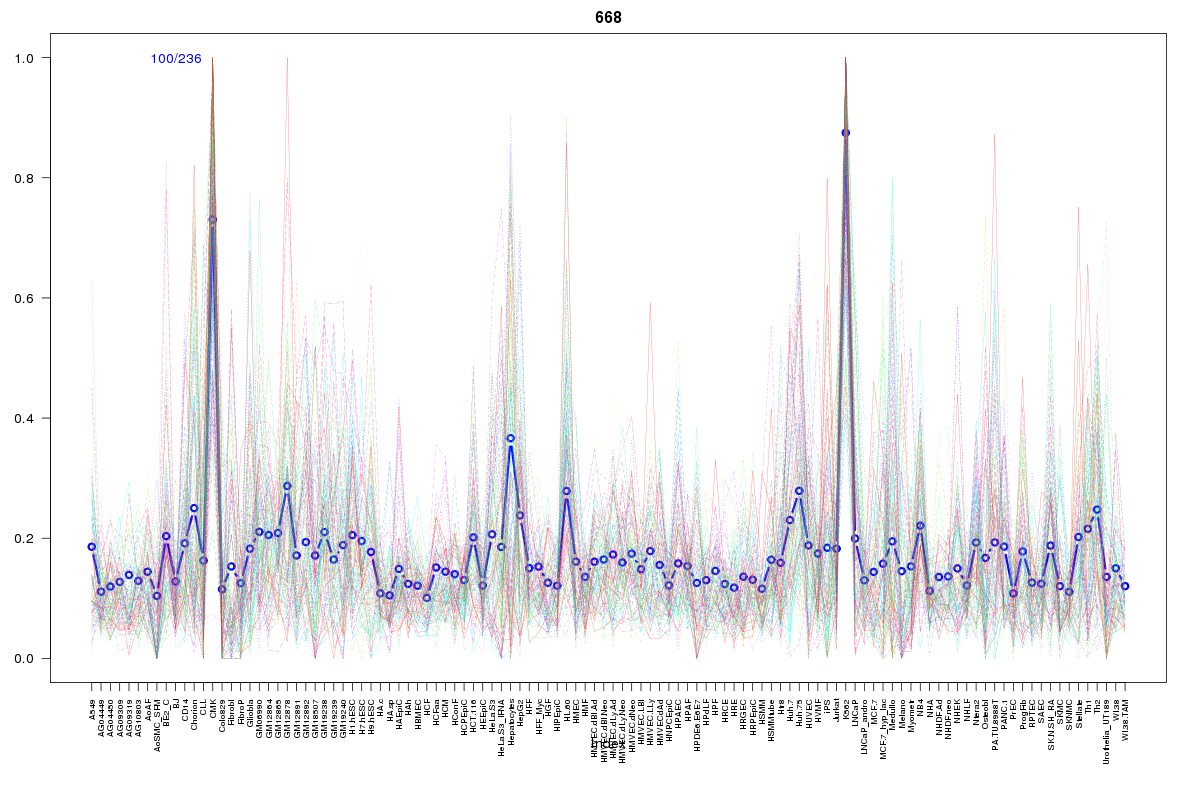 | 668 | 1 |
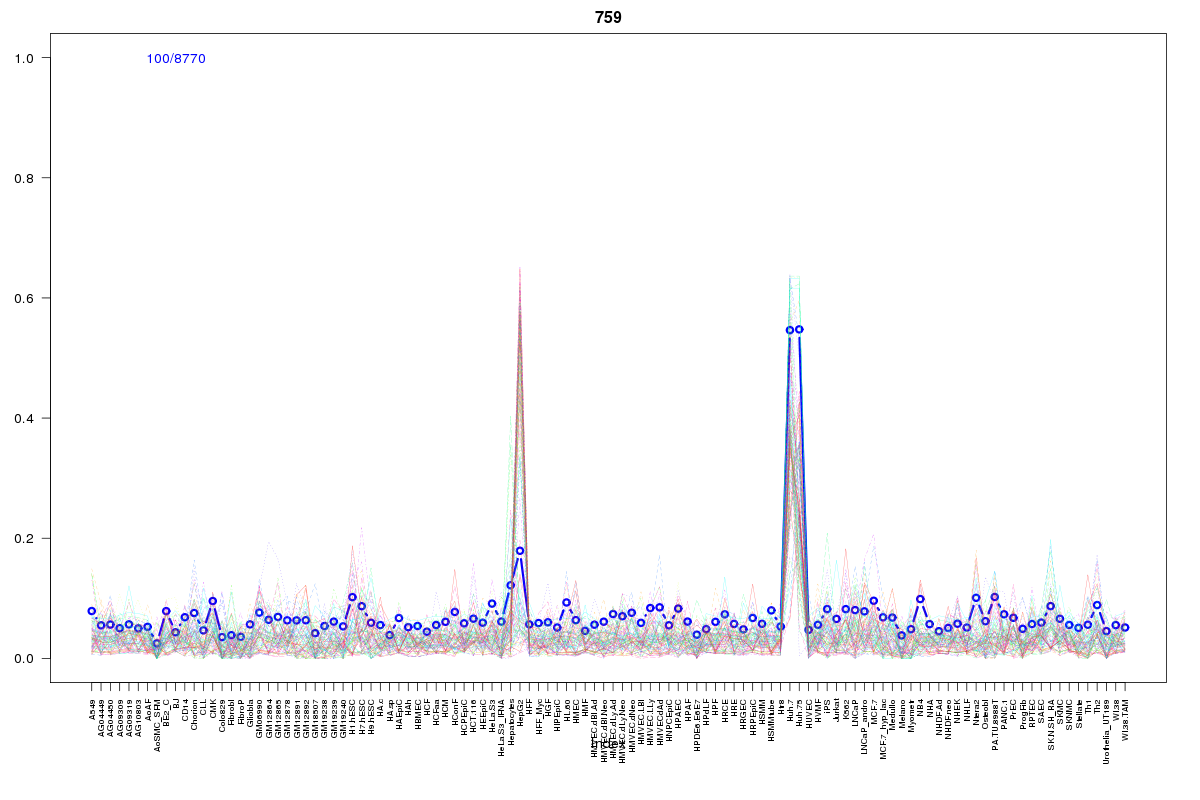 | 759 | 1 |
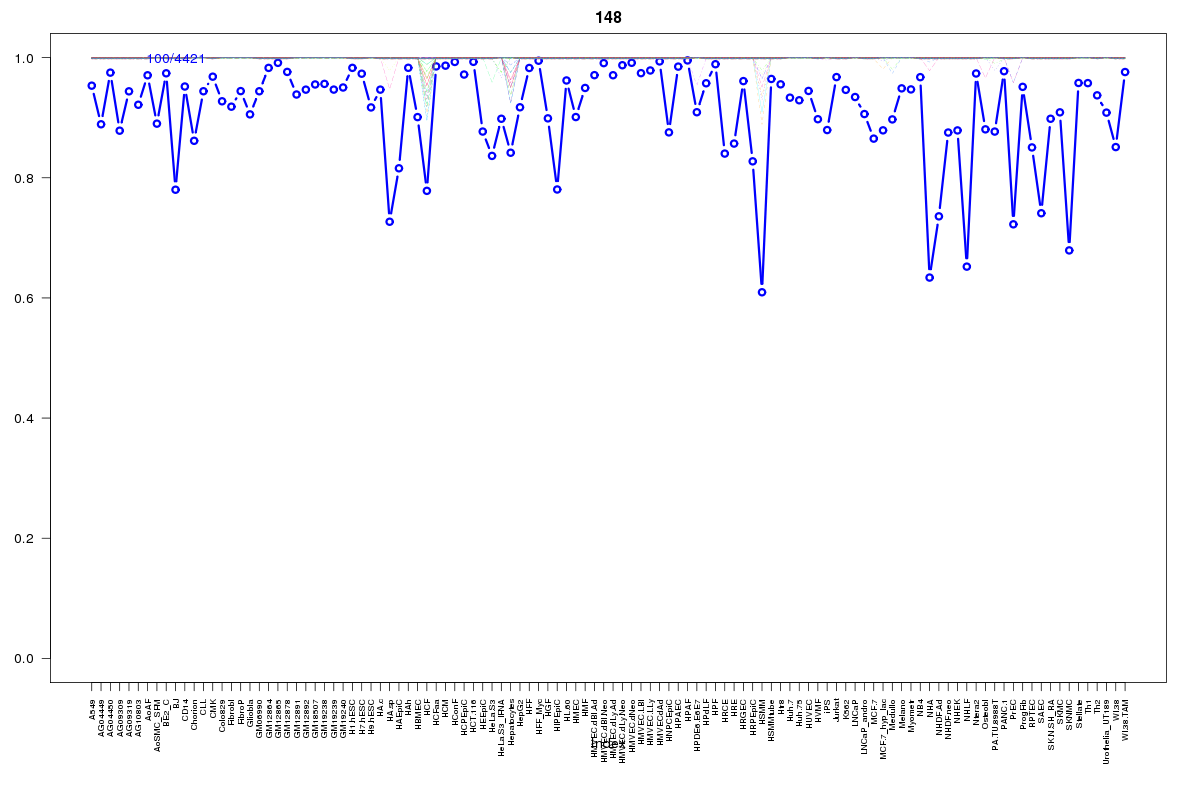 | 148 | 1 |
 | 655 | 1 |
 | 568 | 1 |
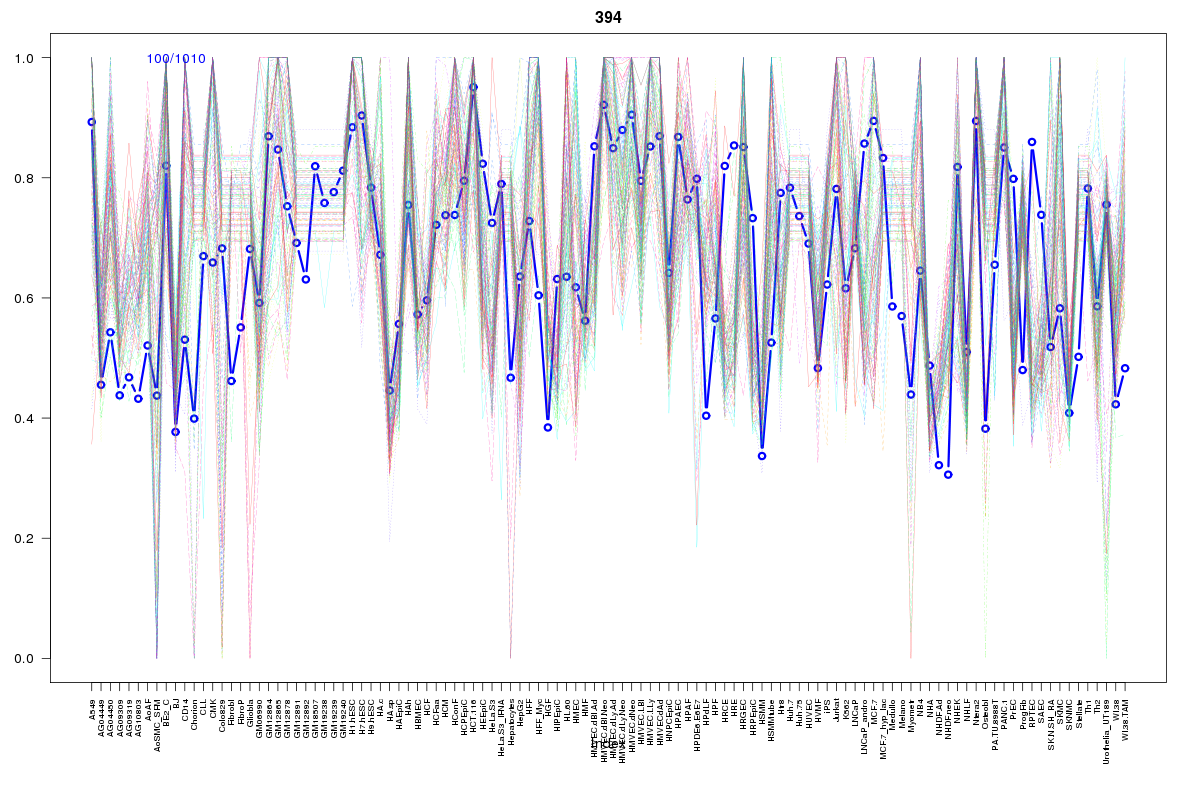 | 394 | 1 |
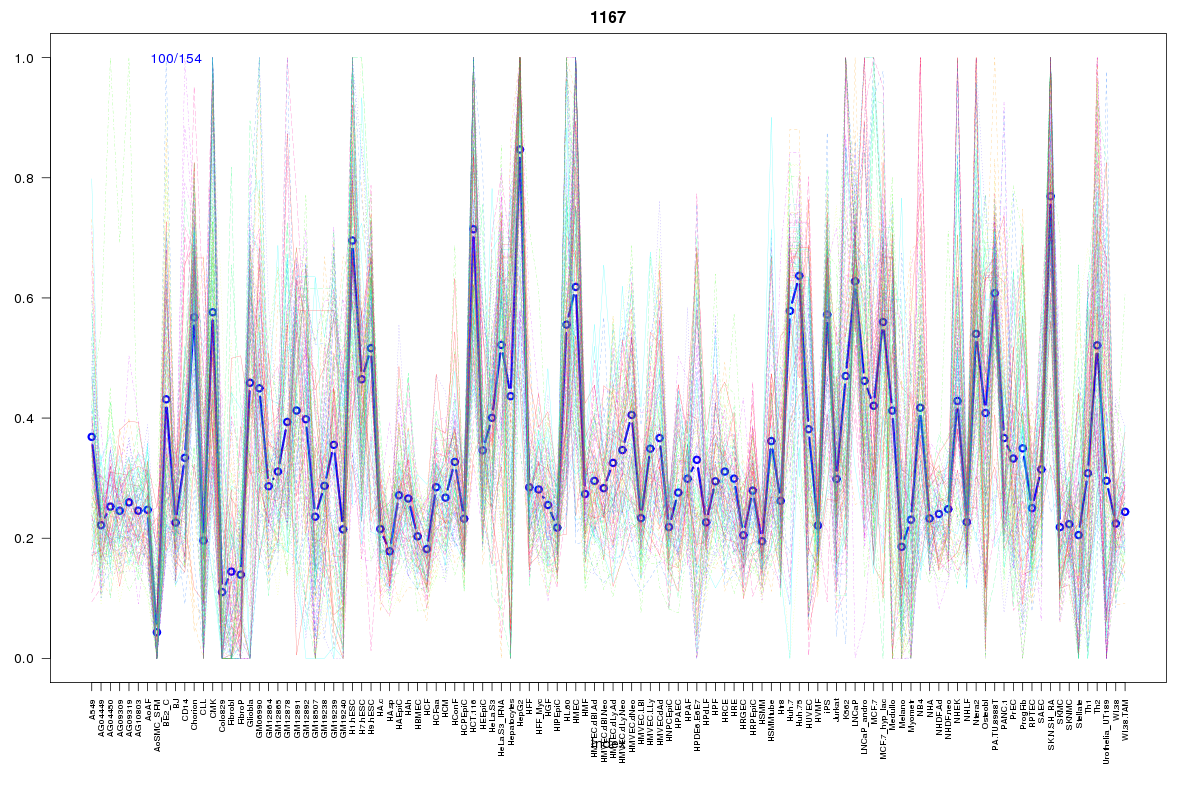 | 1167 | 1 |
 | 1008 | 1 |
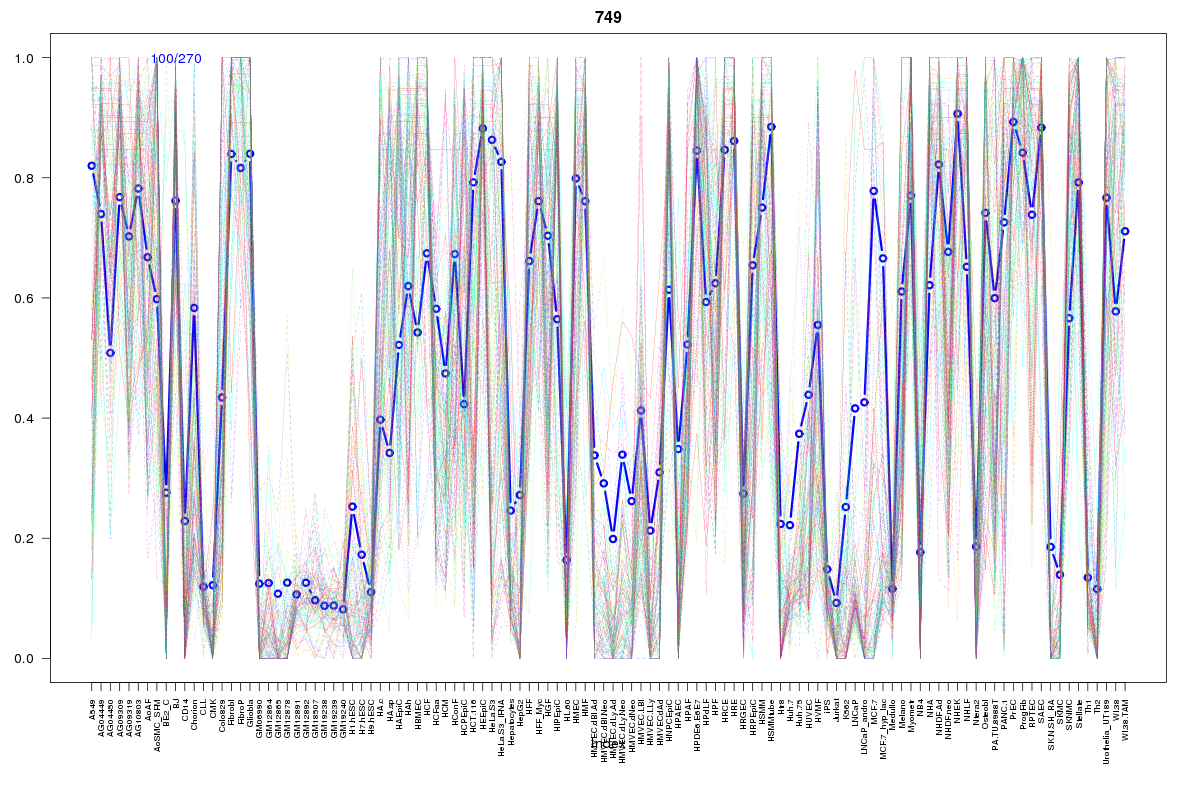 | 749 | 1 |
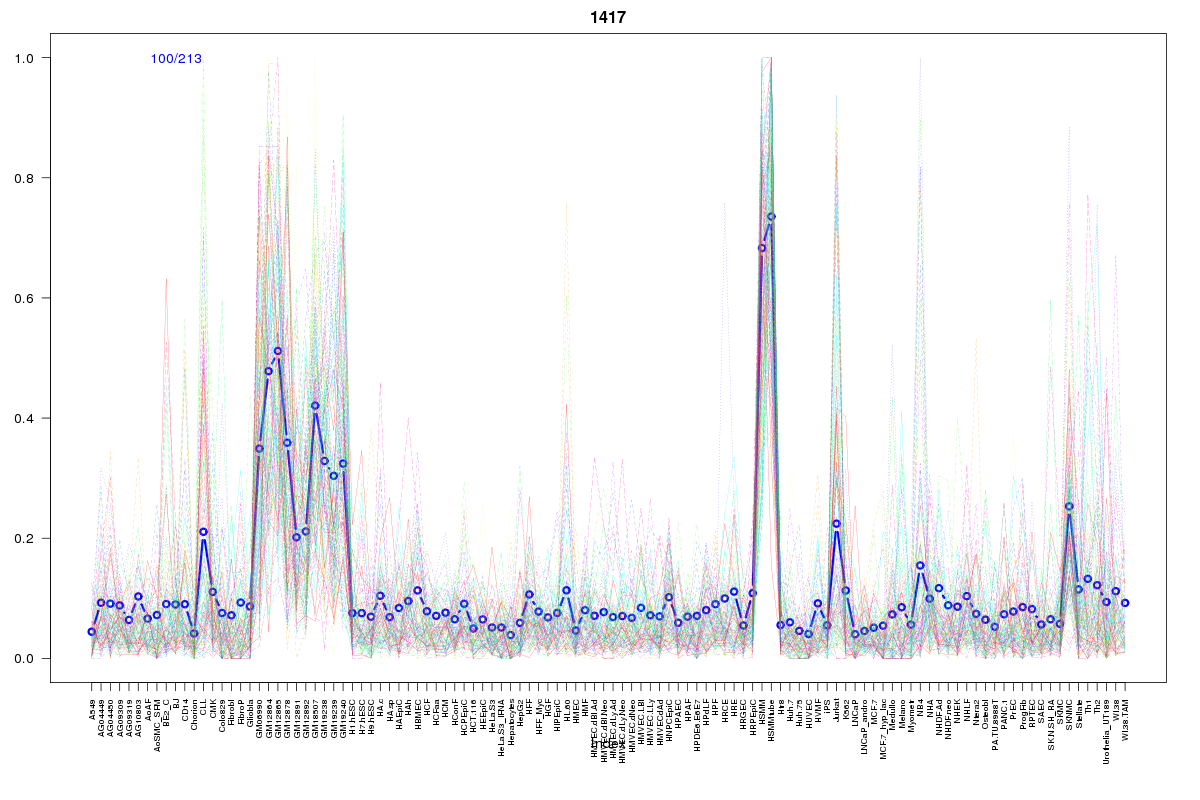 | 1417 | 1 |
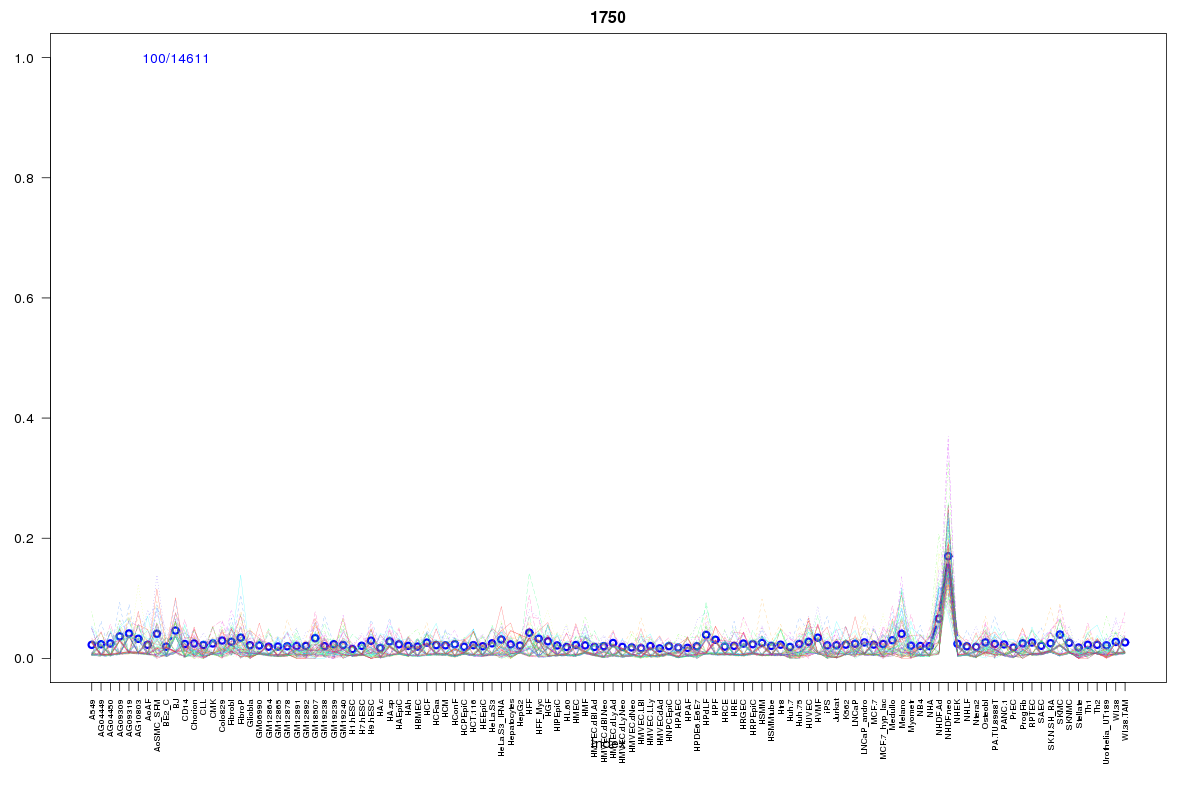 | 1750 | 1 |
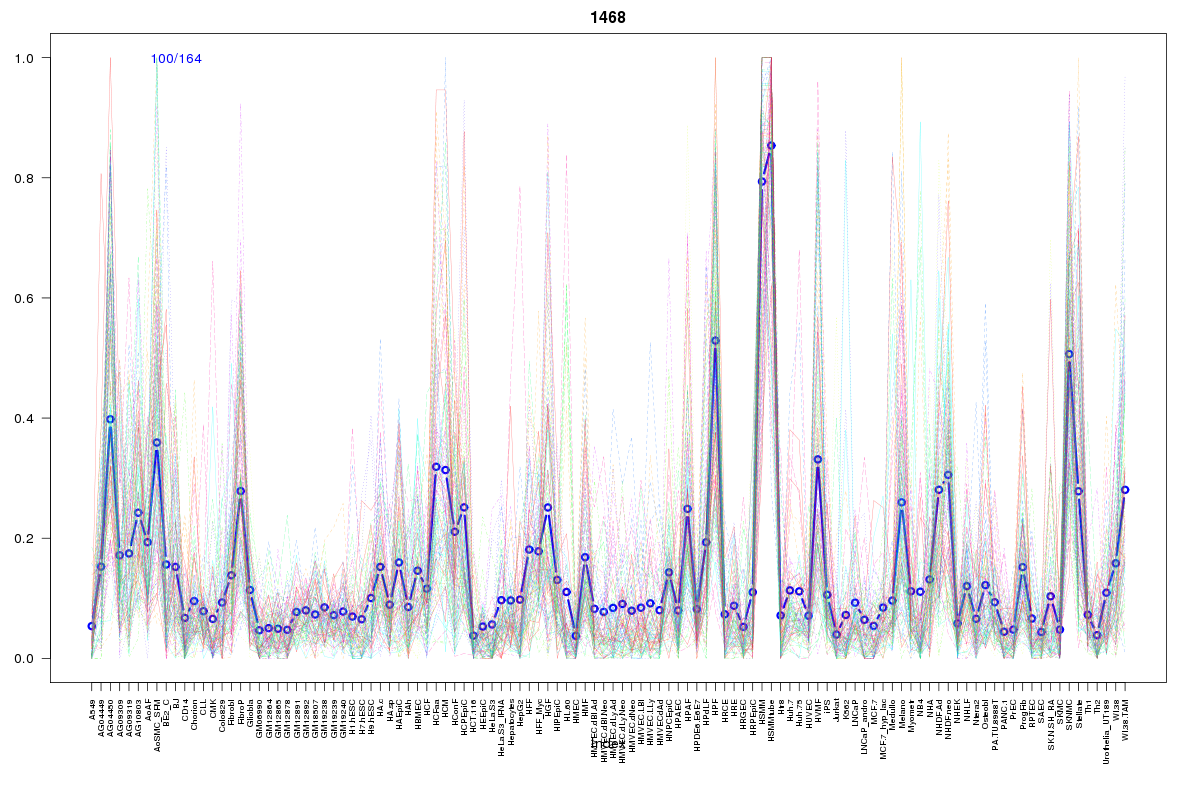 | 1468 | 1 |
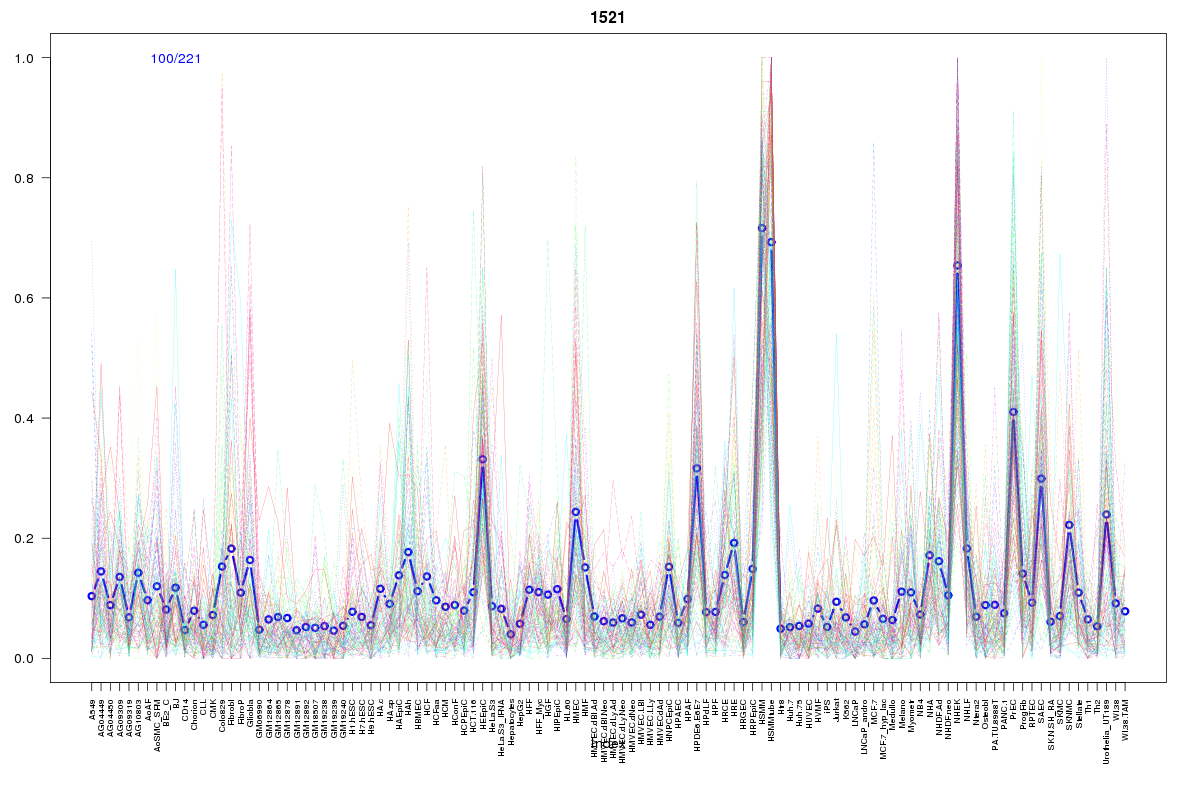 | 1521 | 1 |
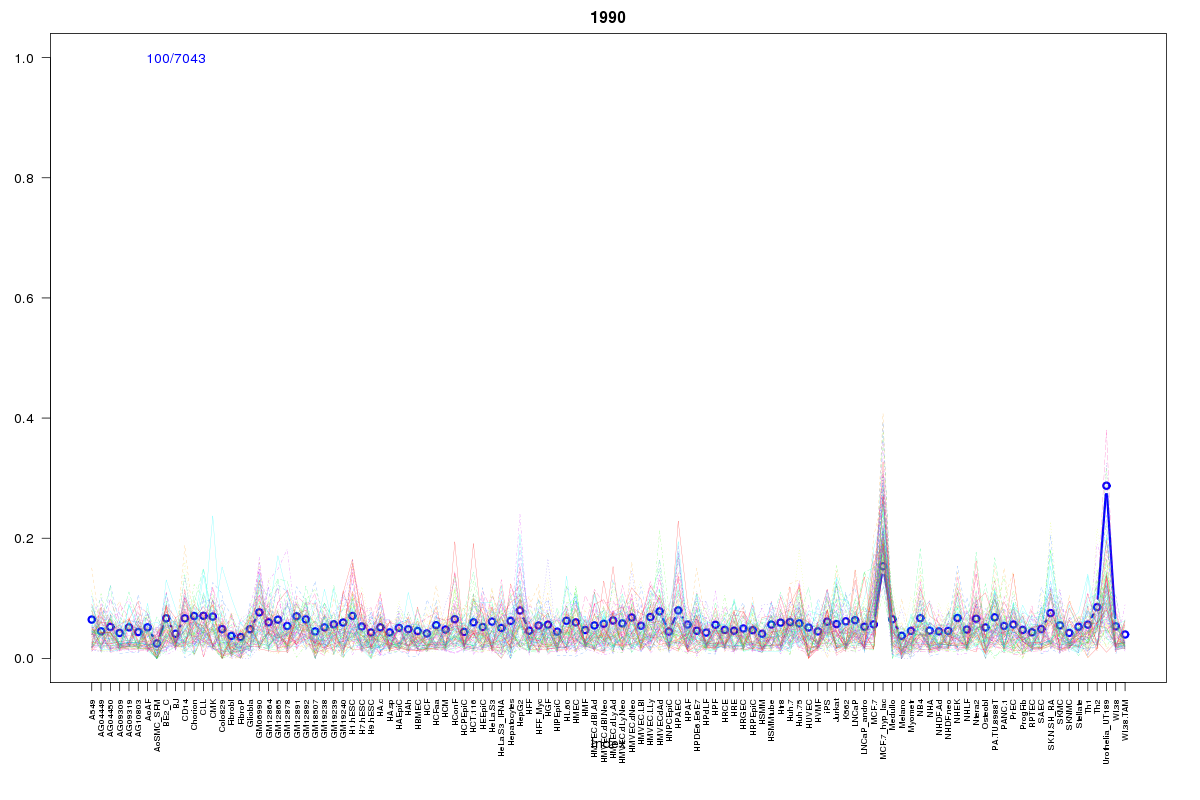 | 1990 | 1 |
 | 2055 | 1 |
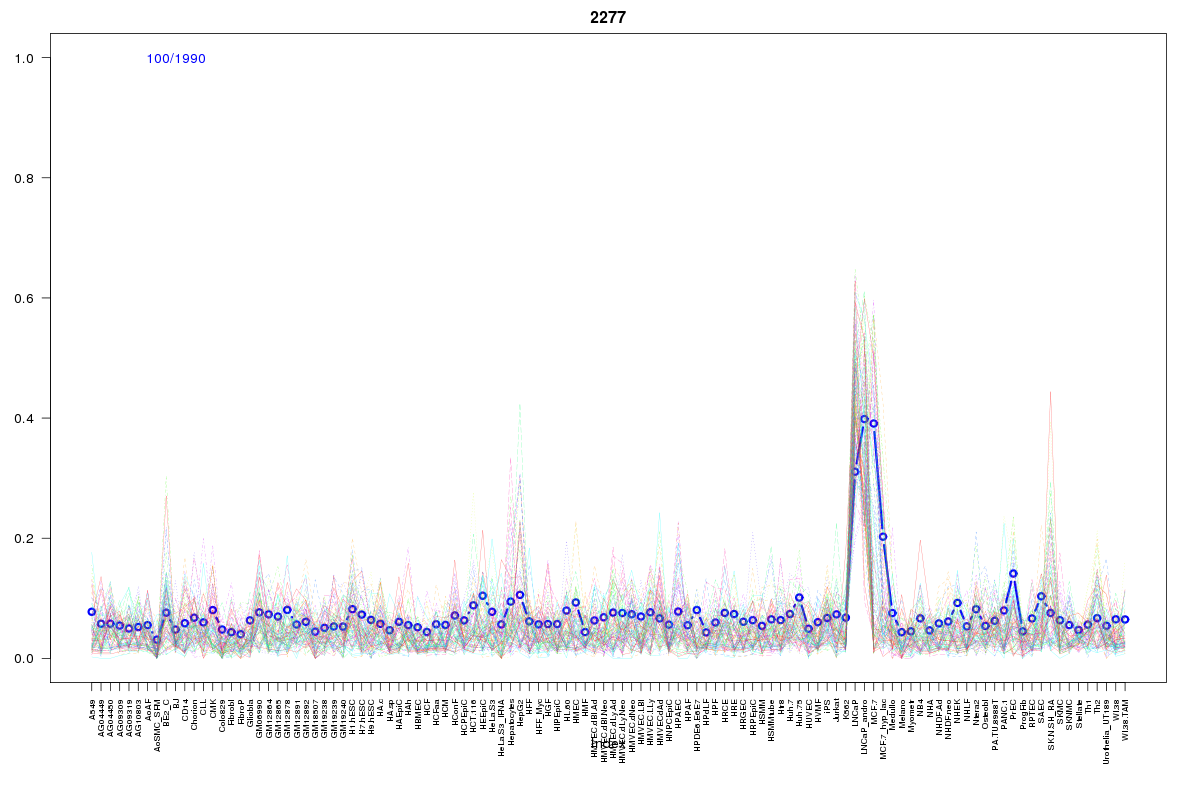 | 2277 | 1 |
 | 1970 | 1 |
Resources
BED file downloads
Connects to 52 DHS sitesTop 10 Correlated DHS Sites
p-values indiciate significant higher or lower correlation| Location | Cluster | P-value |
|---|---|---|
| chr1:201066920-201067070 | 1569 | 0 |
| chr1:201080420-201080570 | 1518 | 0 |
| chr1:201080240-201080390 | 1569 | 0.001 |
| chr1:201097720-201097870 | 1569 | 0.001 |
| chr1:201094300-201094450 | 1518 | 0.001 |
| chr1:201072900-201073050 | 1520 | 0.003 |
| chr1:201065220-201065370 | 1518 | 0.005 |
| chr1:201074960-201075110 | 1569 | 0.005 |
| chr1:200998720-200998870 | 1721 | 0.005 |
| chr1:201081560-201081710 | 1520 | 0.005 |
| chr1:201081805-201081955 | 860 | 0.005 |
External Databases
UCSCEnsembl (ENSG00000081248)