Gene: APOA1BP
chr1: 156561553-156564091Expression Profile
(log scale)
Graphical Connections
Distribution of linked clusters:
You may find it interesting if many of the connected DHS sites belong to the same cluster.| Cluster Profile | Cluster ID | Number of DHS sites in this cluster |
|---|---|---|
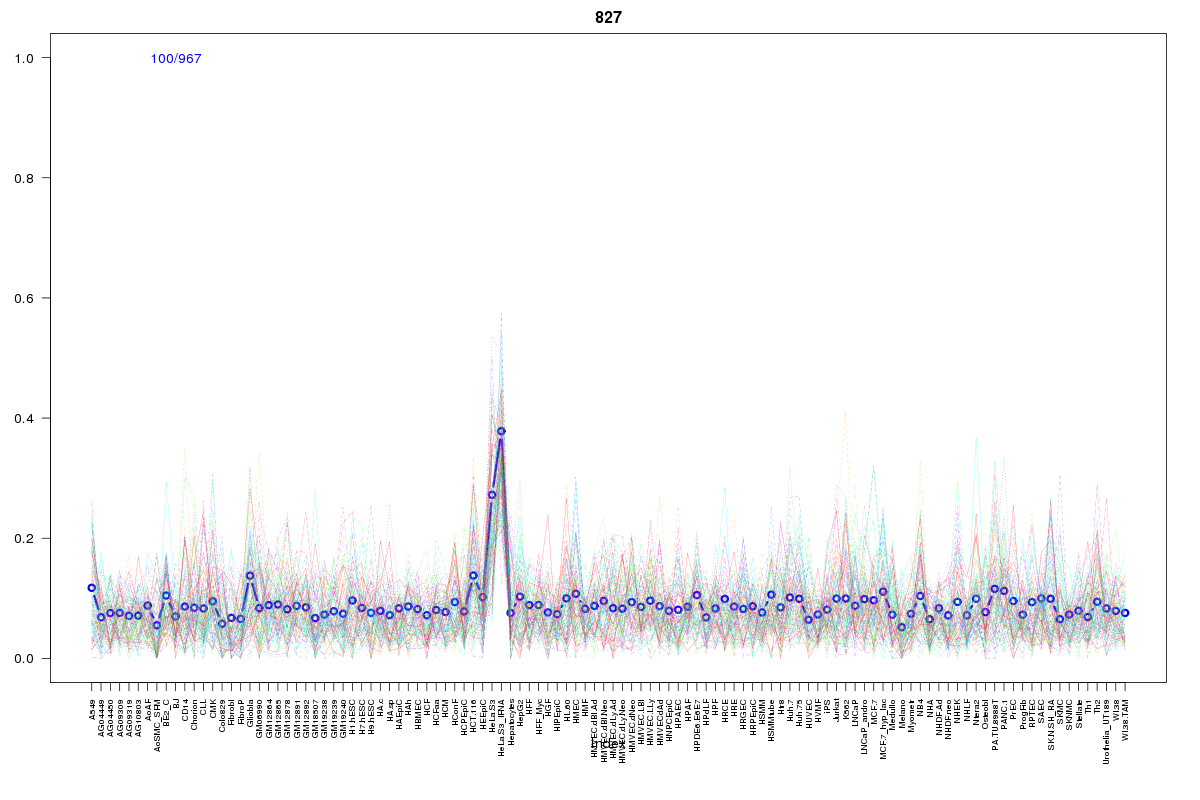 | 827 | 3 |
 | 1724 | 3 |
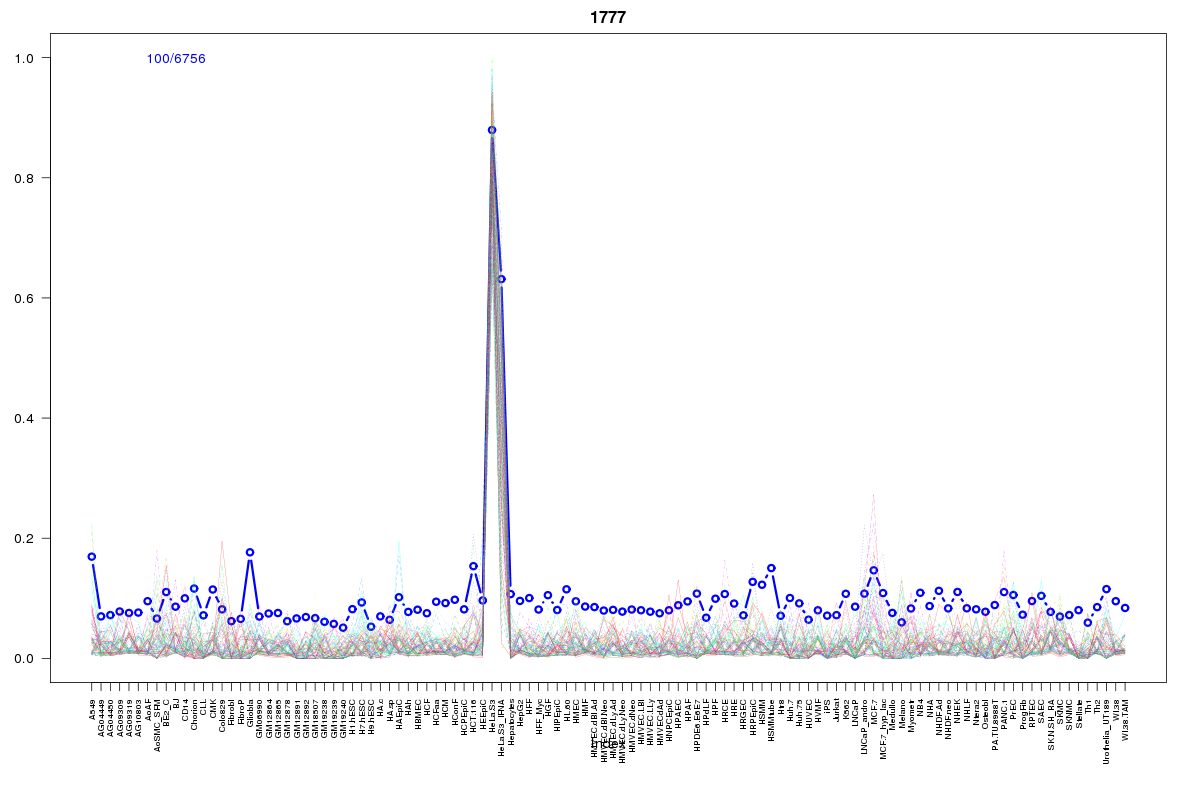 | 1777 | 2 |
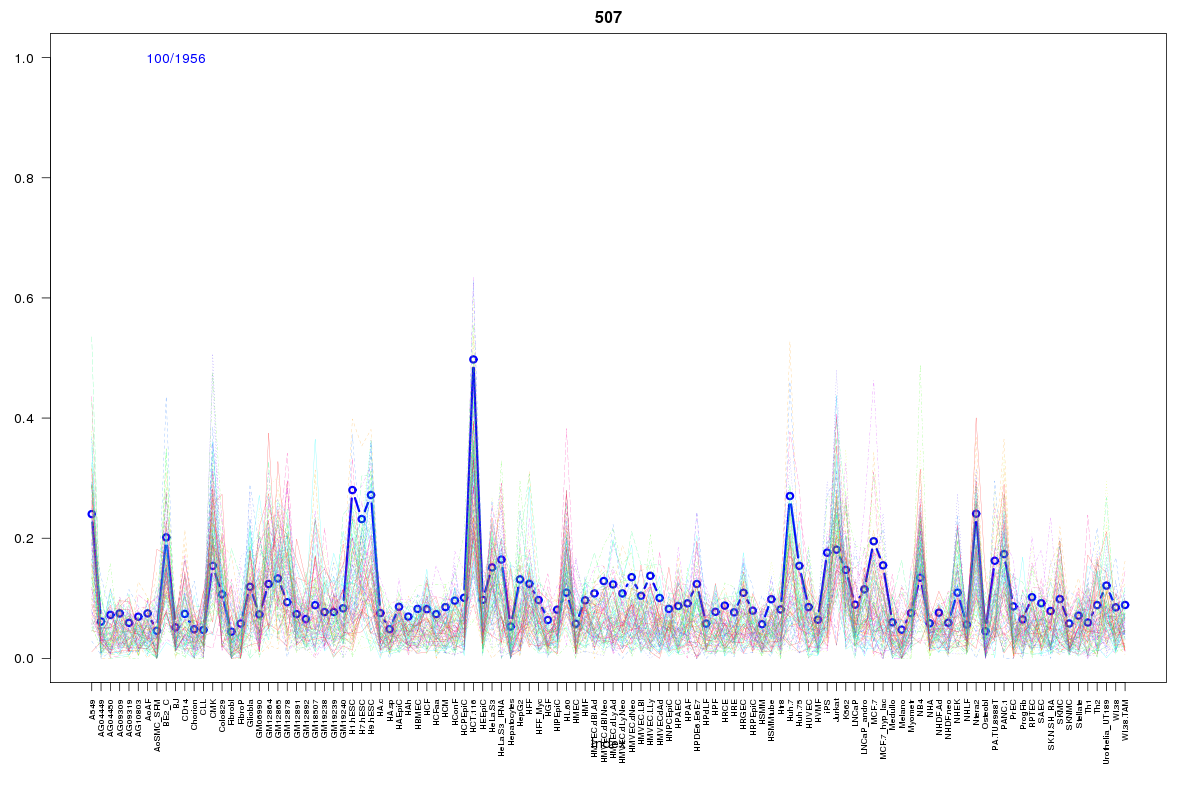 | 507 | 2 |
 | 2055 | 2 |
 | 615 | 2 |
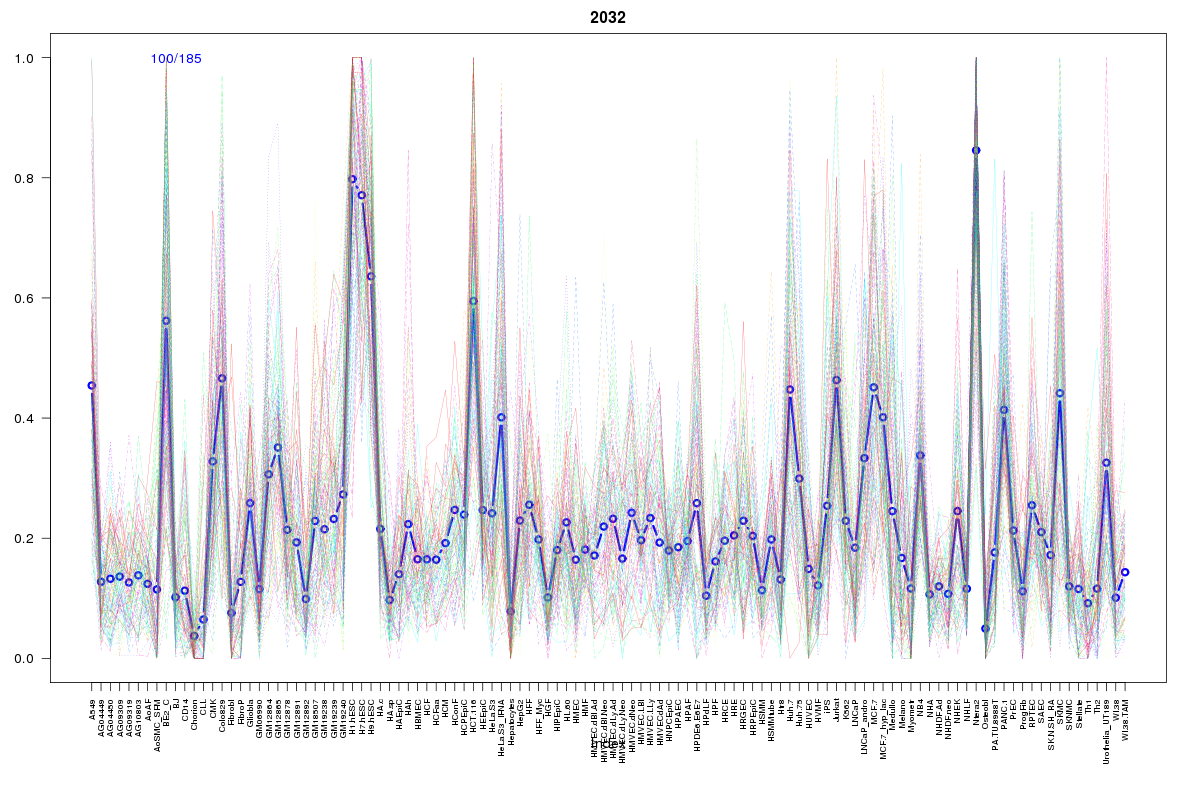 | 2032 | 1 |
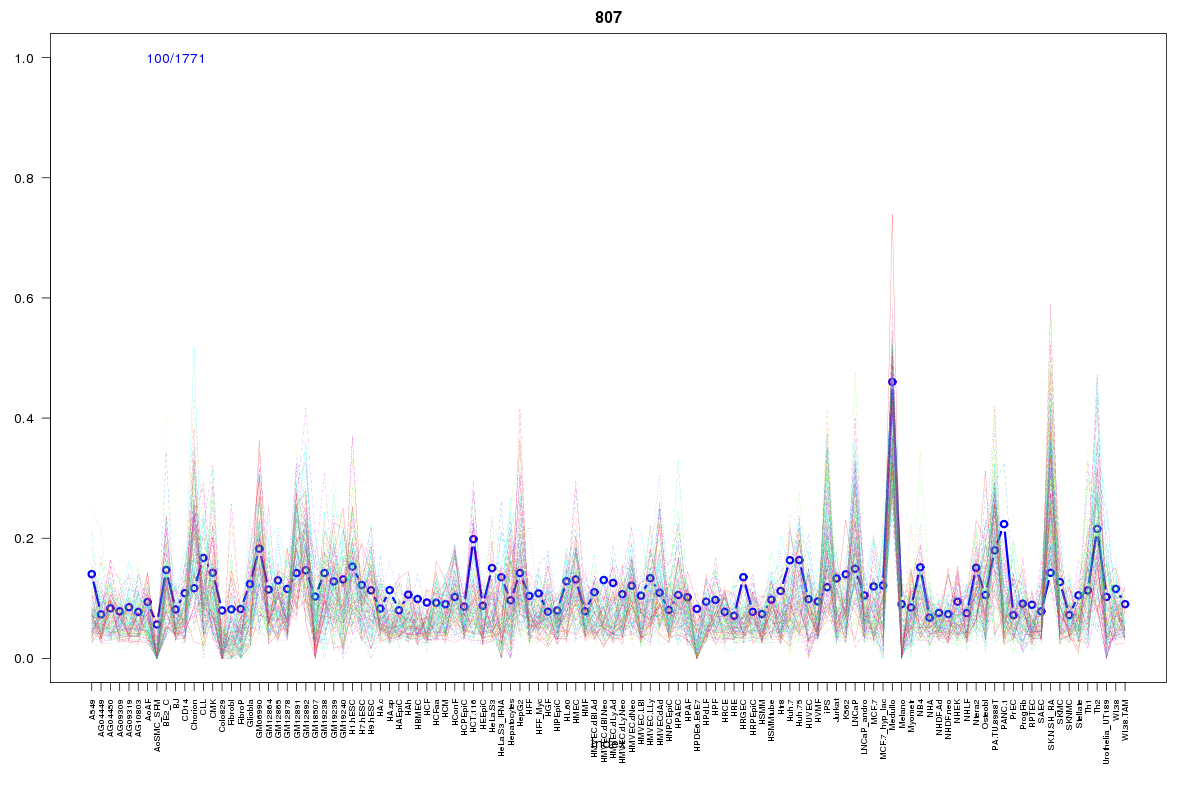 | 807 | 1 |
 | 1970 | 1 |
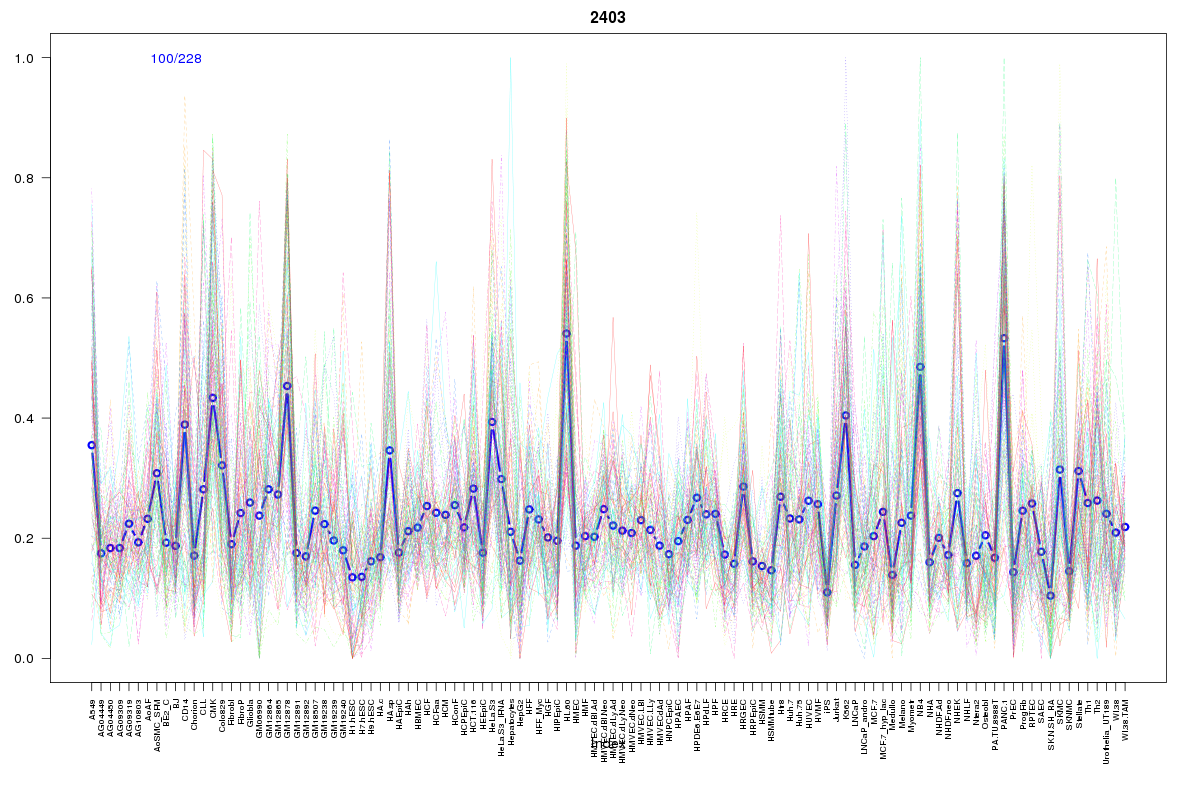 | 2403 | 1 |
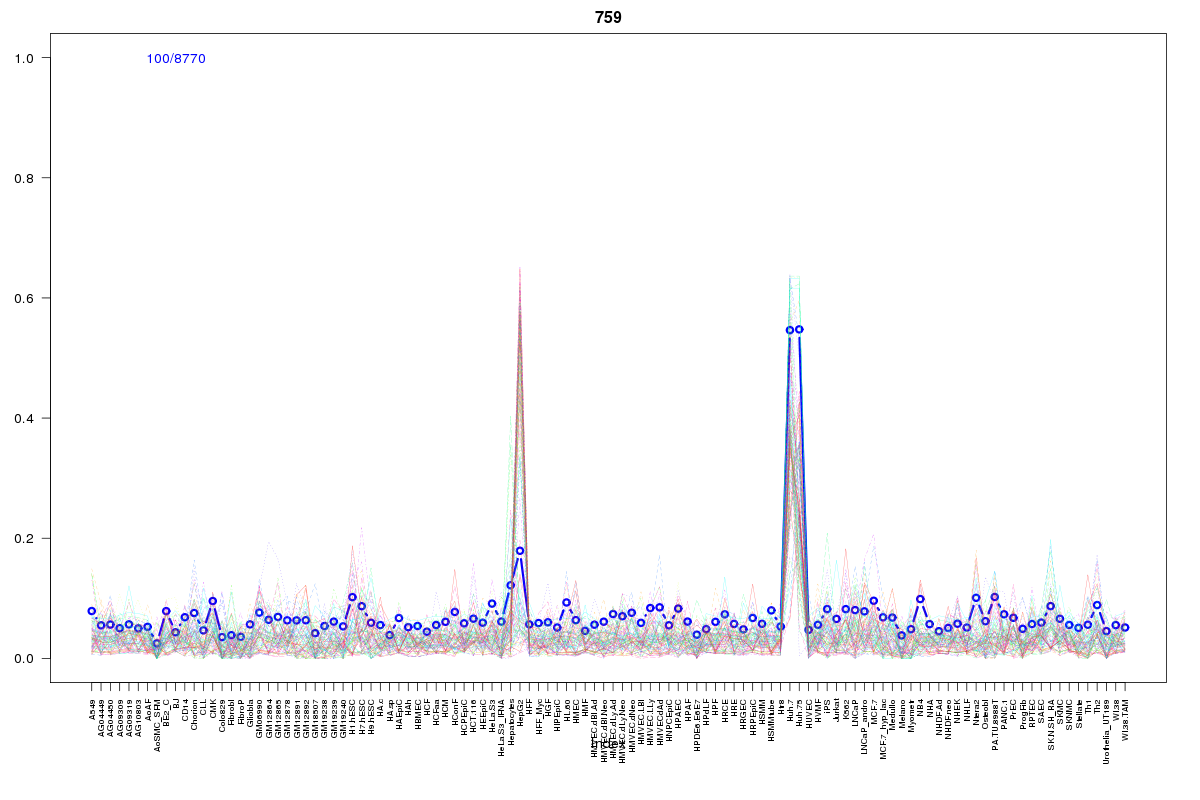 | 759 | 1 |
 | 881 | 1 |
 | 2175 | 1 |
 | 2059 | 1 |
 | 2279 | 1 |
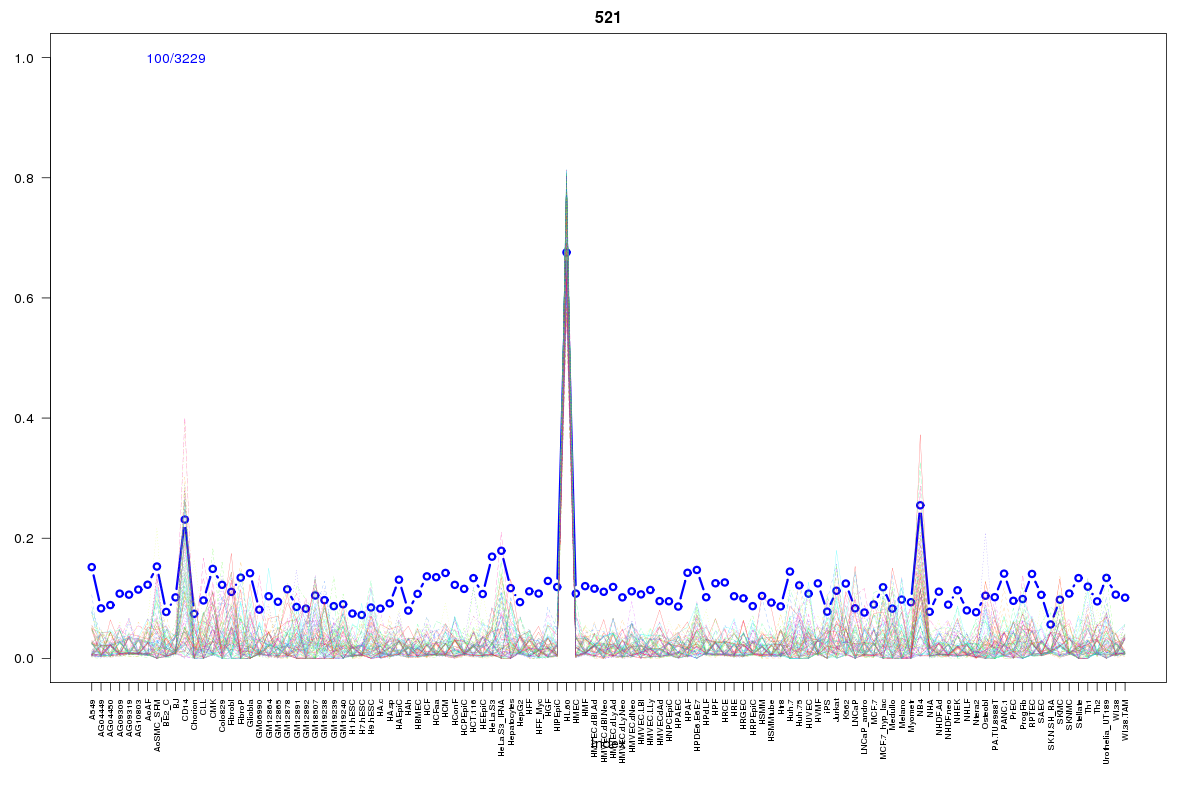 | 521 | 1 |
 | 402 | 1 |
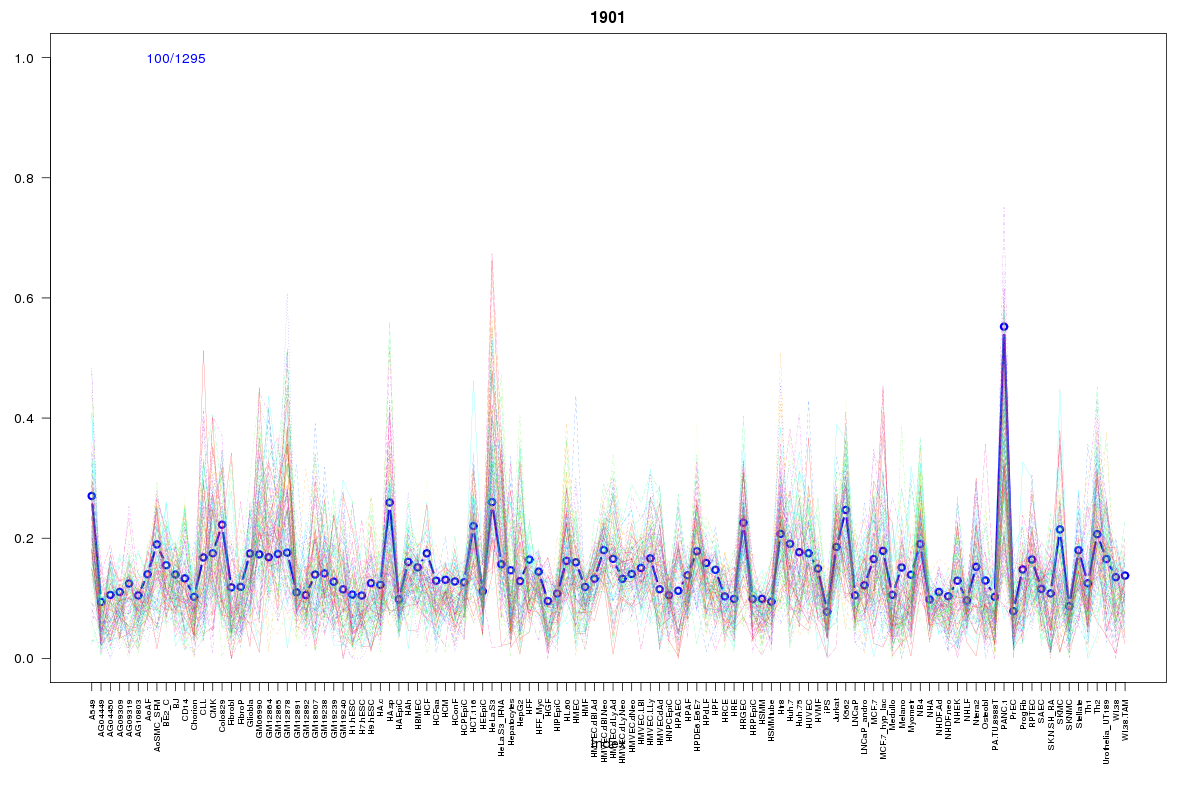 | 1901 | 1 |
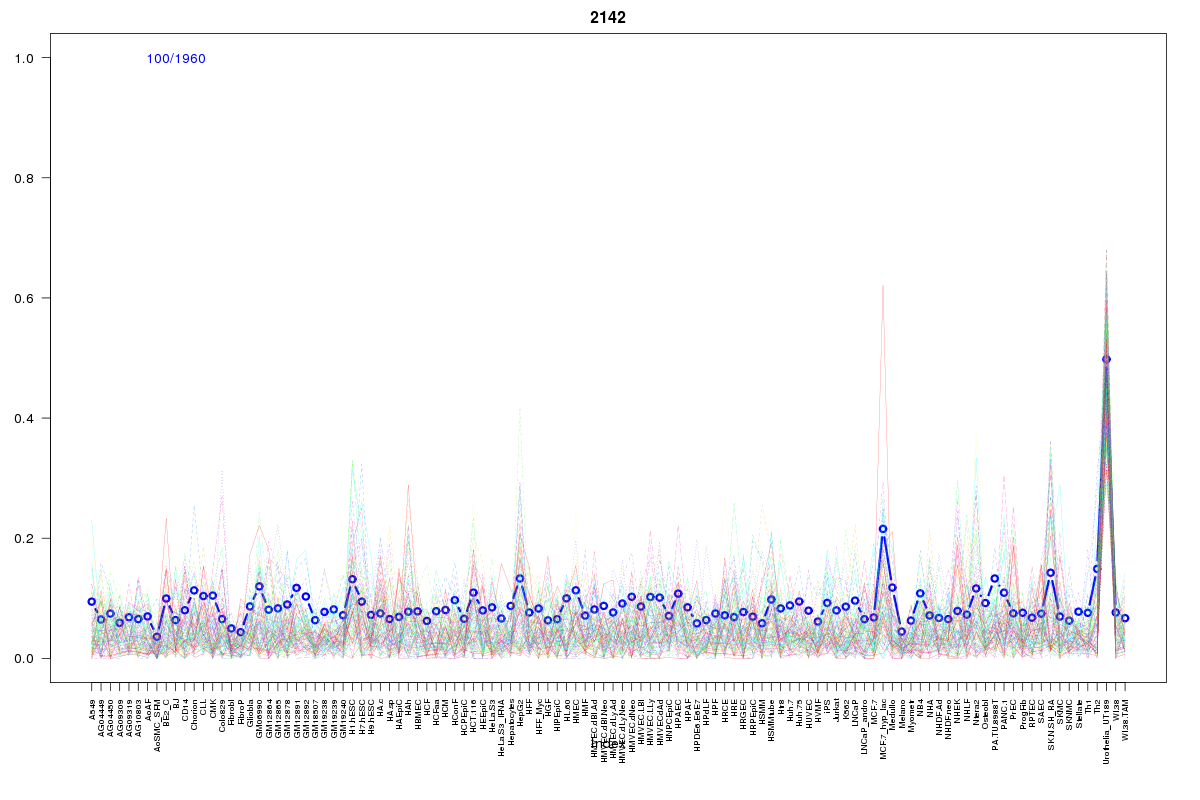 | 2142 | 1 |
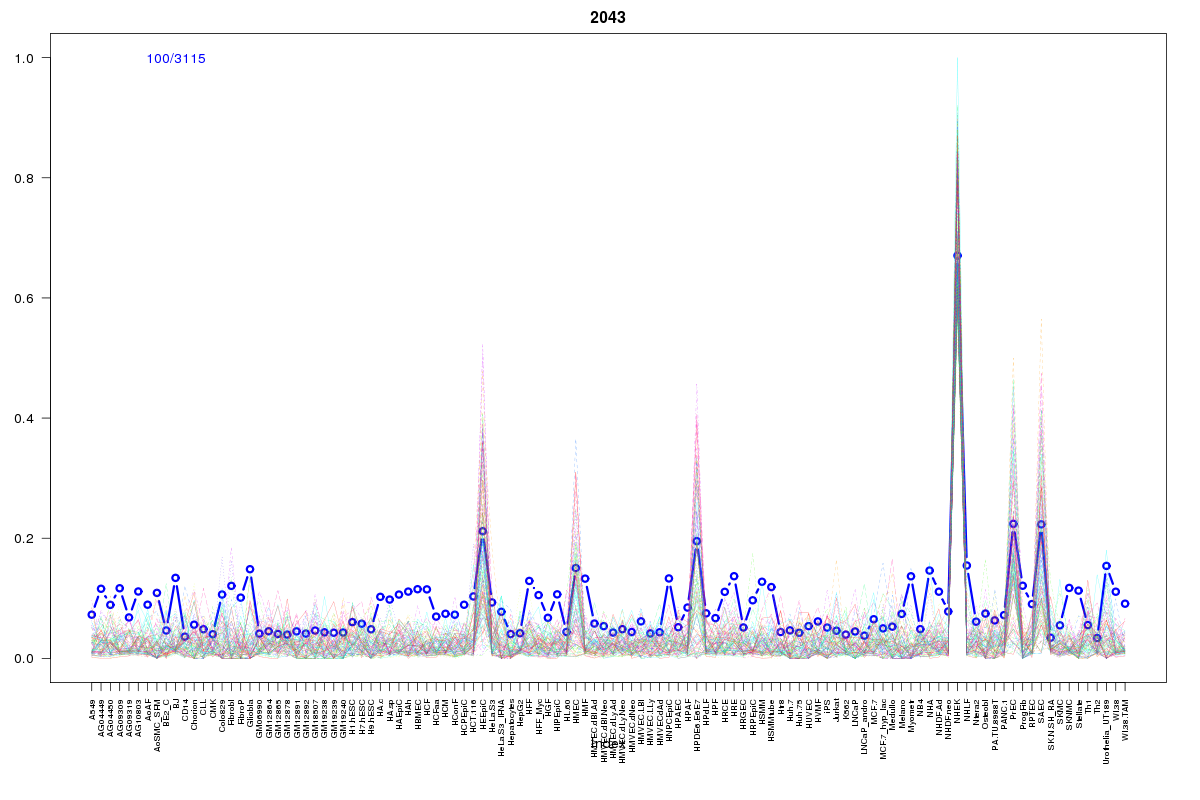 | 2043 | 1 |
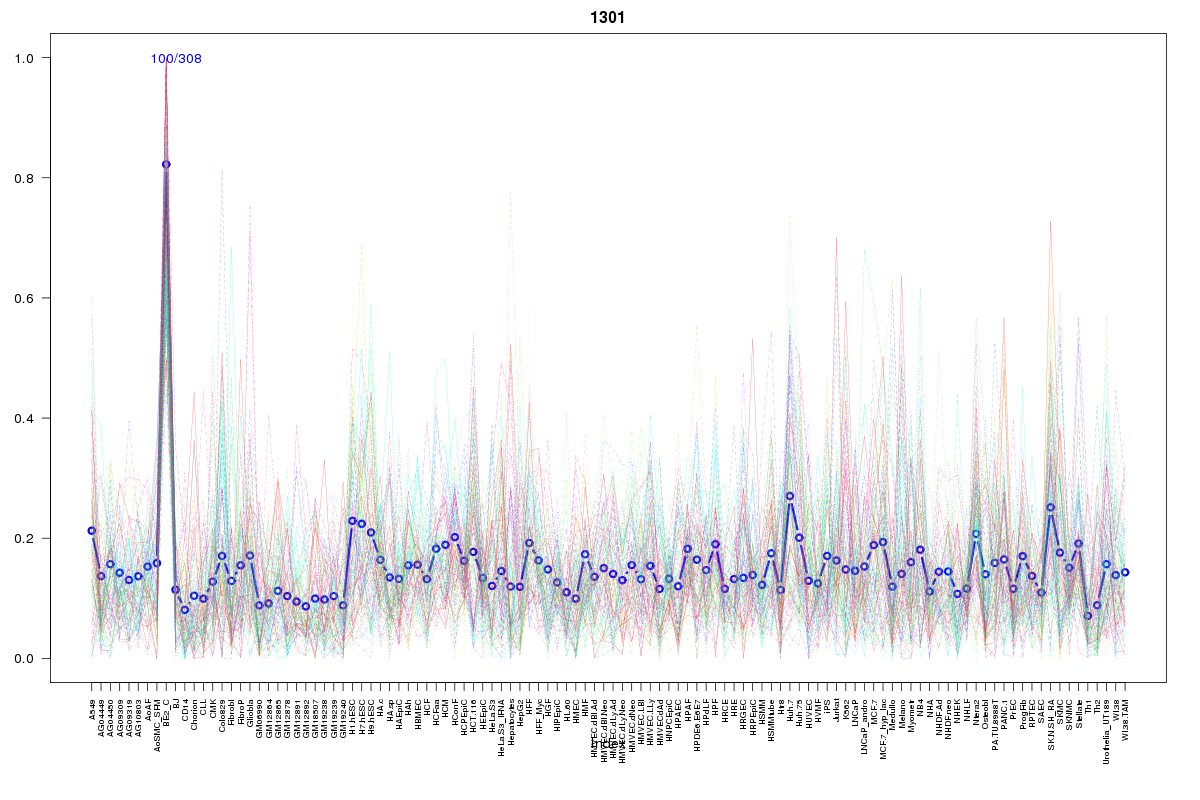 | 1301 | 1 |
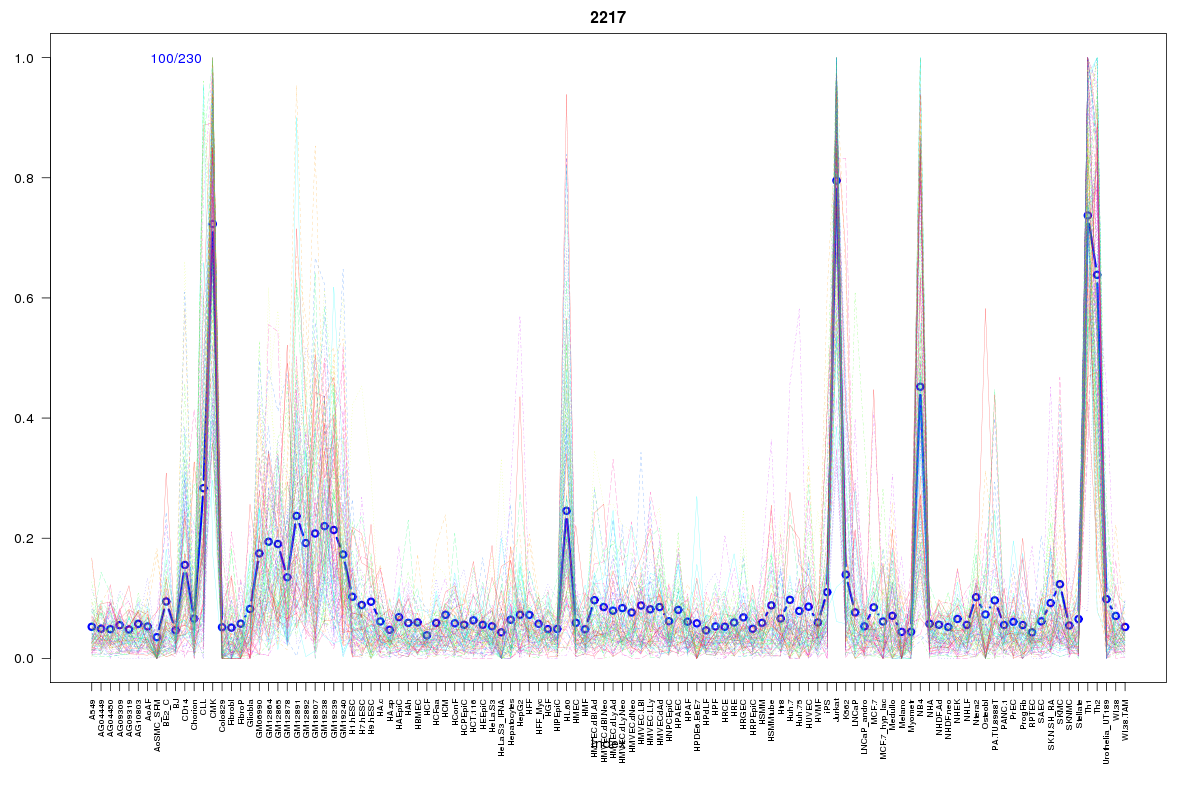 | 2217 | 1 |
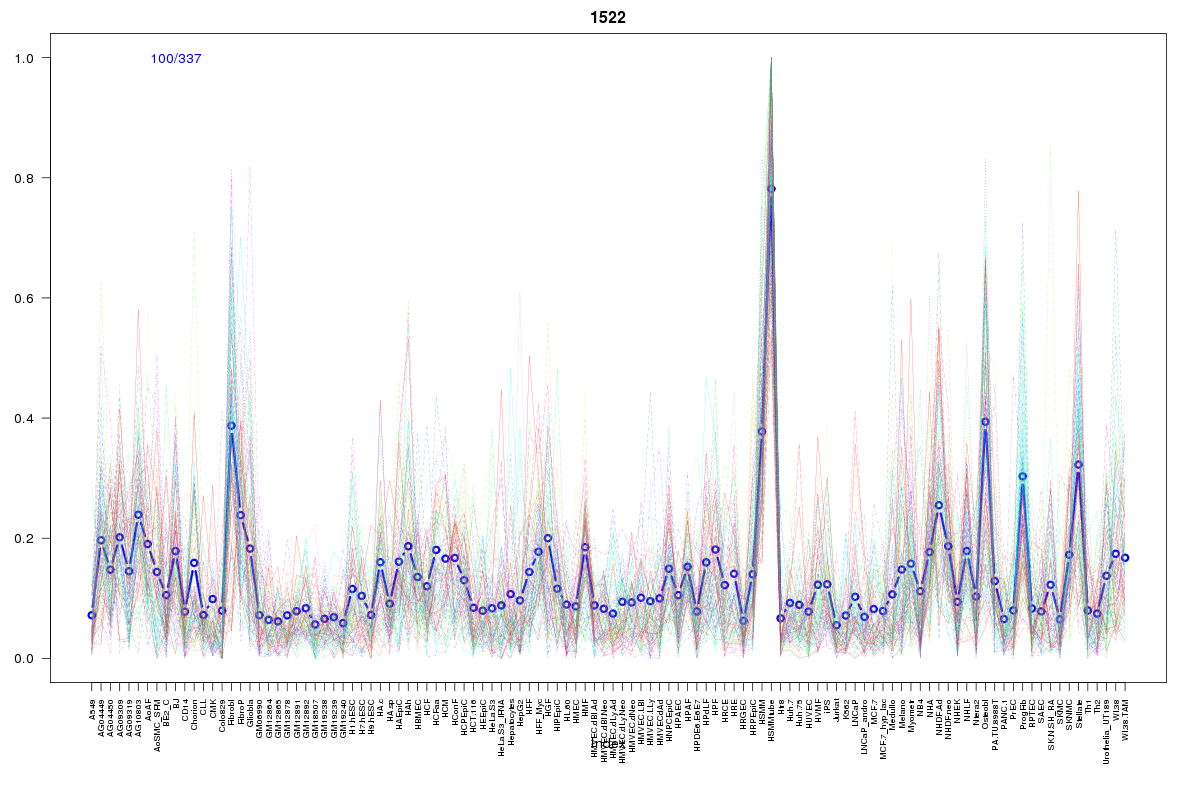 | 1522 | 1 |
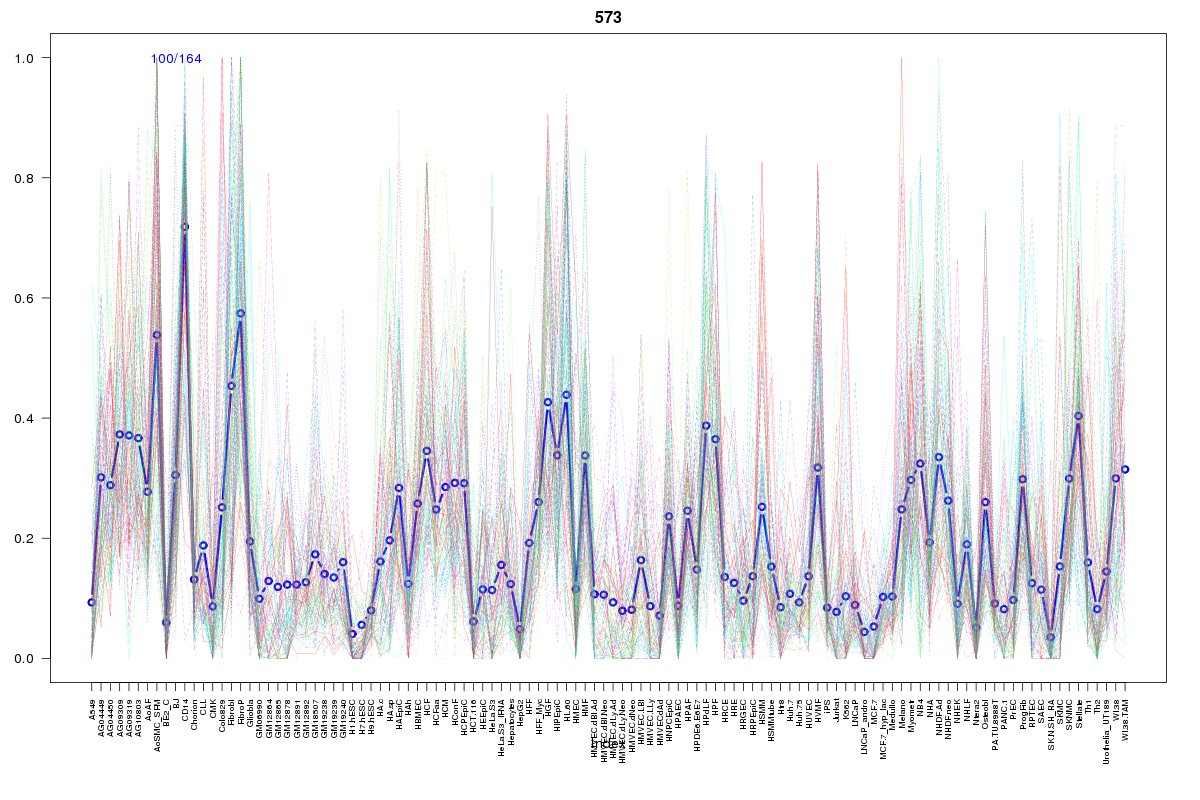 | 573 | 1 |
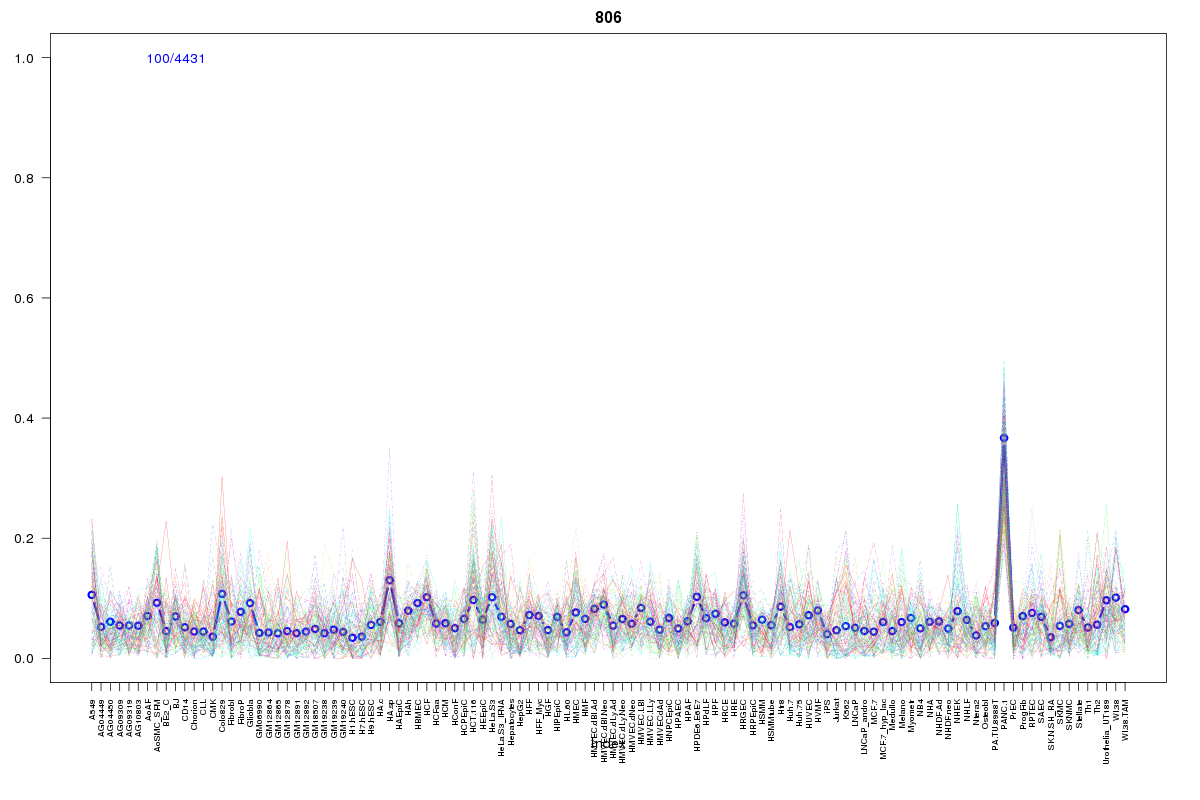 | 806 | 1 |
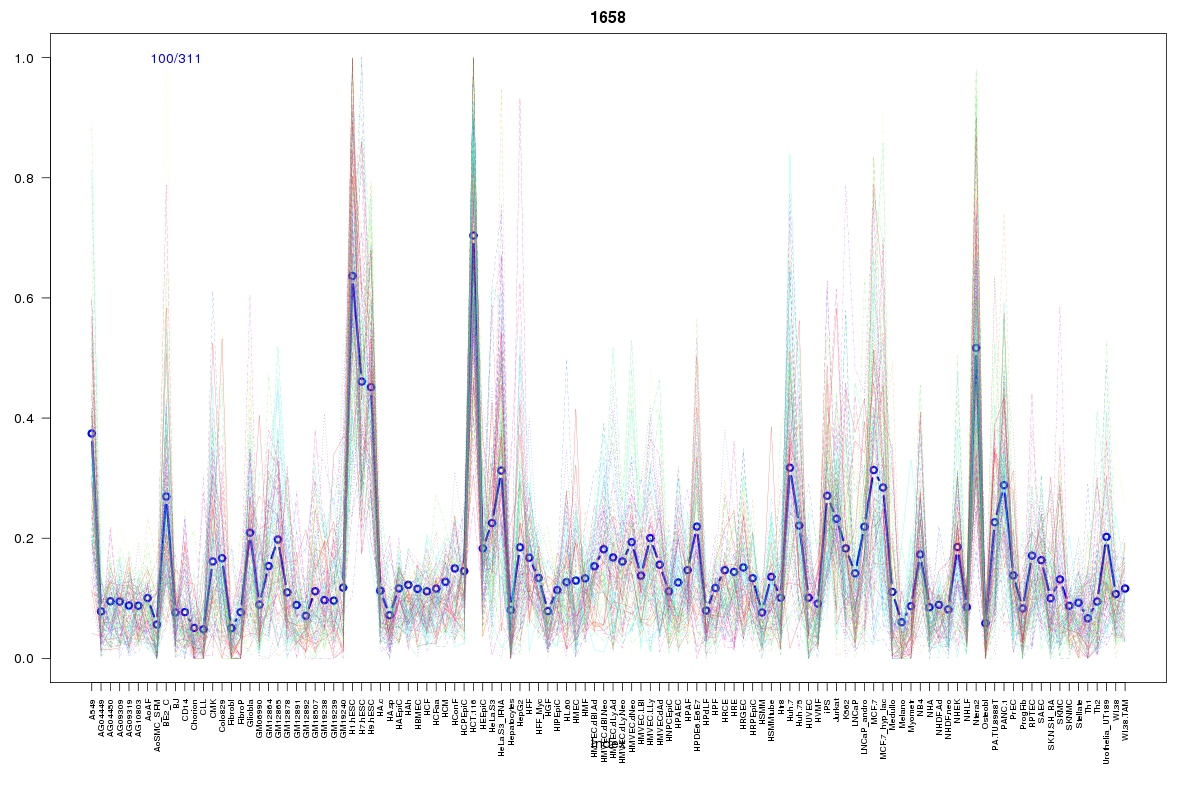 | 1658 | 1 |
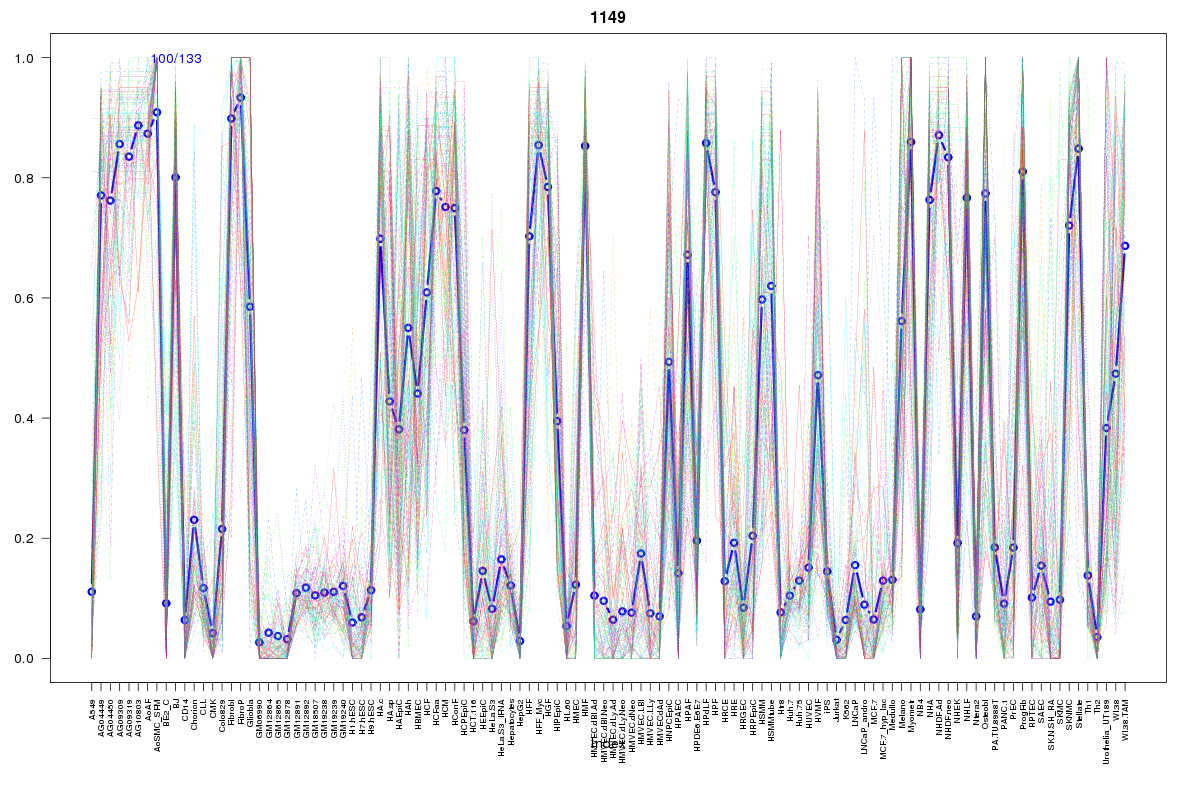 | 1149 | 1 |
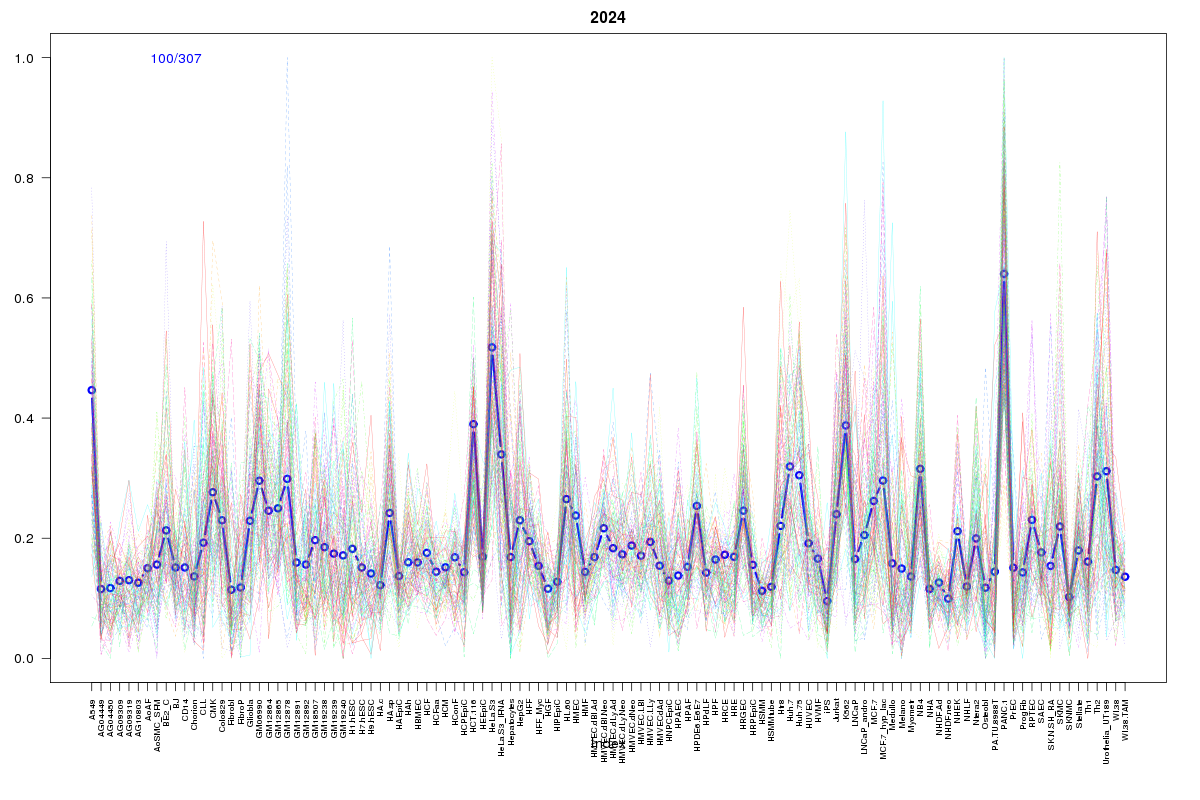 | 2024 | 1 |
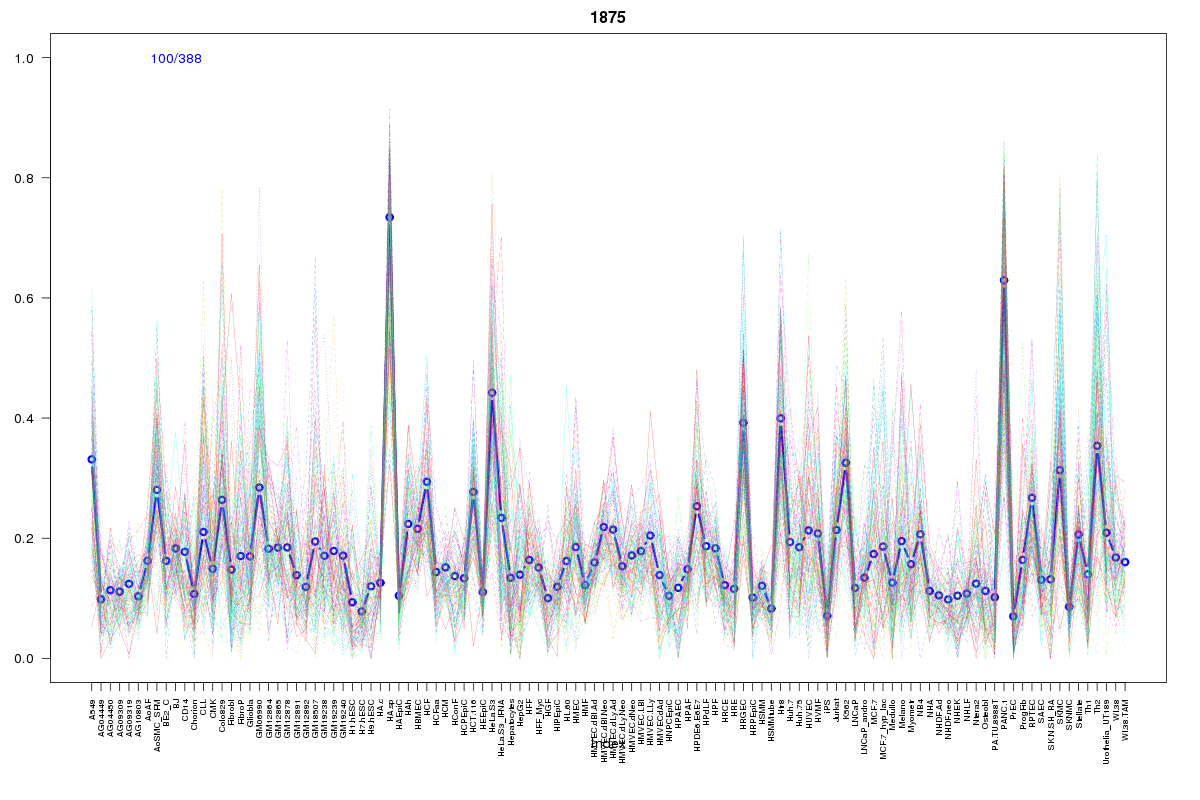 | 1875 | 1 |
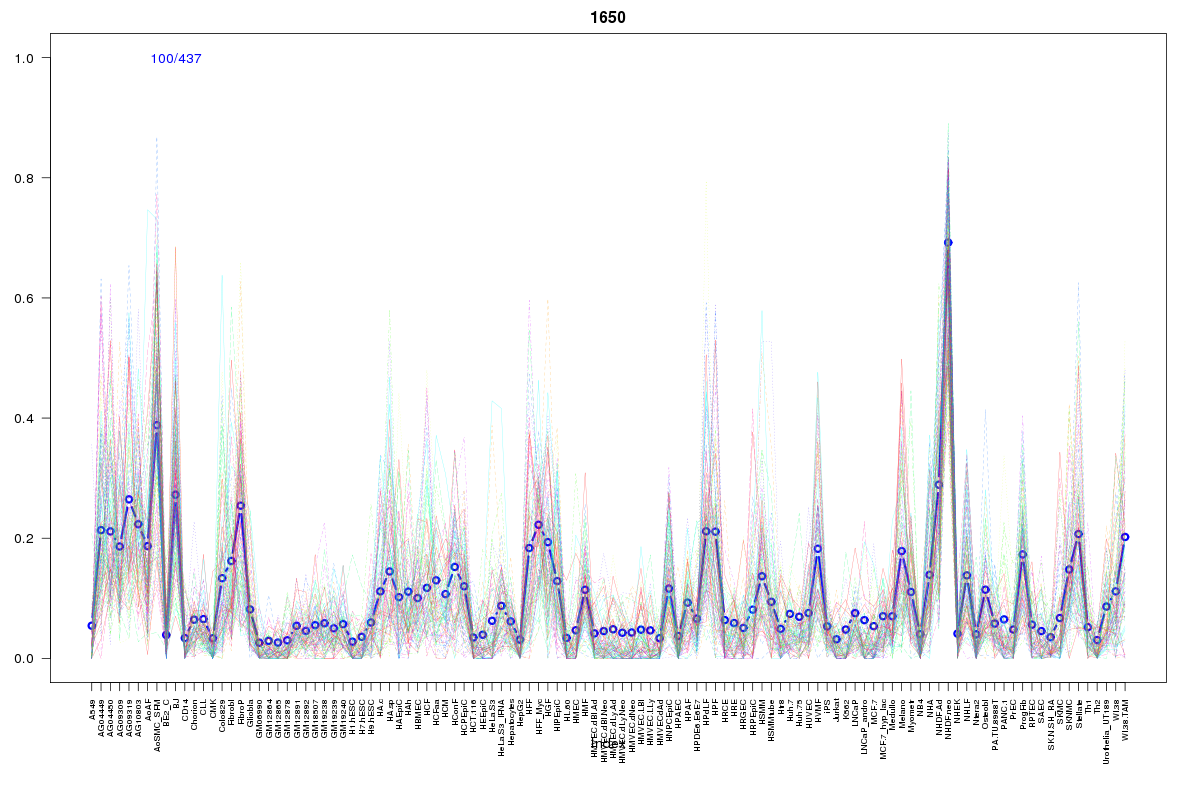 | 1650 | 1 |
 | 416 | 1 |
 | 2052 | 1 |
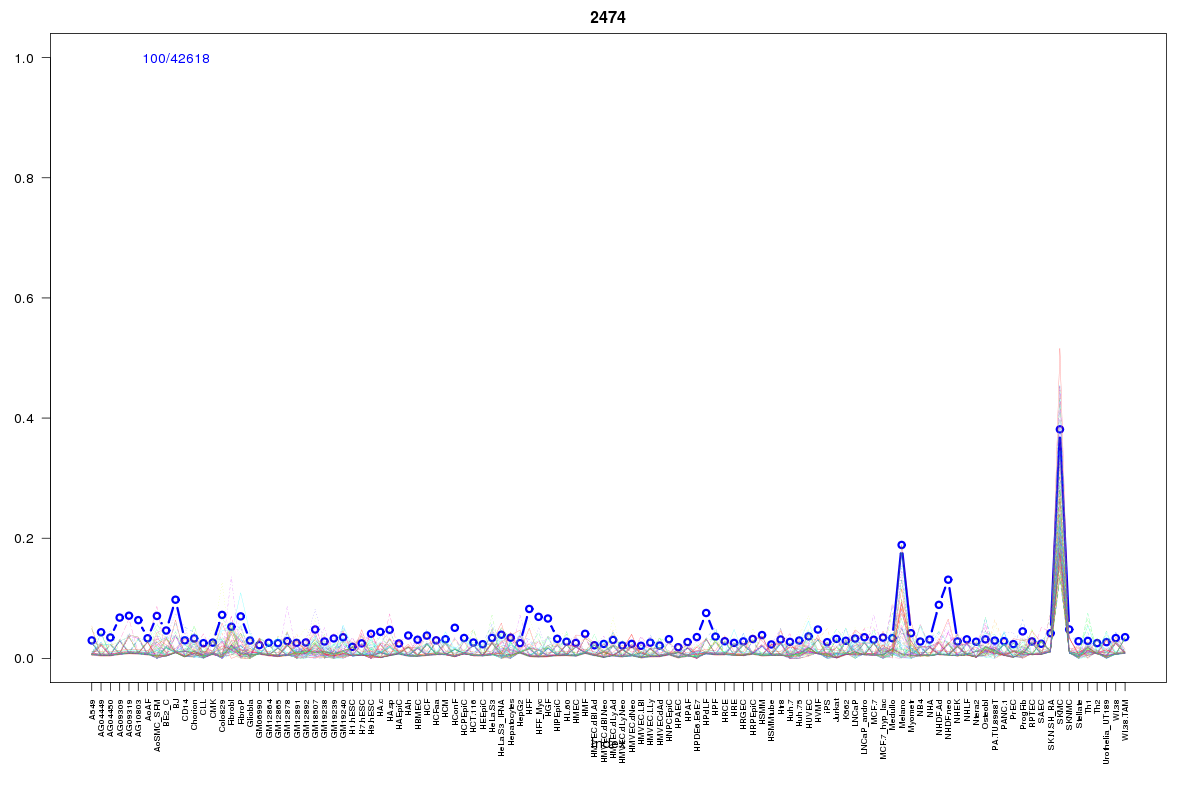 | 2474 | 1 |
 | 629 | 1 |
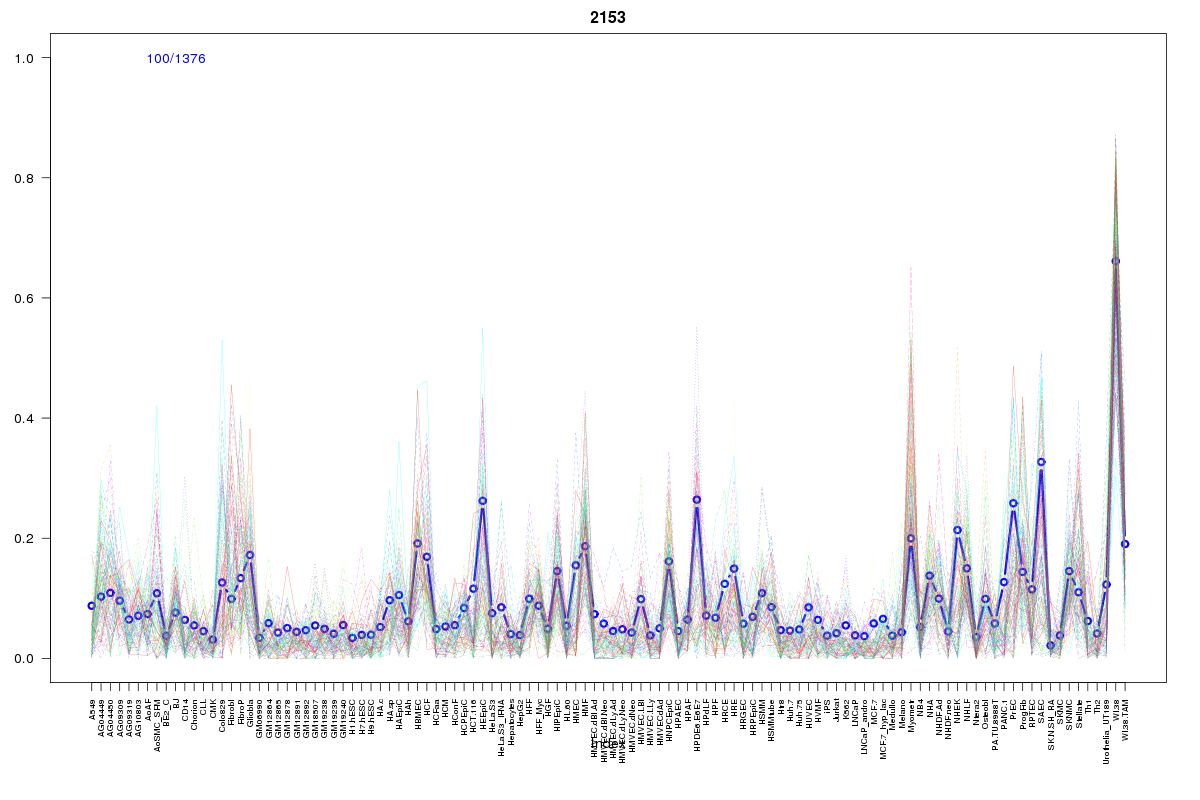 | 2153 | 1 |
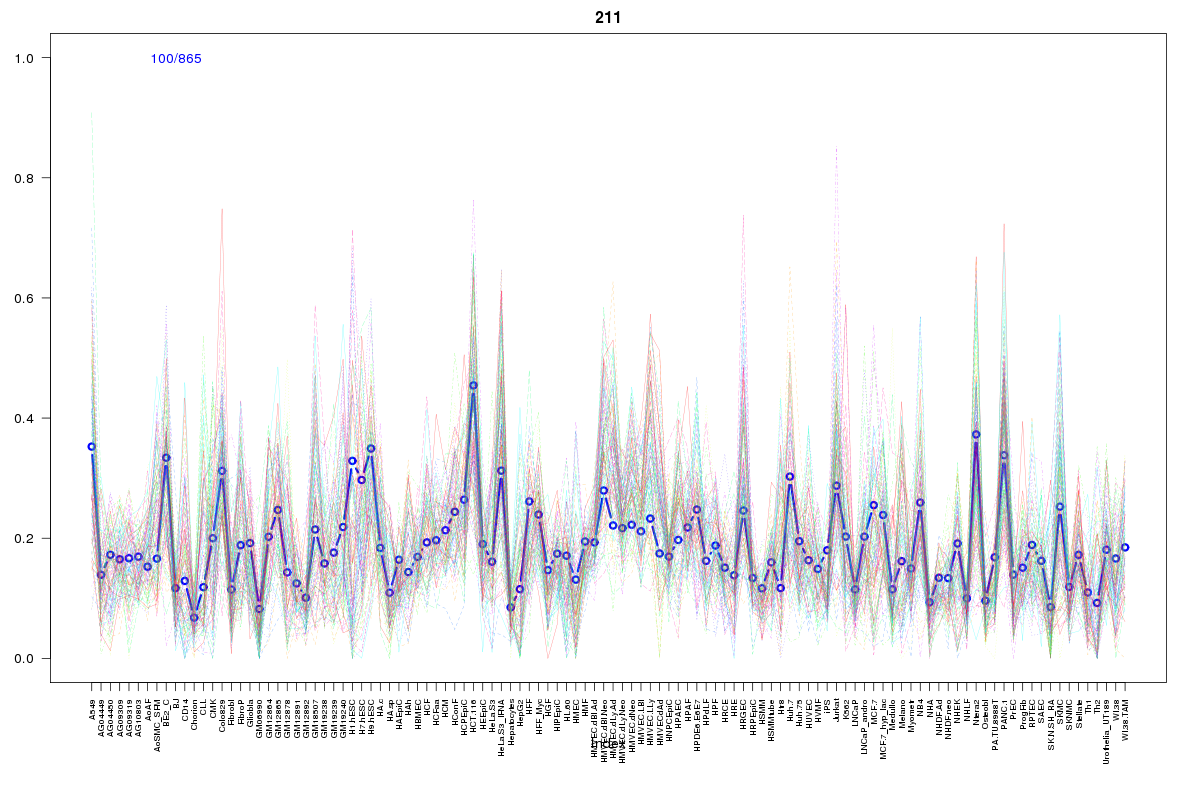 | 211 | 1 |
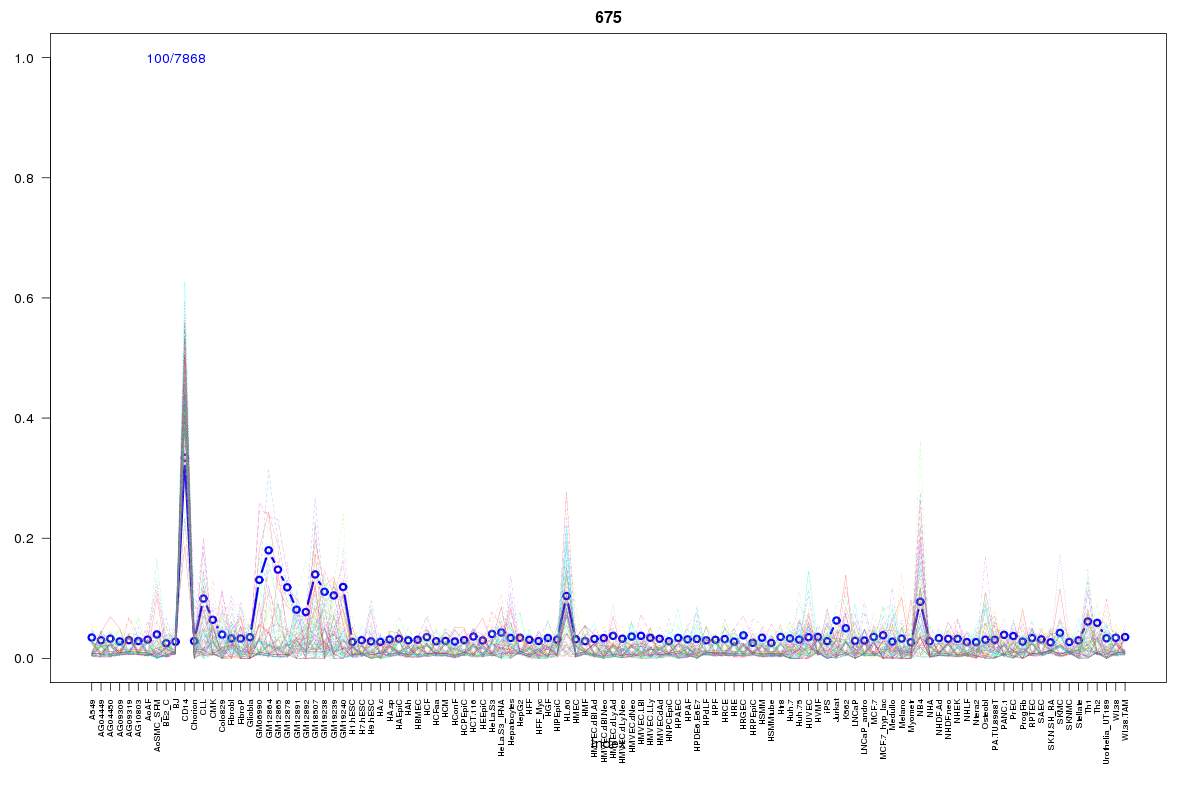 | 675 | 1 |
 | 1980 | 1 |
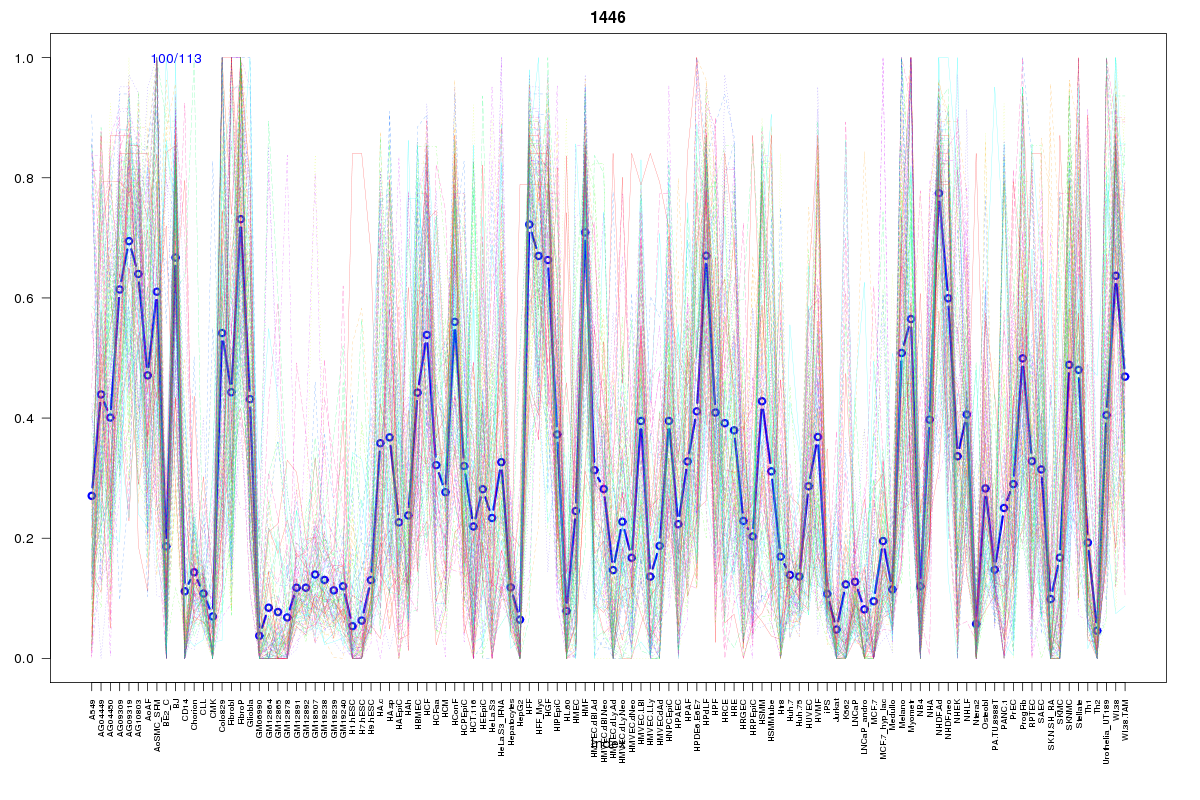 | 1446 | 1 |
Resources
BED file downloads
Connects to 47 DHS sitesTop 10 Correlated DHS Sites
p-values indiciate significant higher or lower correlation| Location | Cluster | P-value |
|---|---|---|
| chr1:156472100-156472250 | 2175 | 0 |
| chr1:156542585-156542735 | 807 | 0 |
| chr1:156570620-156570770 | 629 | 0.001 |
| chr1:156472320-156472470 | 521 | 0.001 |
| chr1:156572600-156572750 | 211 | 0.001 |
| chr1:156474280-156474430 | 2217 | 0.002 |
| chr1:156610005-156610155 | 827 | 0.002 |
| chr1:156578980-156579130 | 1980 | 0.004 |
| chr1:156630820-156630970 | 1901 | 0.004 |
| chr1:156554145-156554295 | 2059 | 0.004 |
| chr1:156619885-156620035 | 2055 | 0.006 |
External Databases
UCSCEnsembl (ENSG00000163382)