Gene: GLYCTK
chr3: 52321104-52327182Expression Profile
(log scale)
Graphical Connections
Distribution of linked clusters:
You may find it interesting if many of the connected DHS sites belong to the same cluster.| Cluster Profile | Cluster ID | Number of DHS sites in this cluster |
|---|---|---|
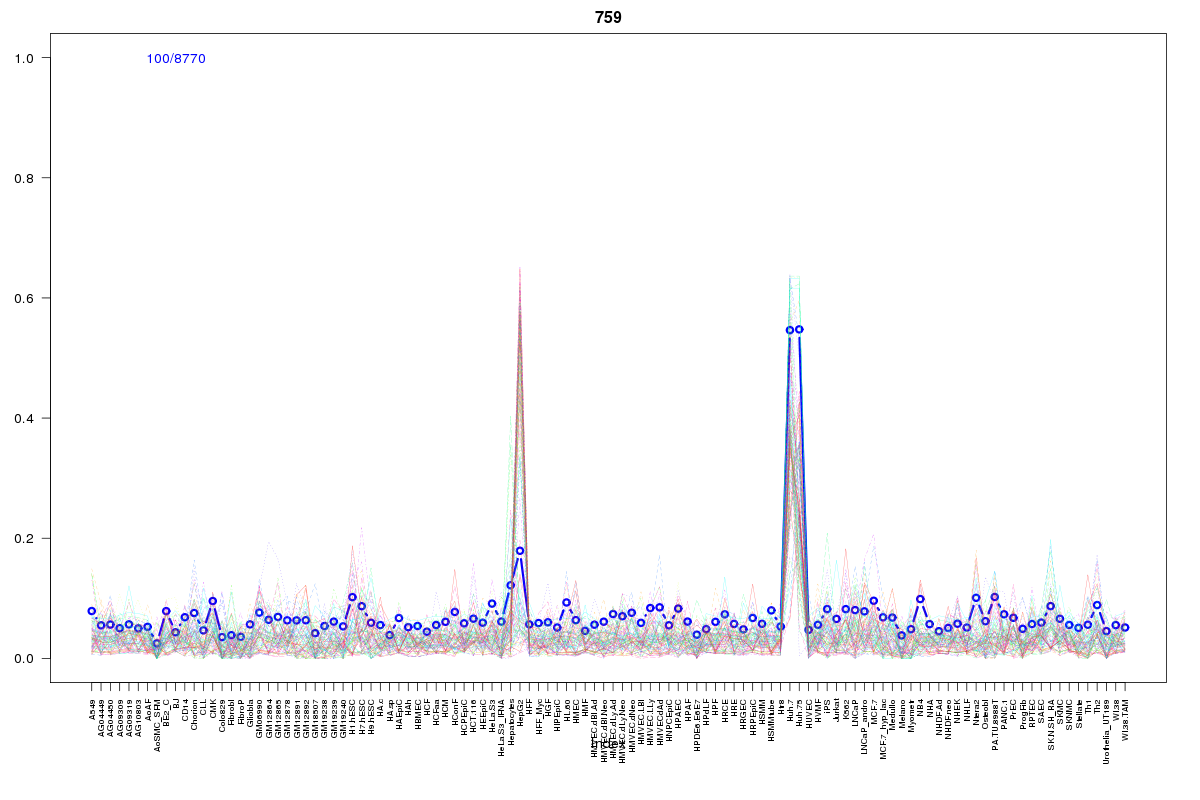 | 759 | 4 |
 | 1008 | 3 |
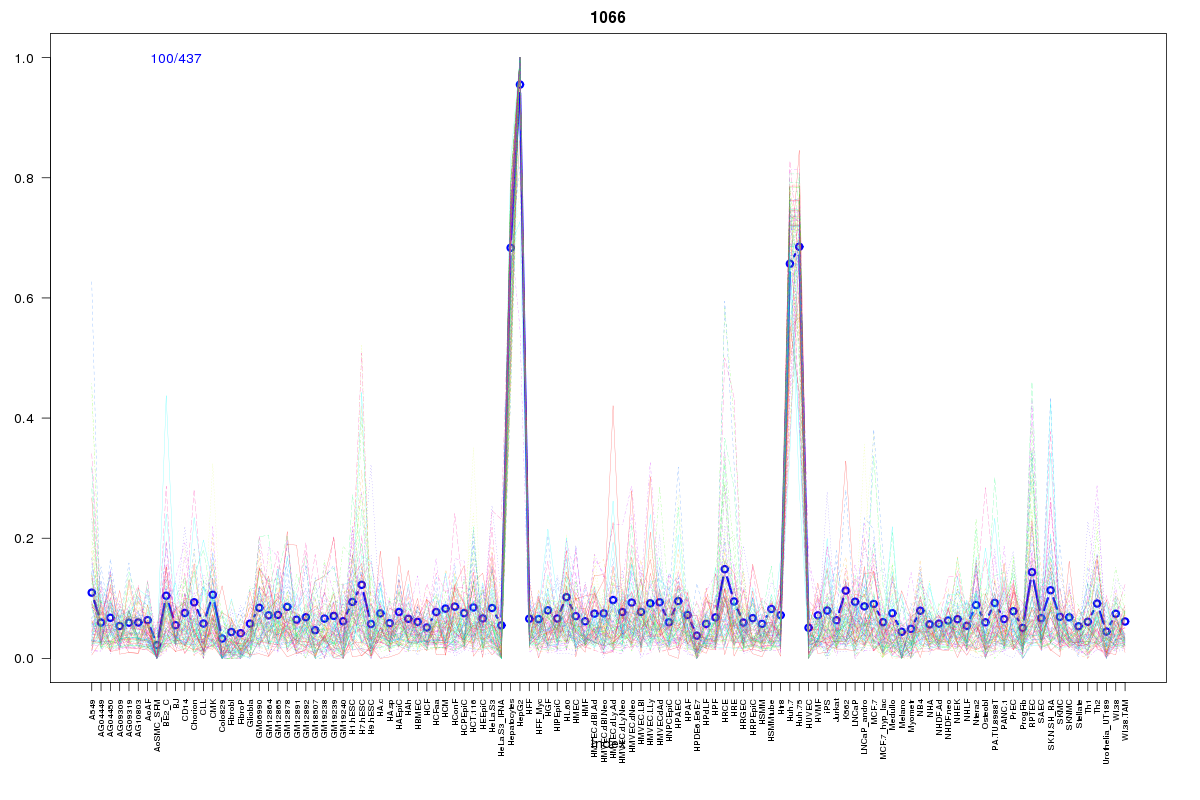 | 1066 | 2 |
 | 927 | 2 |
 | 1355 | 2 |
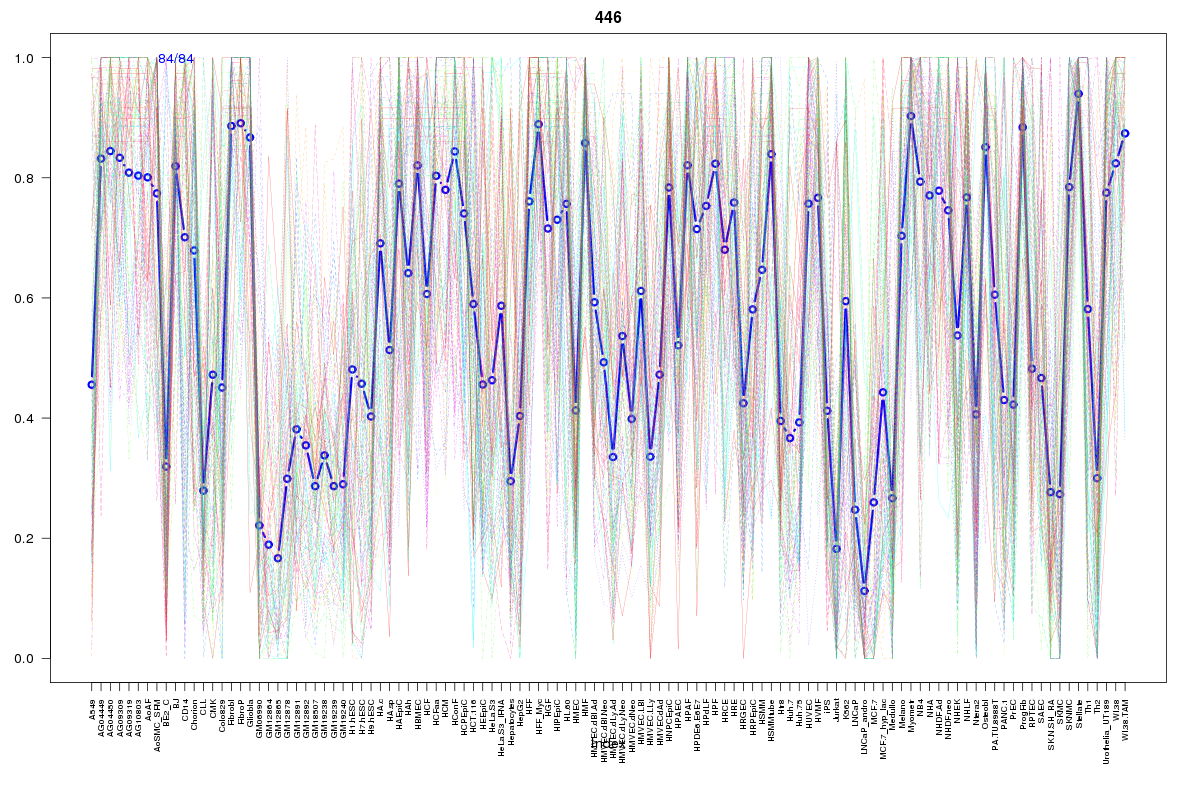 | 446 | 1 |
 | 1115 | 1 |
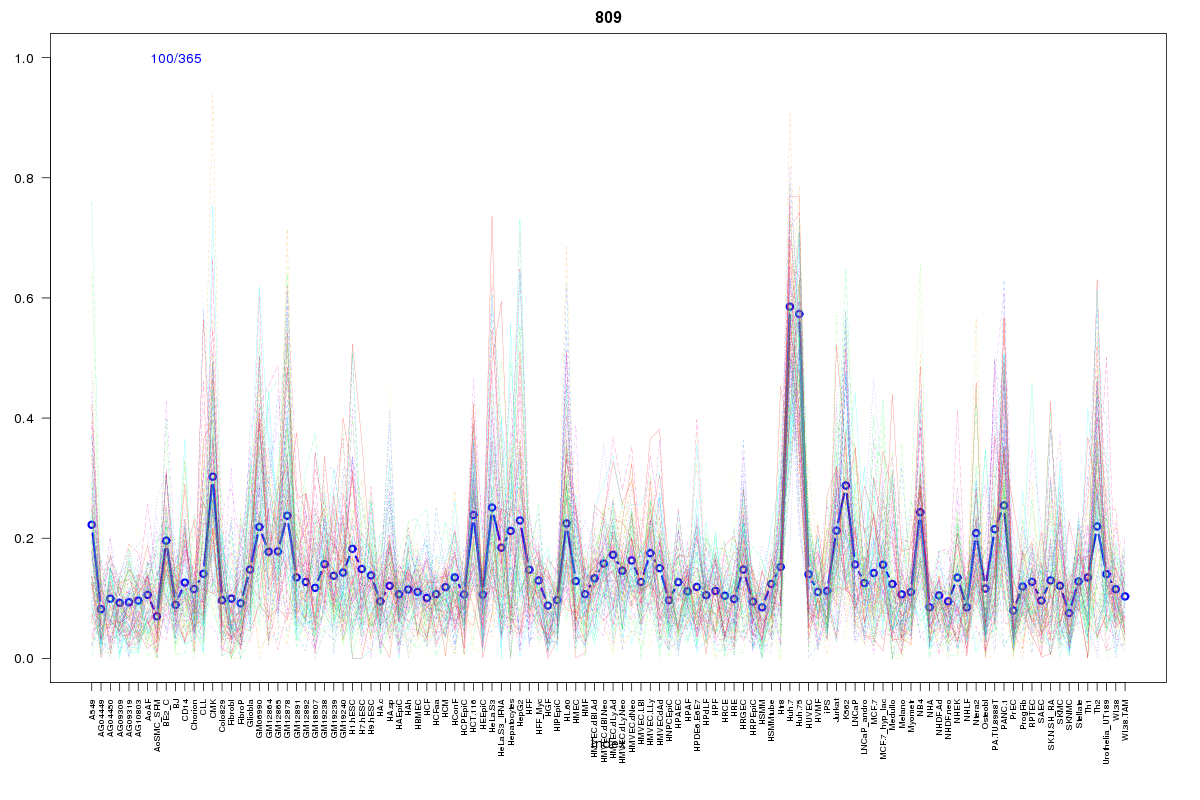 | 809 | 1 |
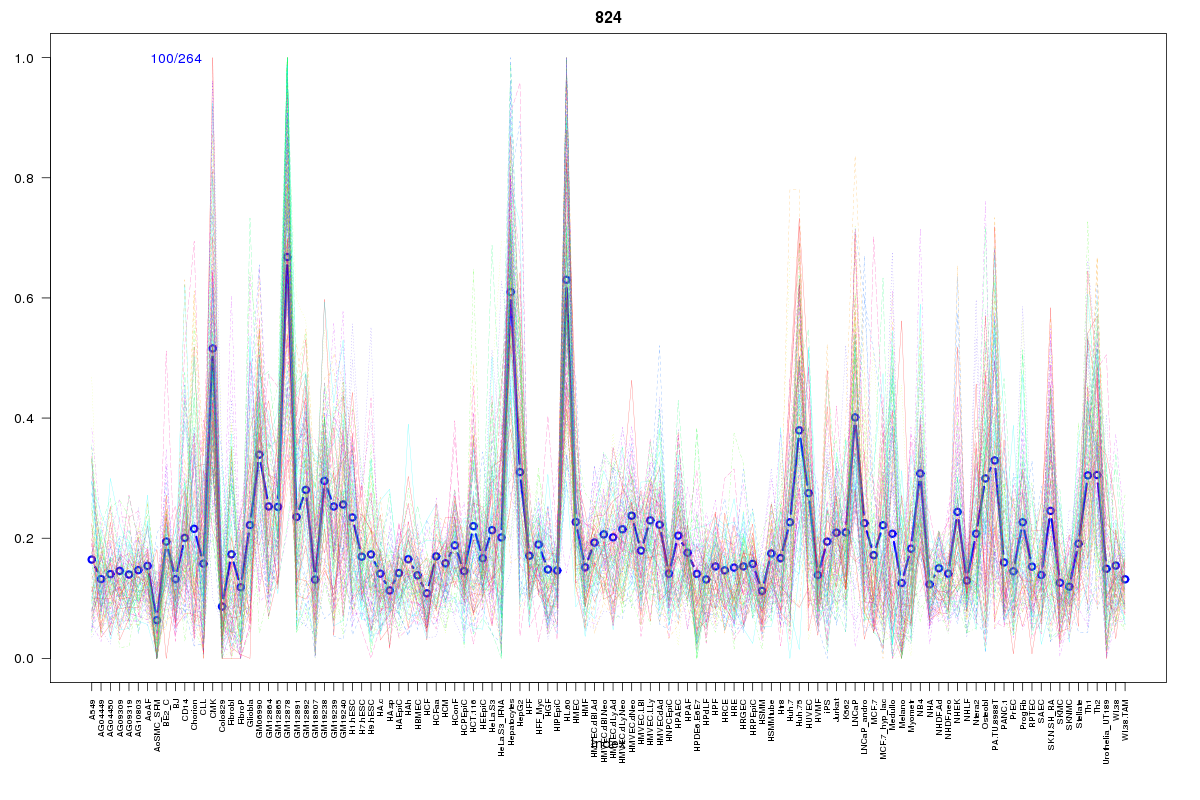 | 824 | 1 |
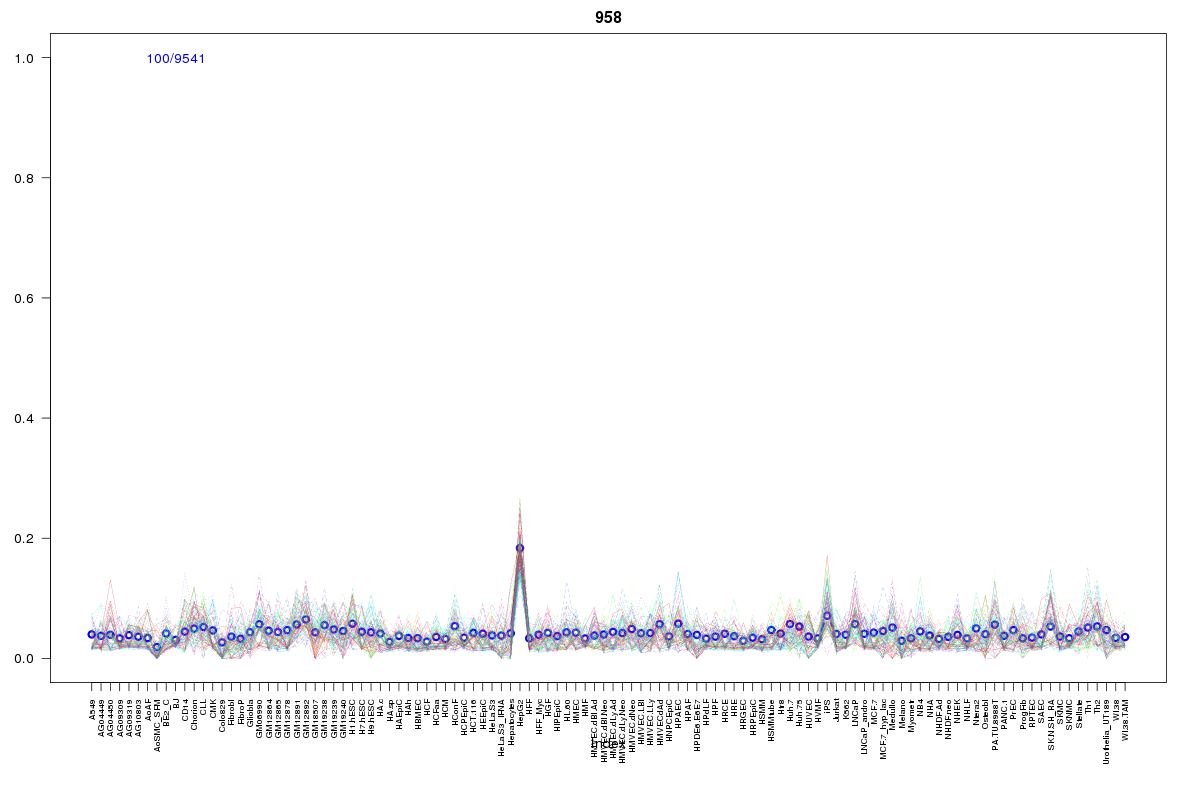 | 958 | 1 |
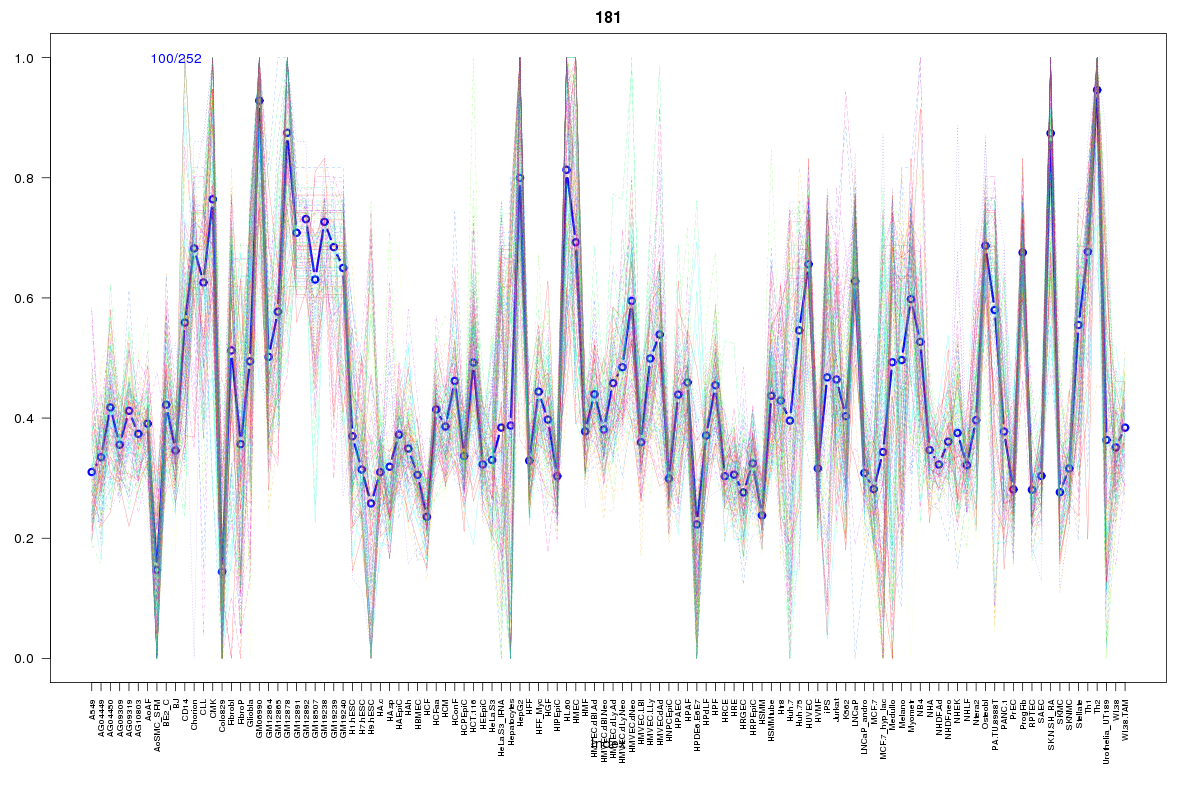 | 181 | 1 |
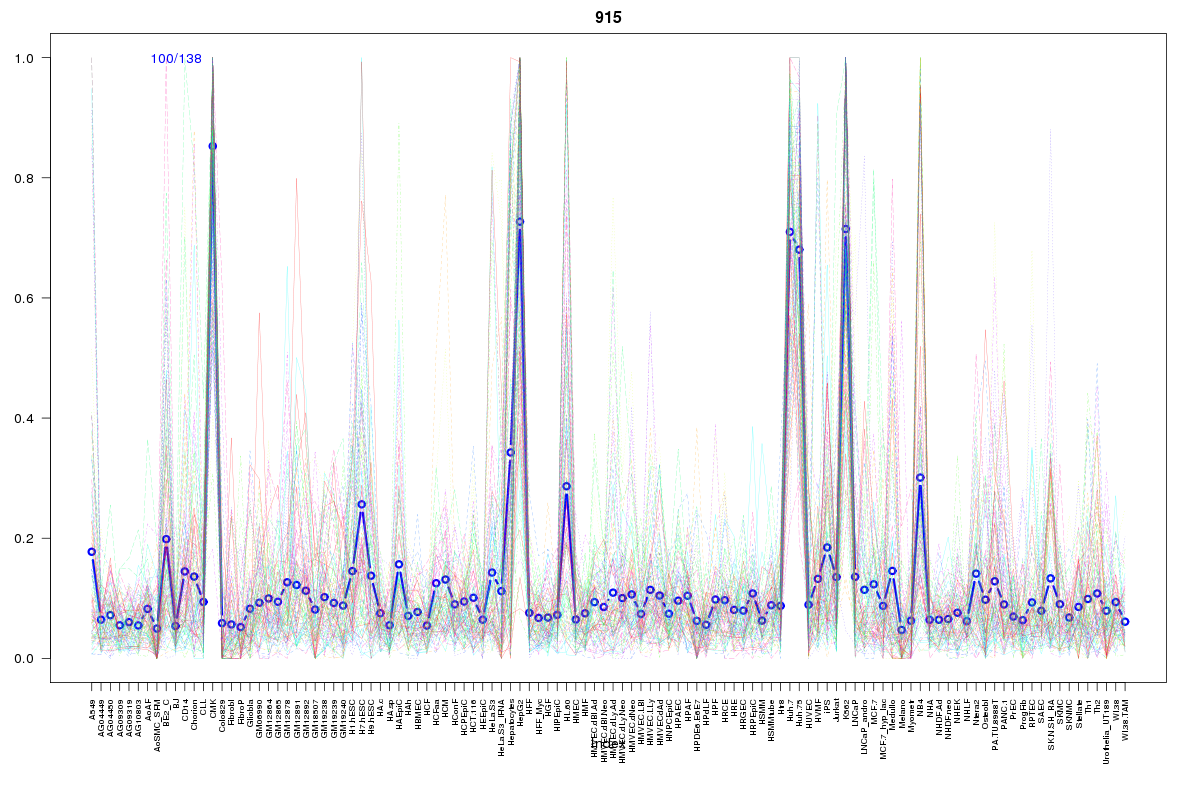 | 915 | 1 |
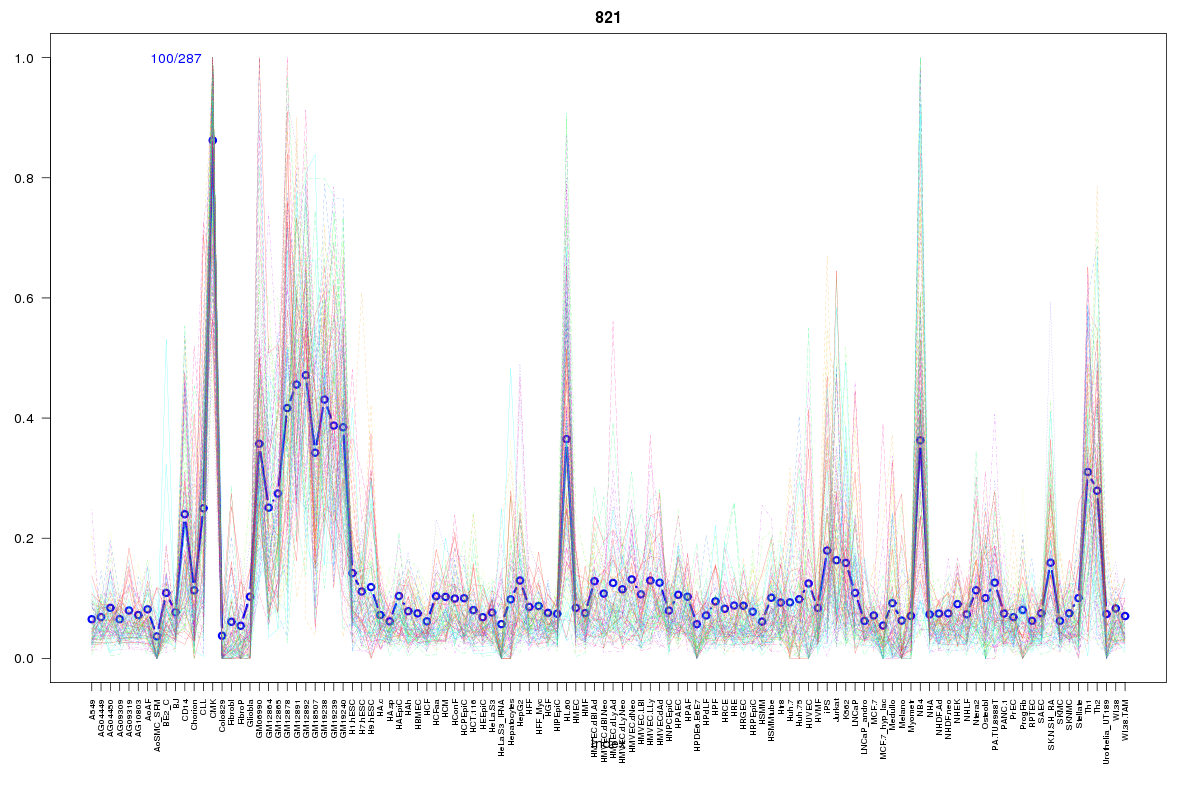 | 821 | 1 |
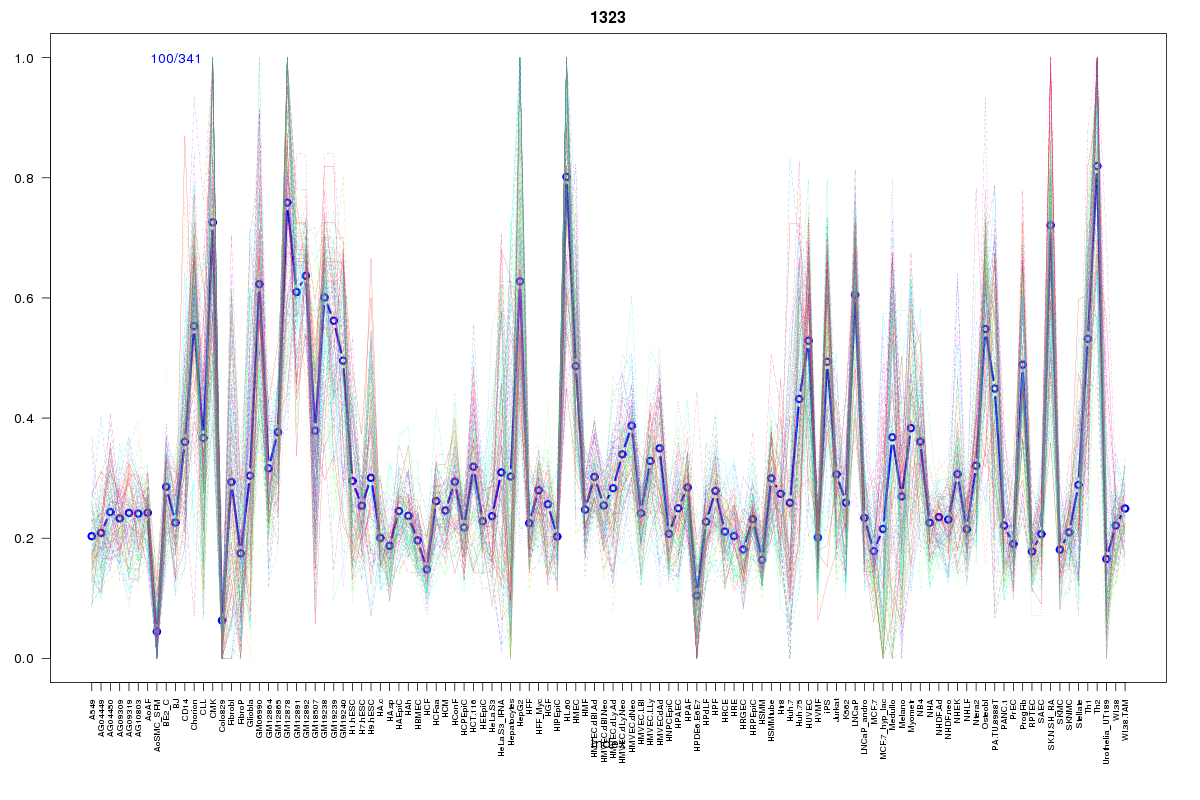 | 1323 | 1 |
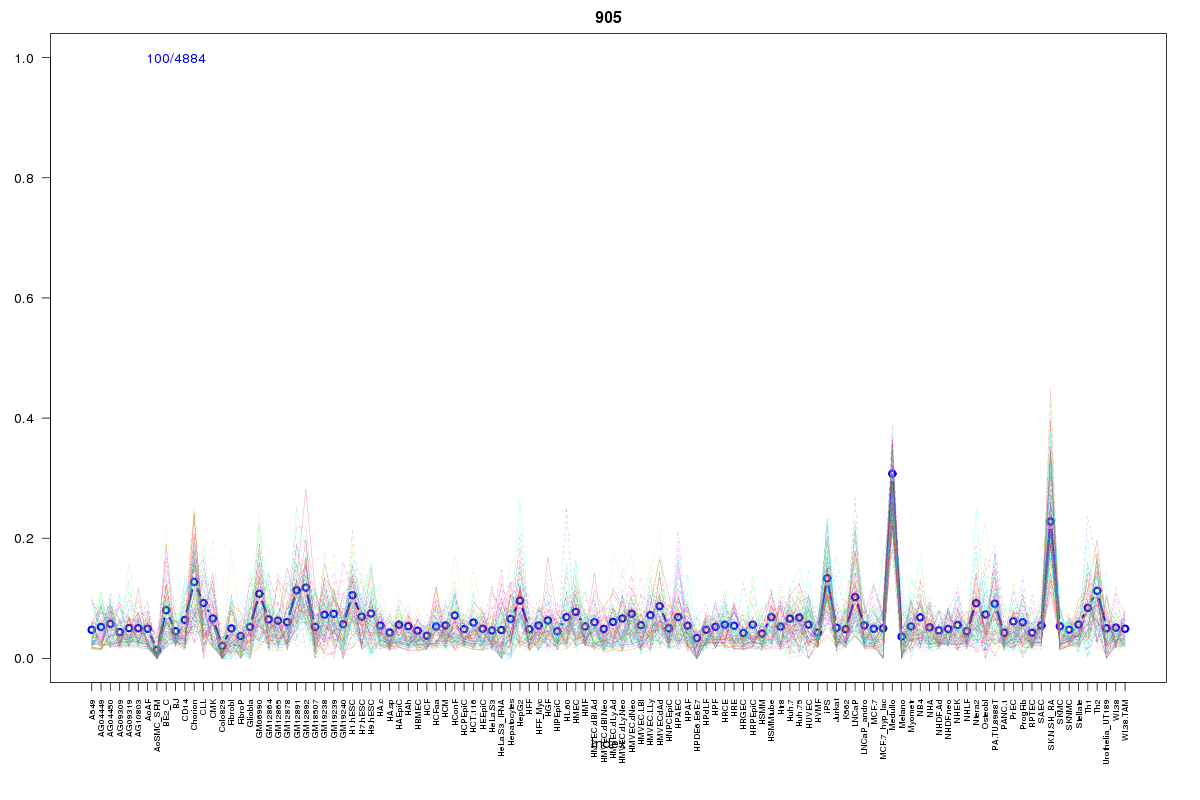 | 905 | 1 |
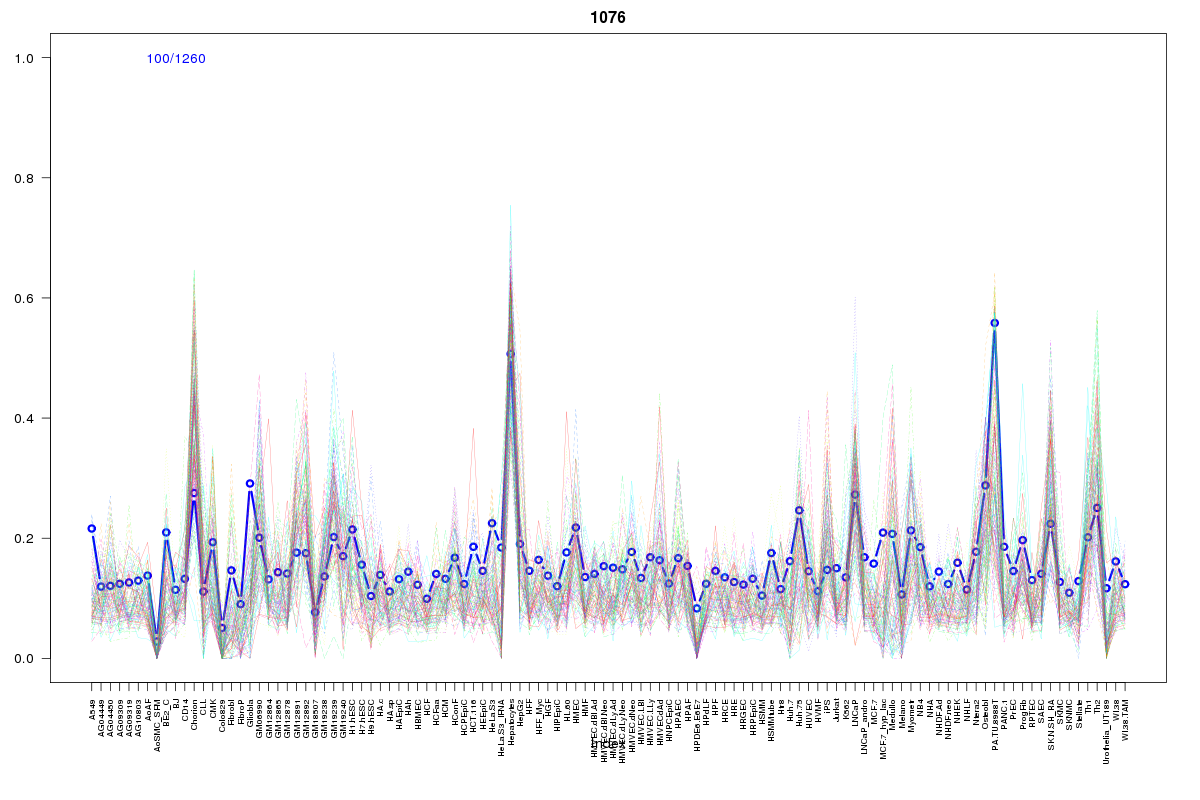 | 1076 | 1 |
 | 1011 | 1 |
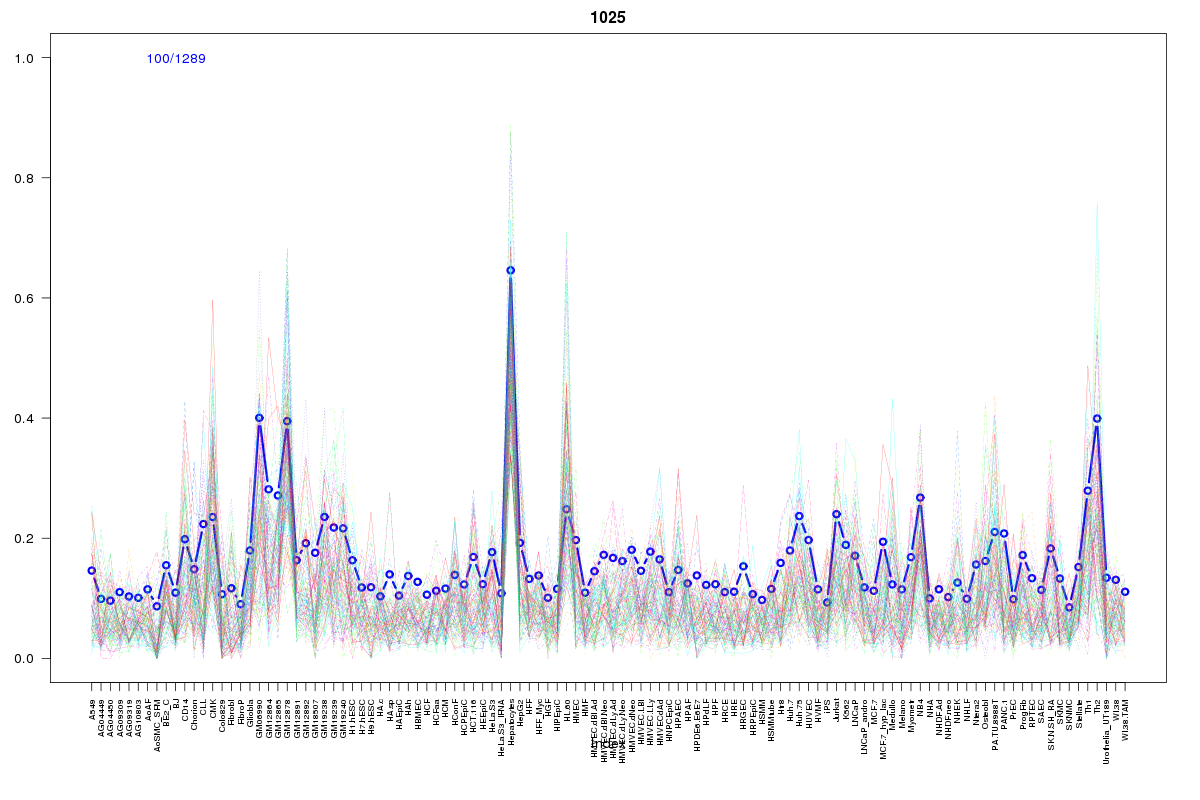 | 1025 | 1 |
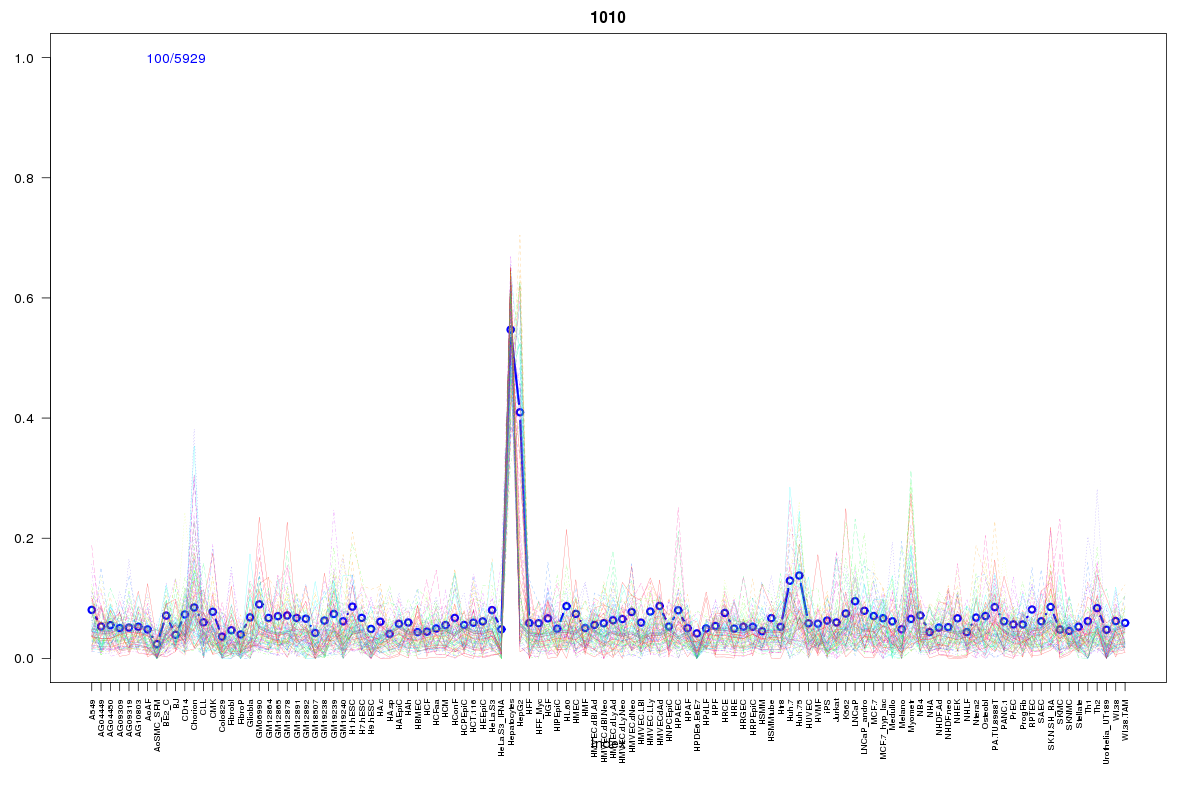 | 1010 | 1 |
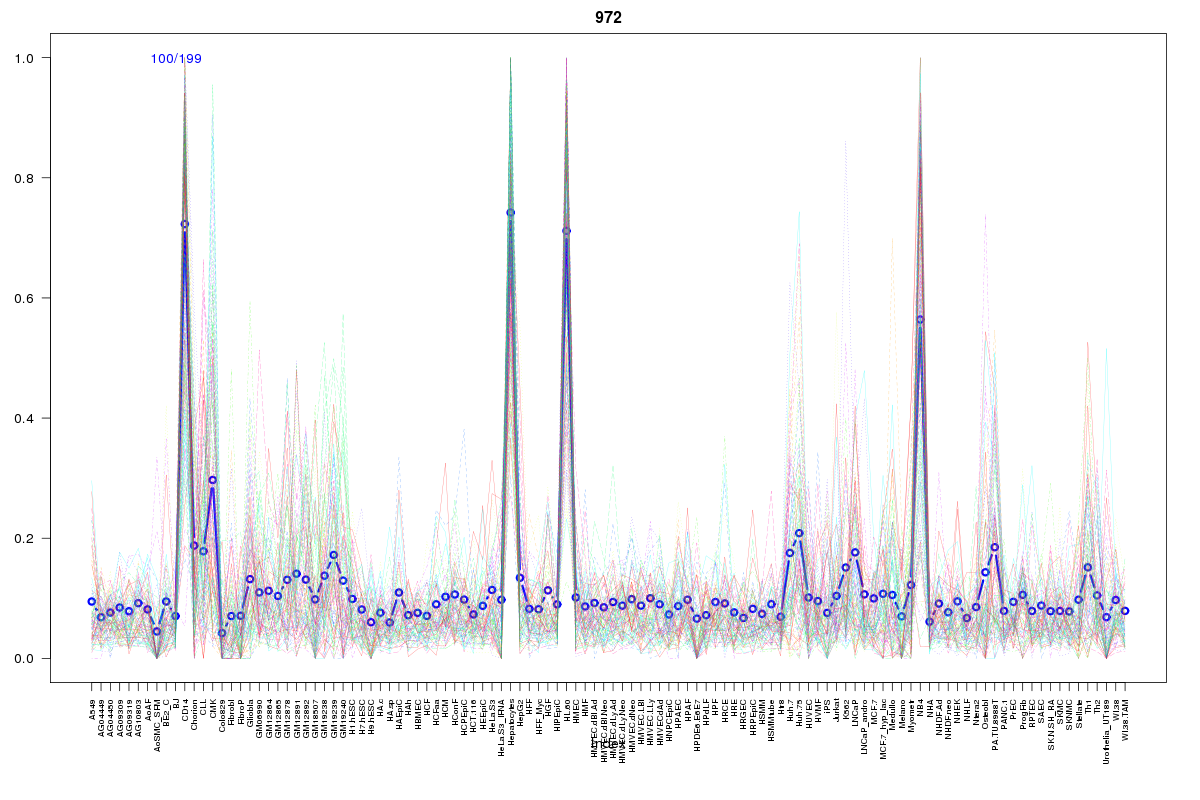 | 972 | 1 |
 | 881 | 1 |
 | 1595 | 1 |
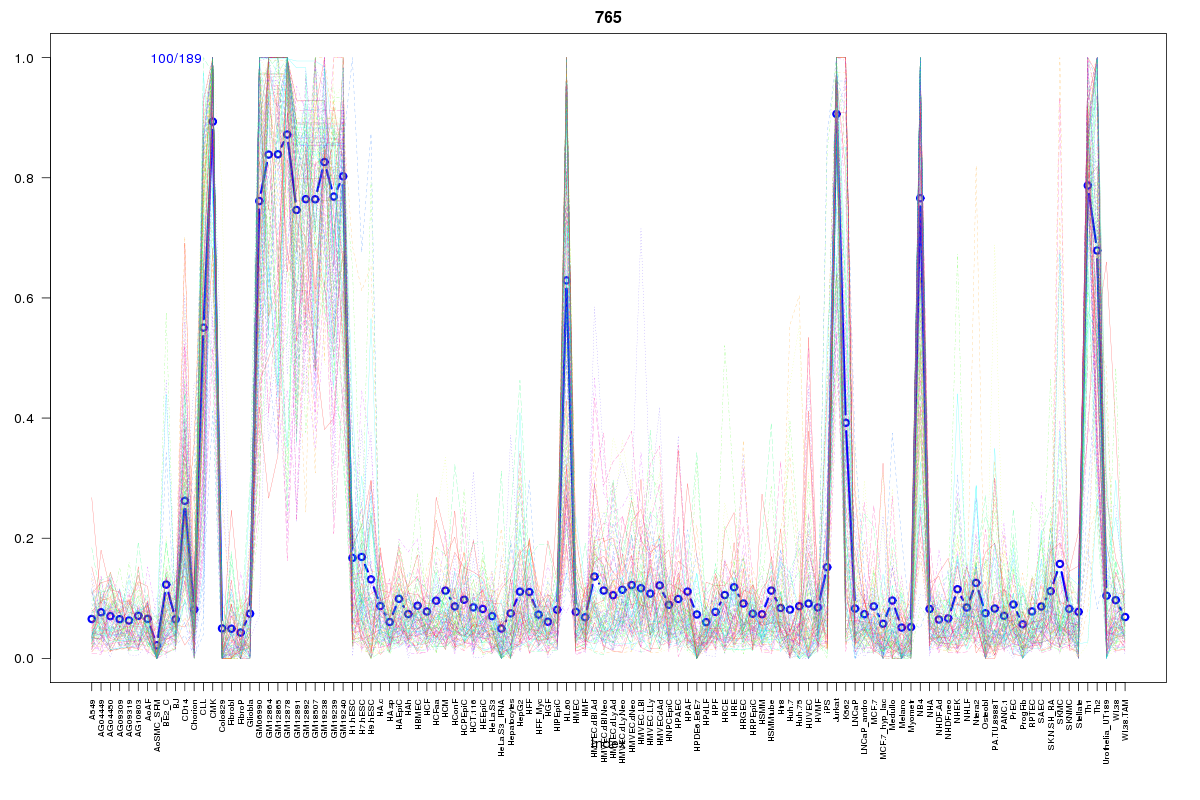 | 765 | 1 |
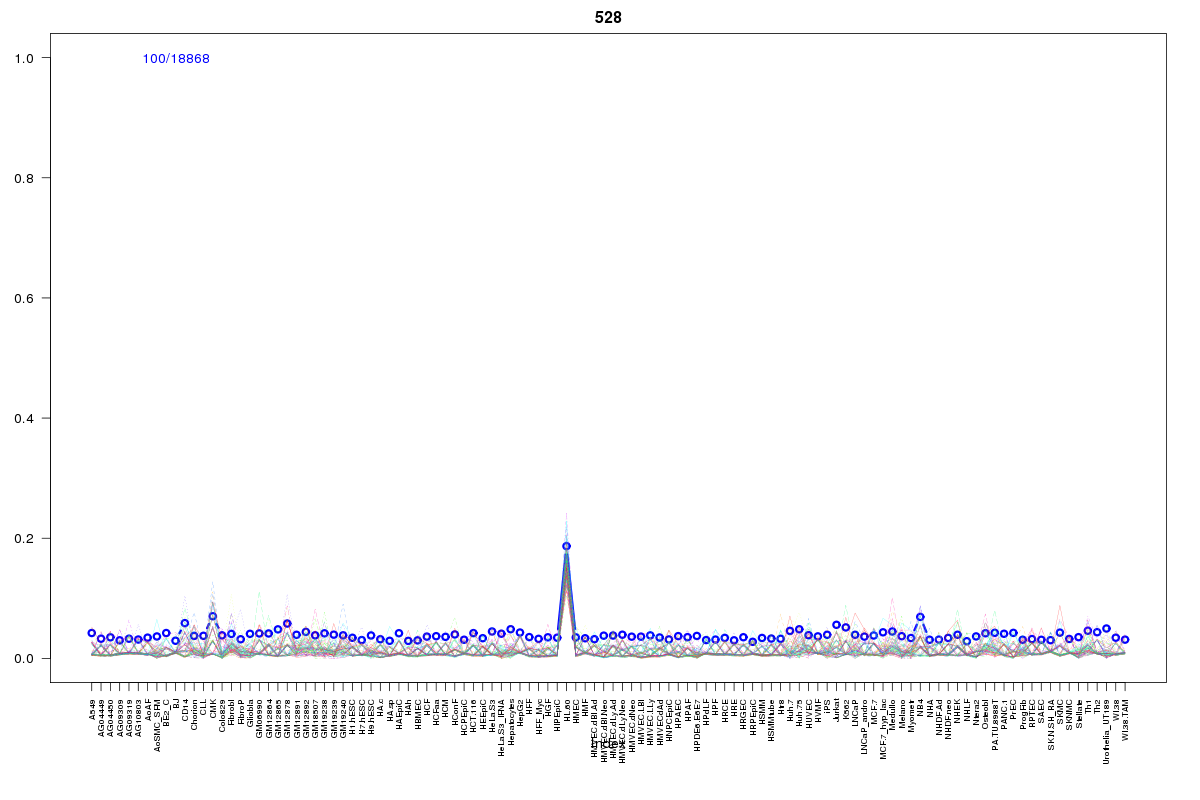 | 528 | 1 |
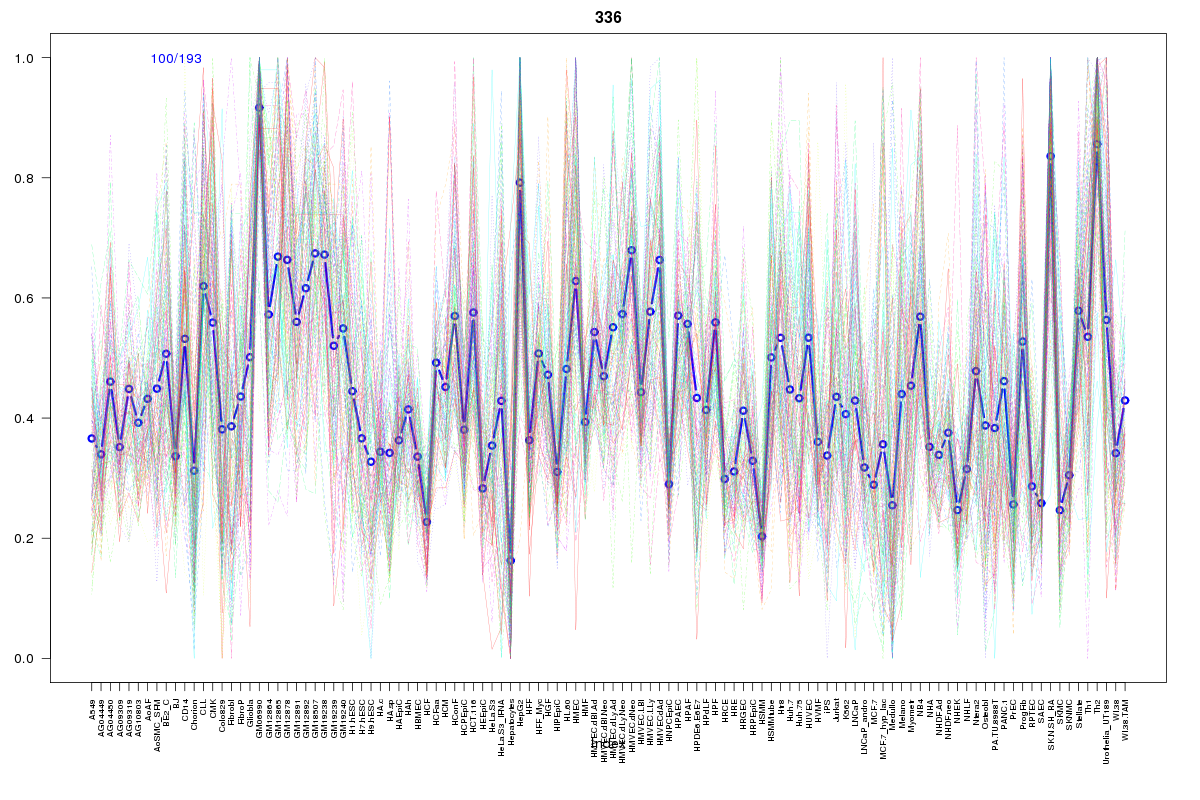 | 336 | 1 |
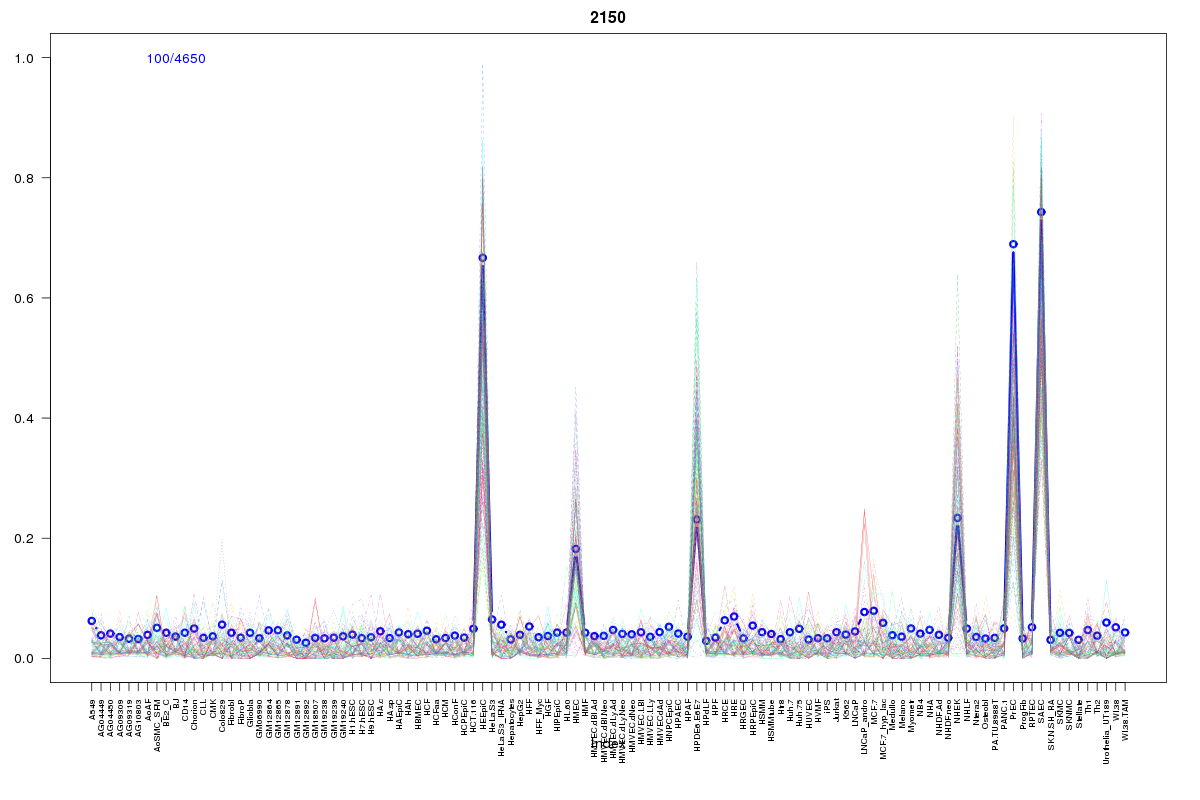 | 2150 | 1 |
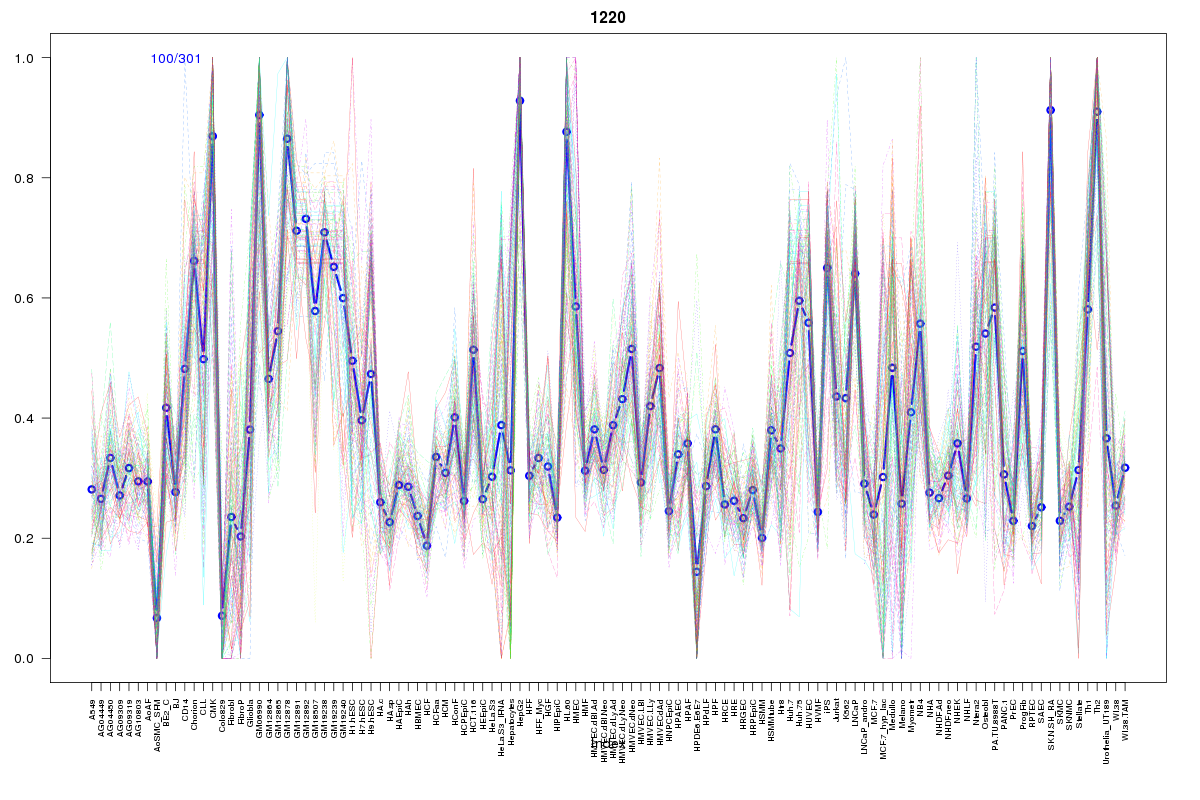 | 1220 | 1 |
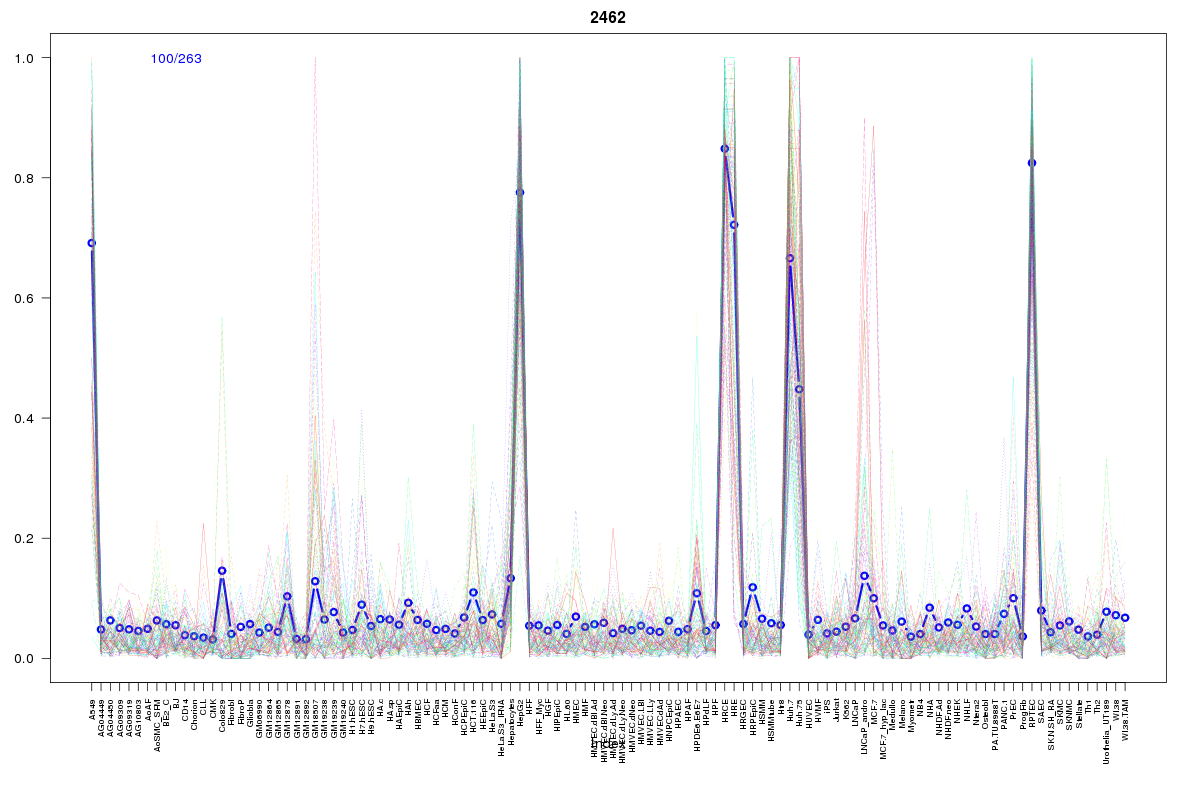 | 2462 | 1 |
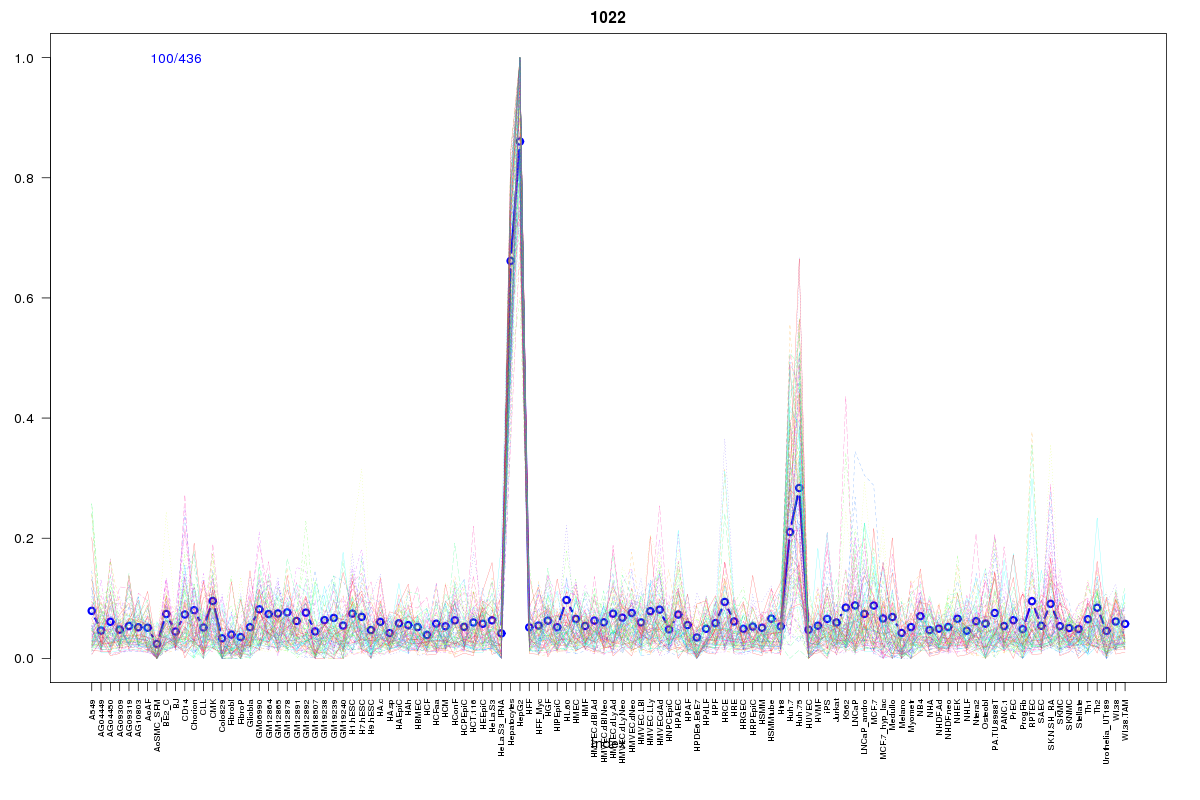 | 1022 | 1 |
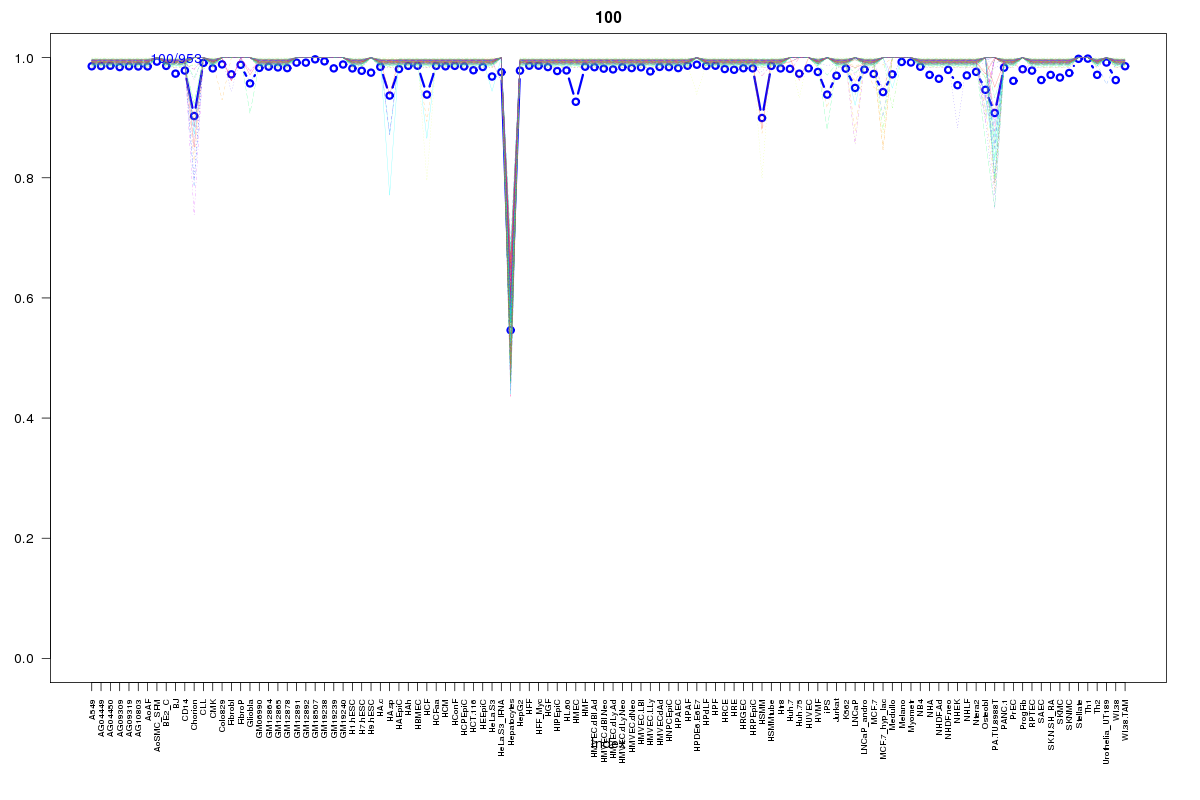 | 100 | 1 |
 | 2122 | 1 |
 | 2072 | 1 |
Resources
BED file downloads
Connects to 40 DHS sitesTop 10 Correlated DHS Sites
p-values indiciate significant higher or lower correlation| Location | Cluster | P-value |
|---|---|---|
| chr3:52323880-52324030 | 1066 | 0 |
| chr3:52272240-52272390 | 1115 | 0 |
| chr3:52245665-52245815 | 1022 | 0 |
| chr3:52324080-52324230 | 1066 | 0 |
| chr3:52322885-52323035 | 1008 | 0.003 |
| chr3:52272405-52272555 | 809 | 0.003 |
| chr3:52358105-52358255 | 759 | 0.003 |
| chr3:52357705-52357855 | 1011 | 0.004 |
| chr3:52413445-52413595 | 881 | 0.004 |
| chr3:52270480-52270630 | 1355 | 0.004 |
| chr3:52272585-52272735 | 824 | 0.006 |
External Databases
UCSCEnsembl (ENSG00000168237)