Gene: AKT1S1
chr19: 50372294-50378542Expression Profile
(log scale)
Graphical Connections
Distribution of linked clusters:
You may find it interesting if many of the connected DHS sites belong to the same cluster.| Cluster Profile | Cluster ID | Number of DHS sites in this cluster |
|---|---|---|
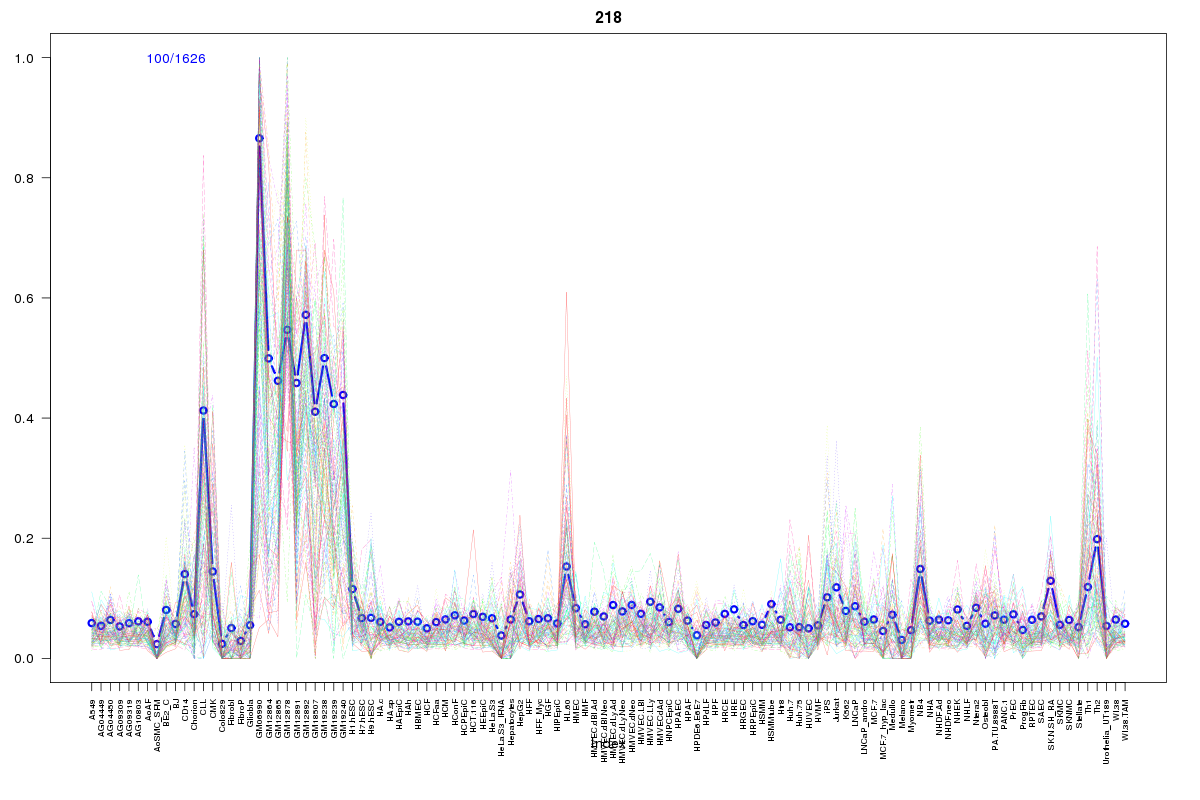 | 218 | 7 |
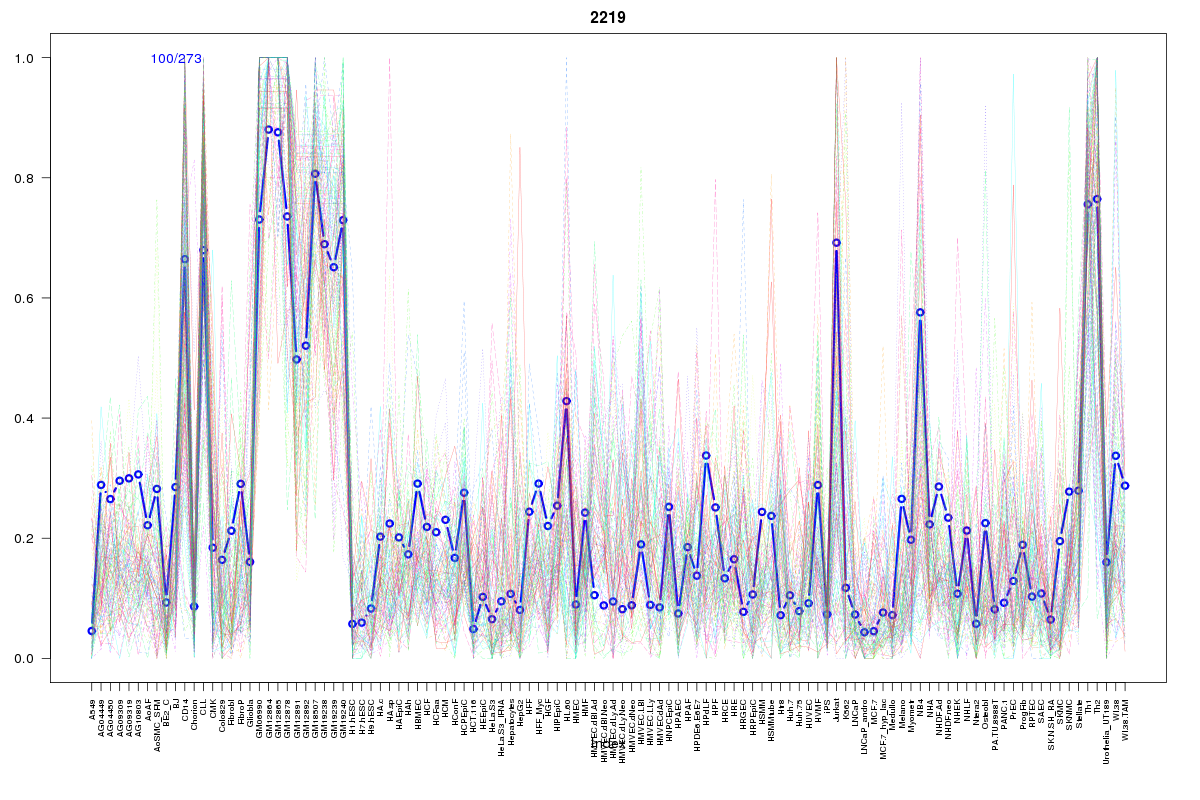 | 2219 | 3 |
 | 430 | 2 |
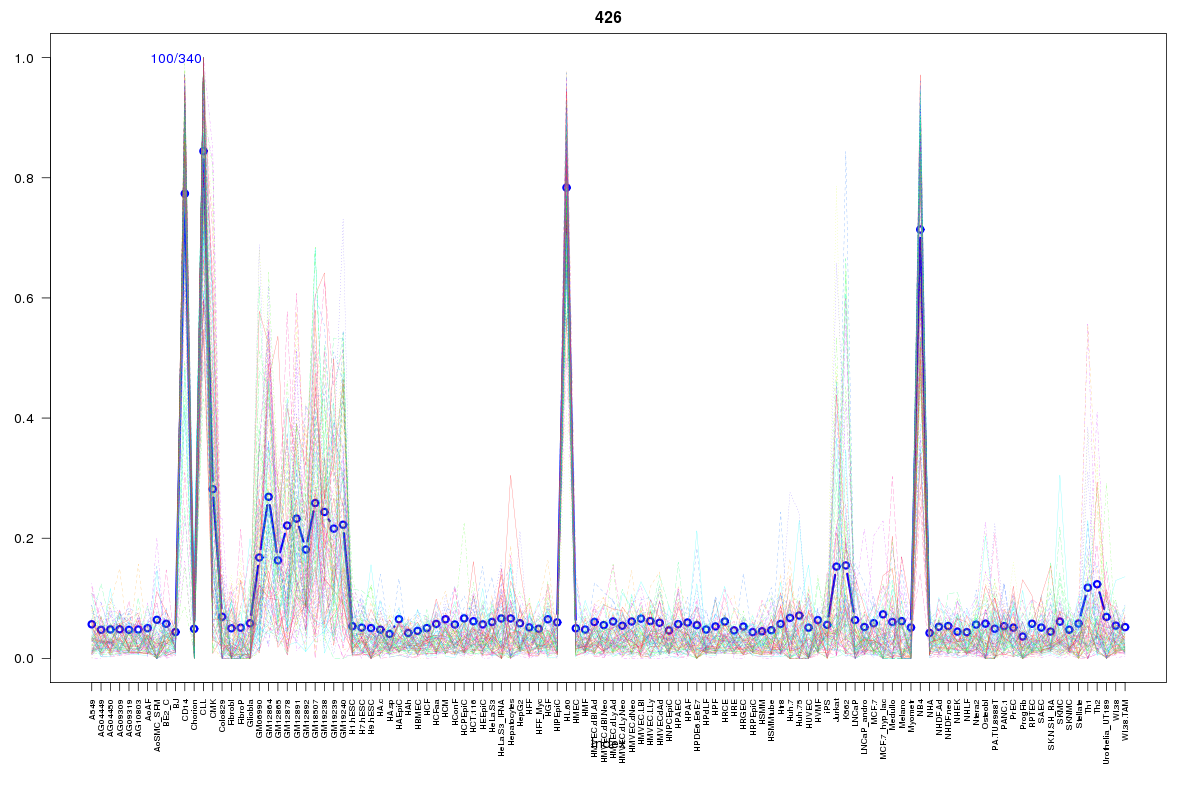 | 426 | 2 |
 | 2122 | 2 |
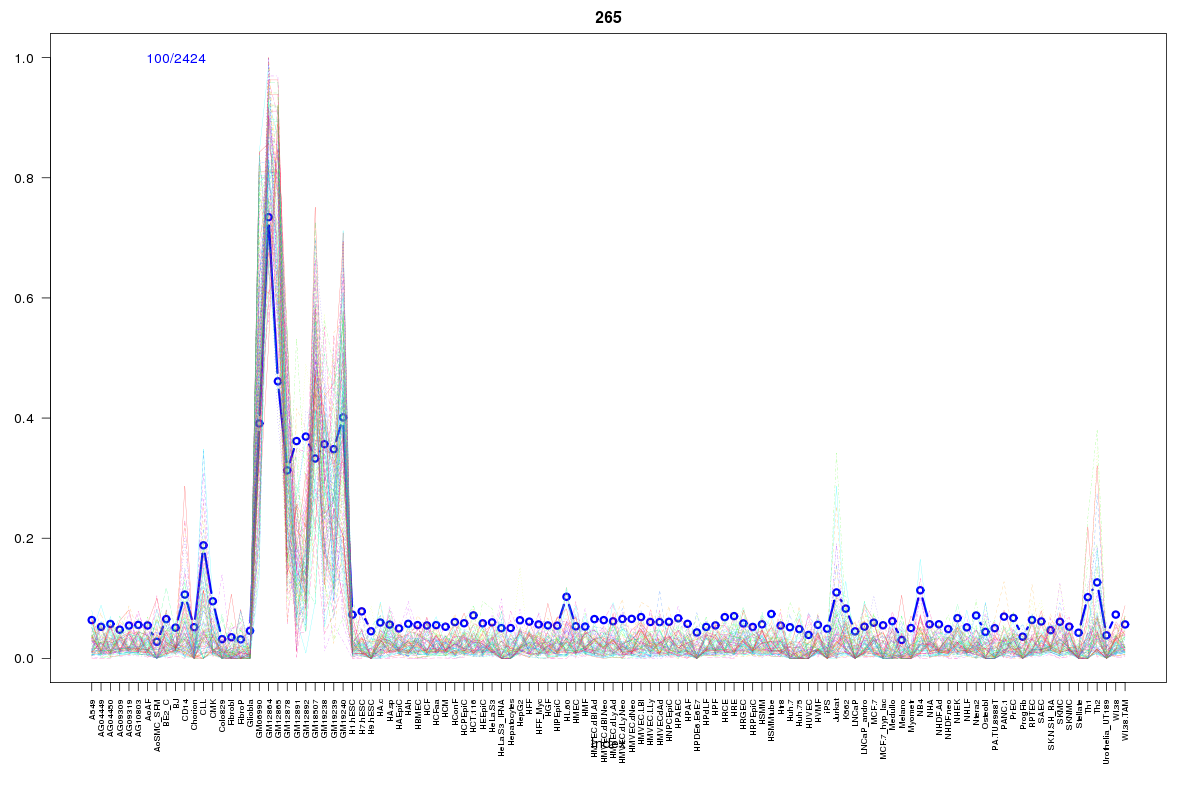 | 265 | 1 |
 | 1008 | 1 |
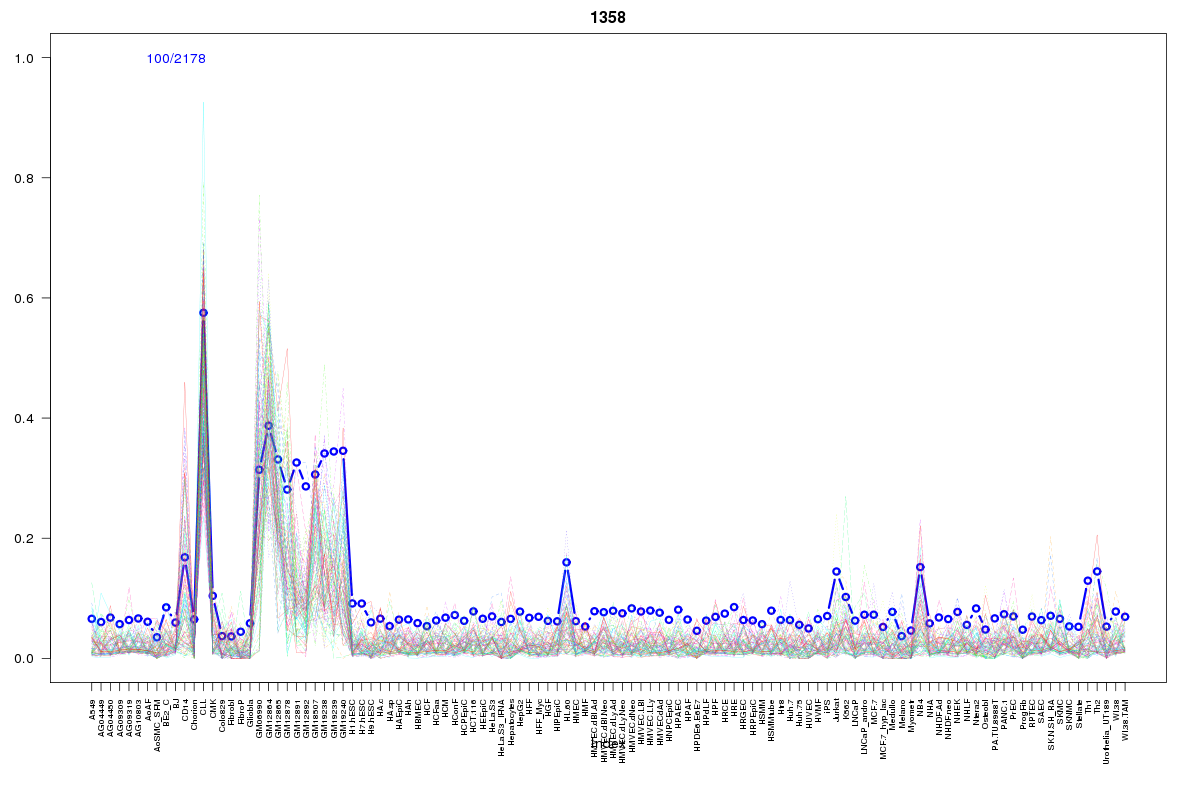 | 1358 | 1 |
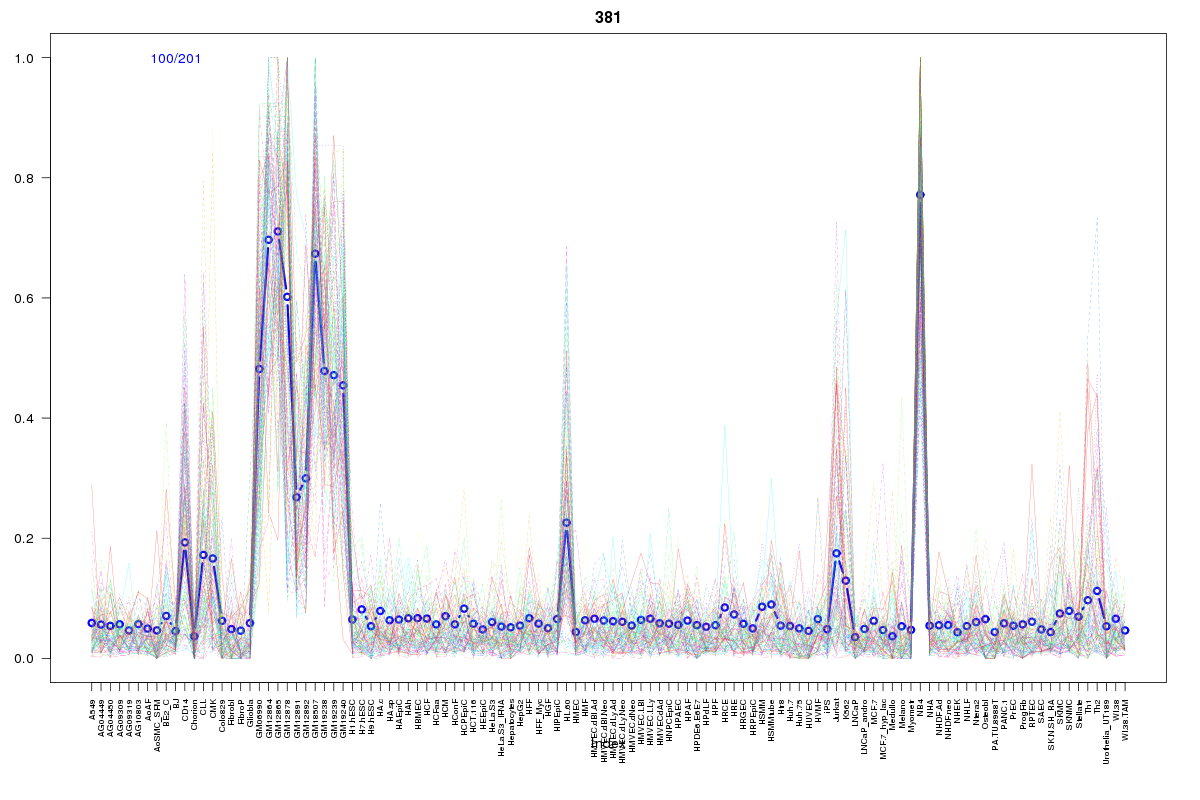 | 381 | 1 |
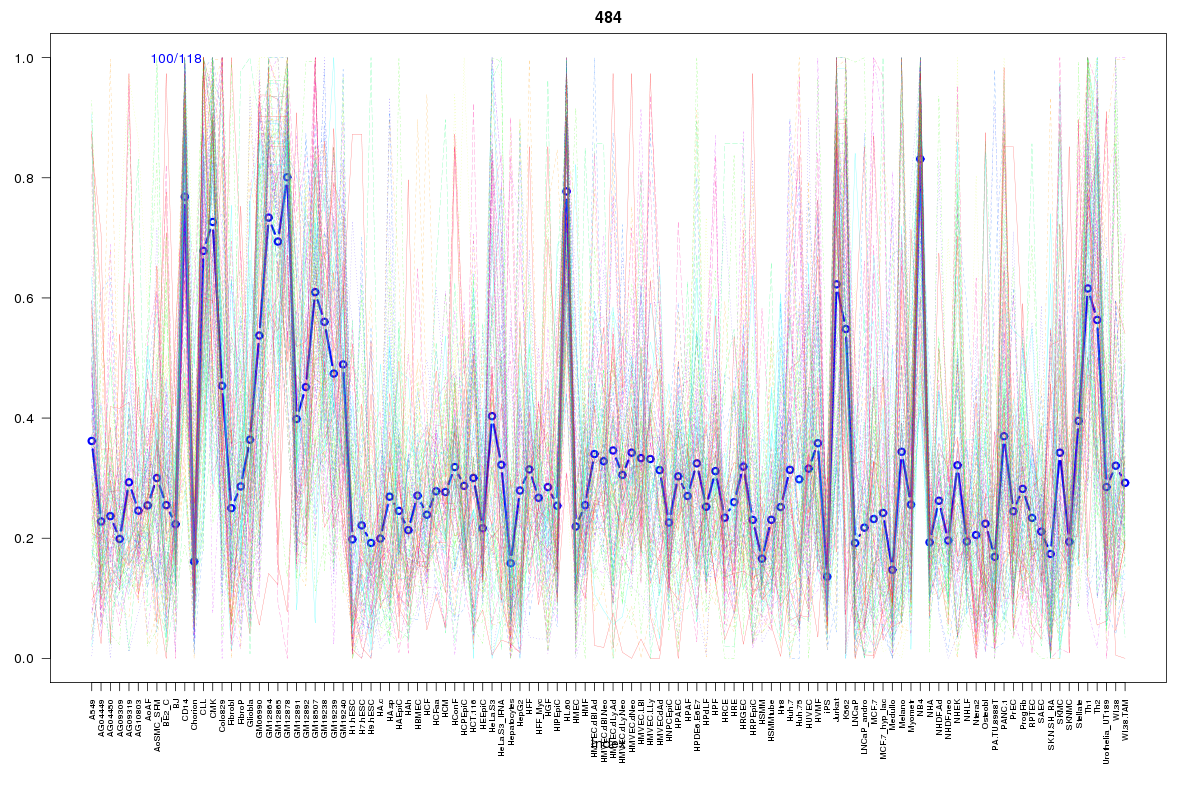 | 484 | 1 |
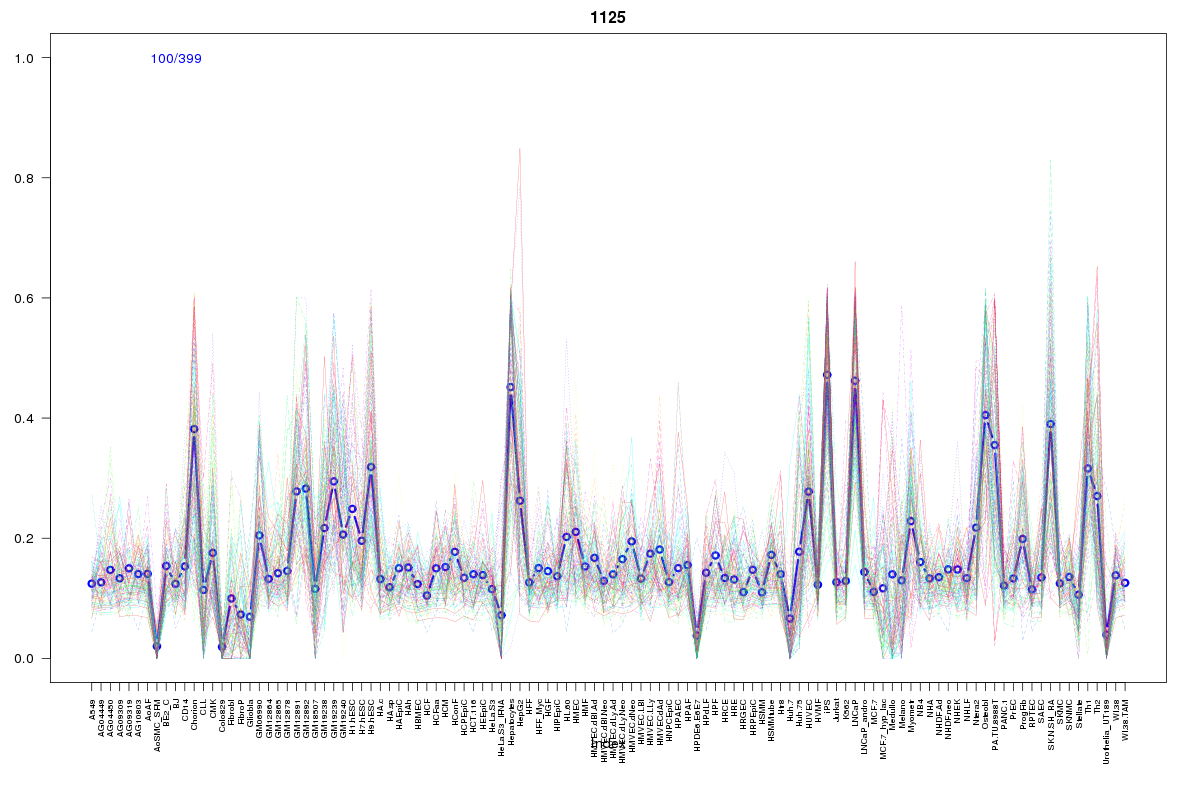 | 1125 | 1 |
 | 2055 | 1 |
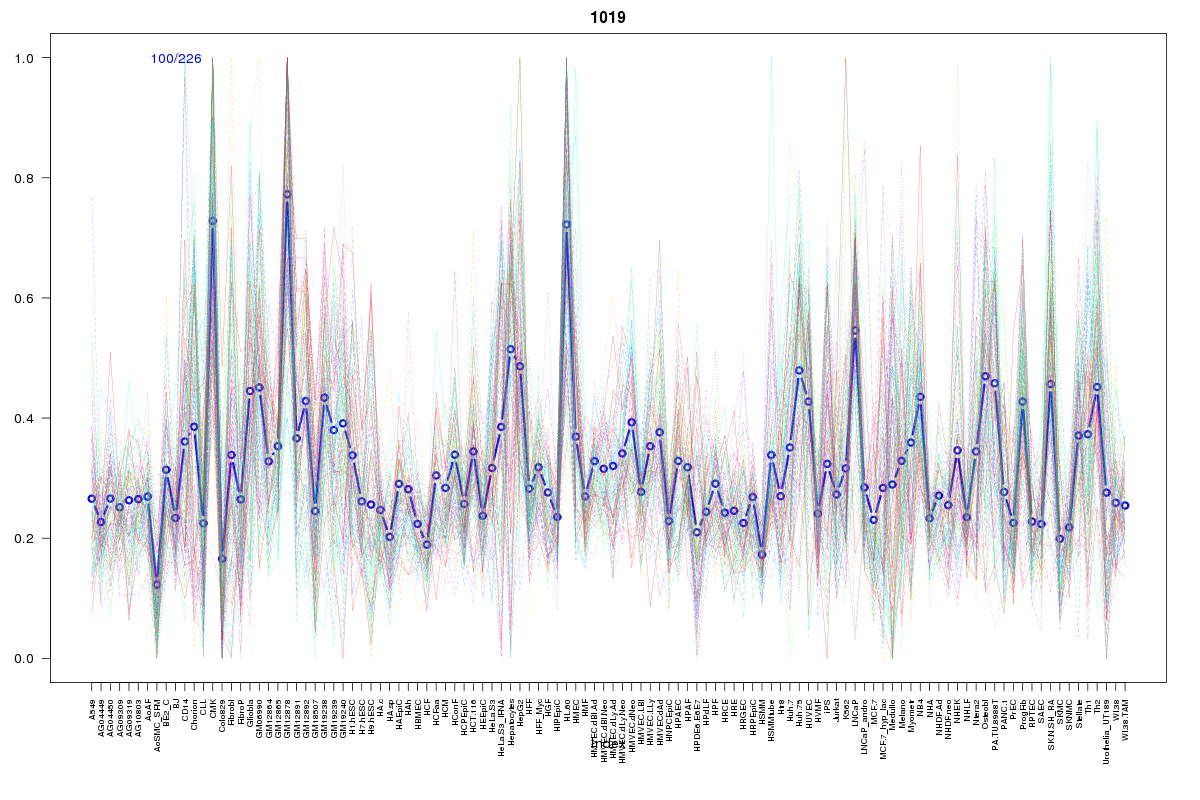 | 1019 | 1 |
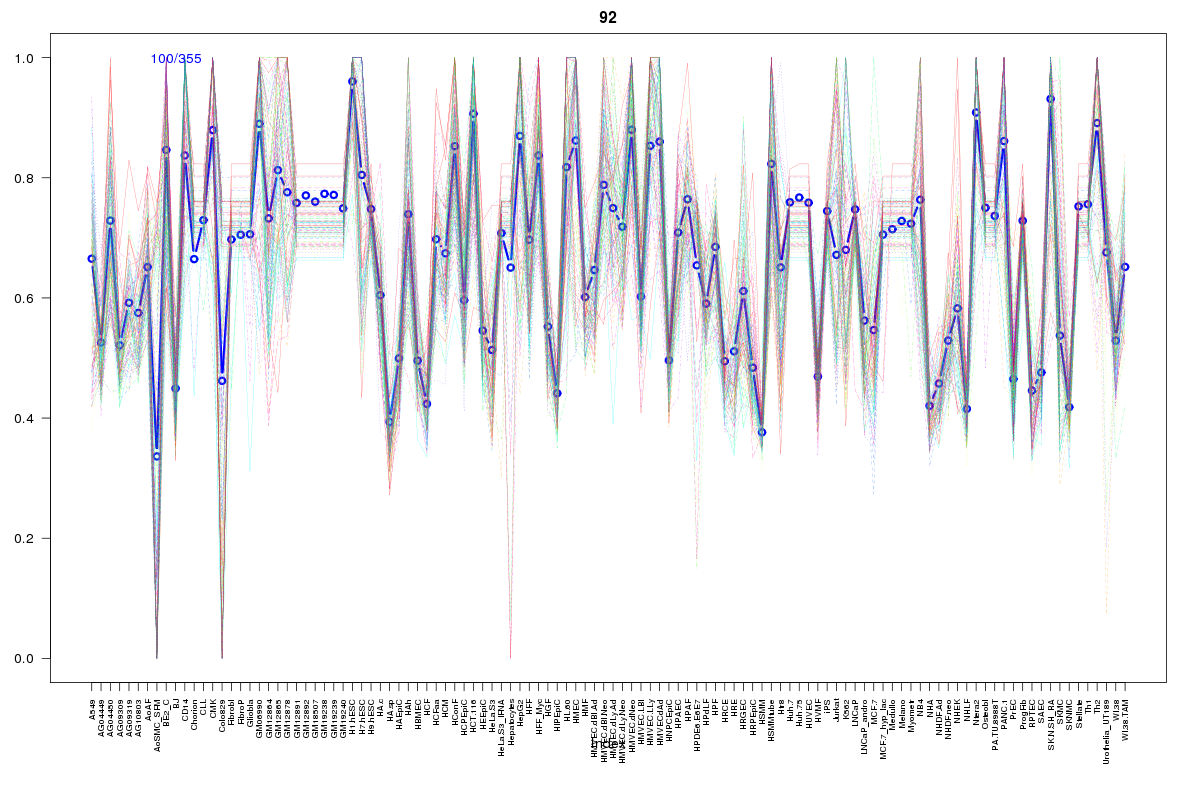 | 92 | 1 |
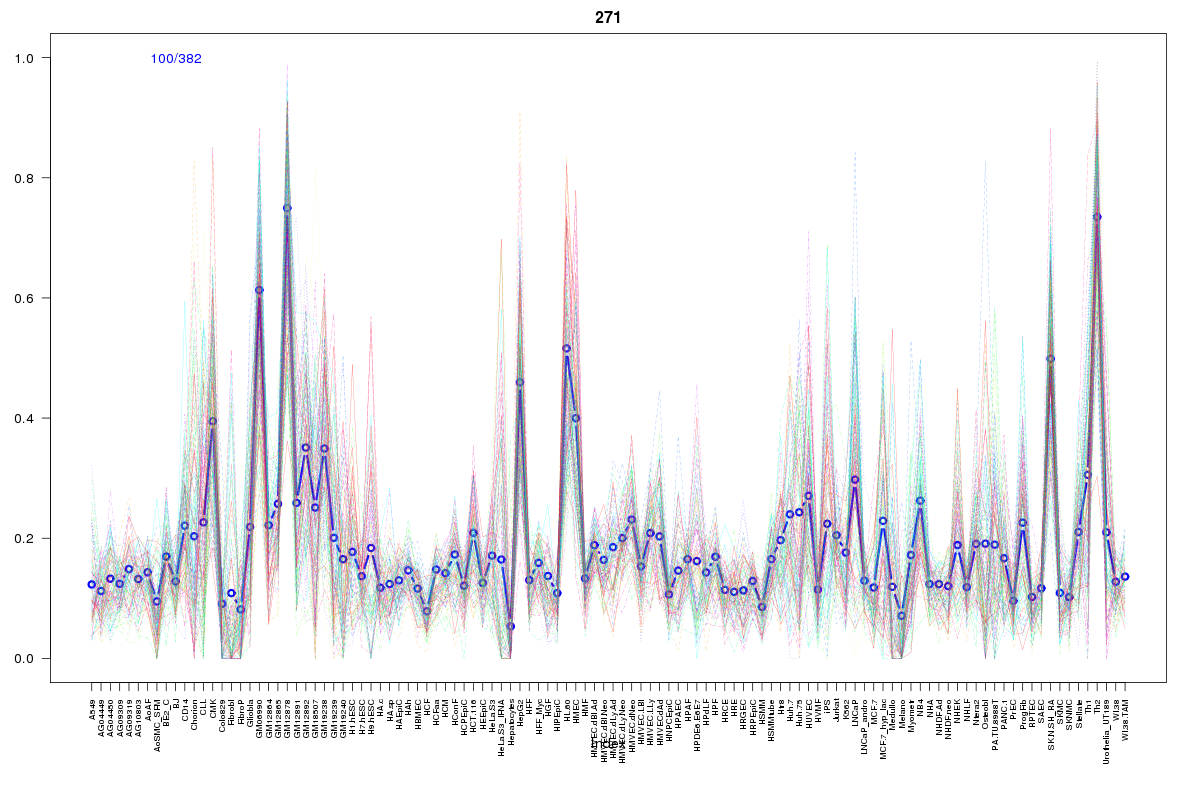 | 271 | 1 |
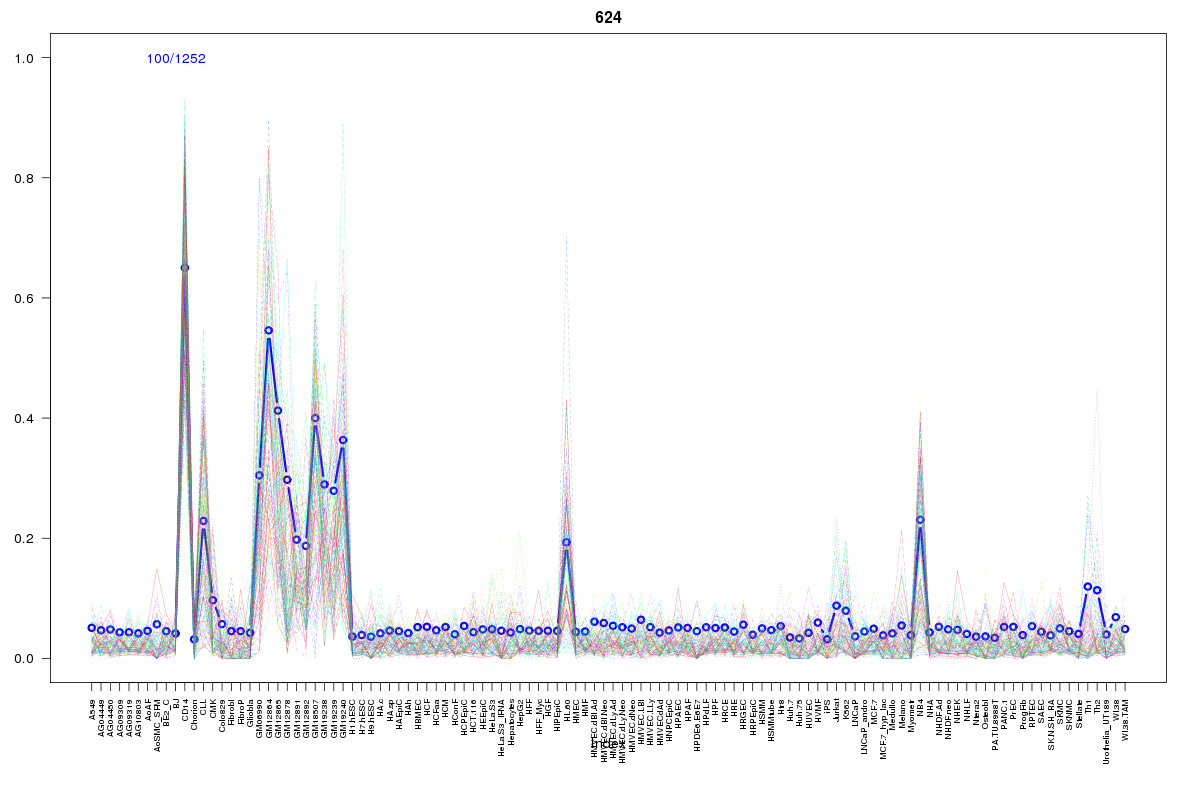 | 624 | 1 |
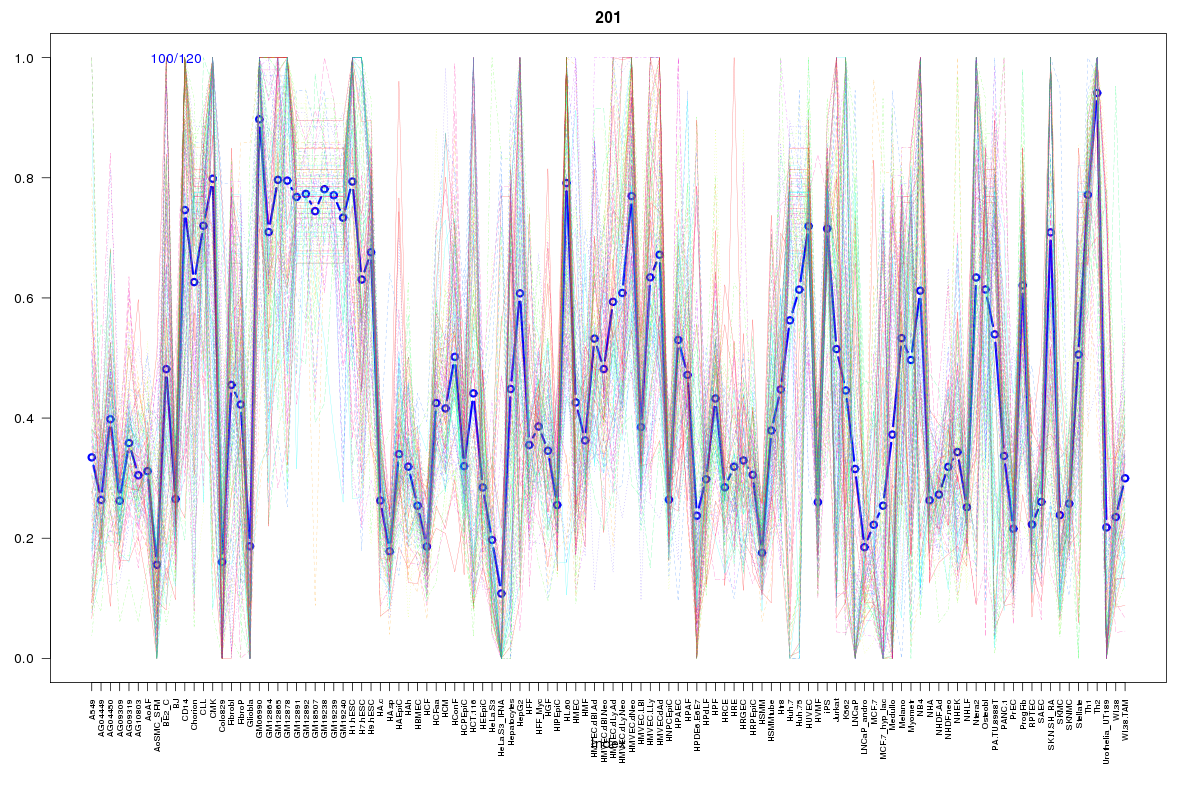 | 201 | 1 |
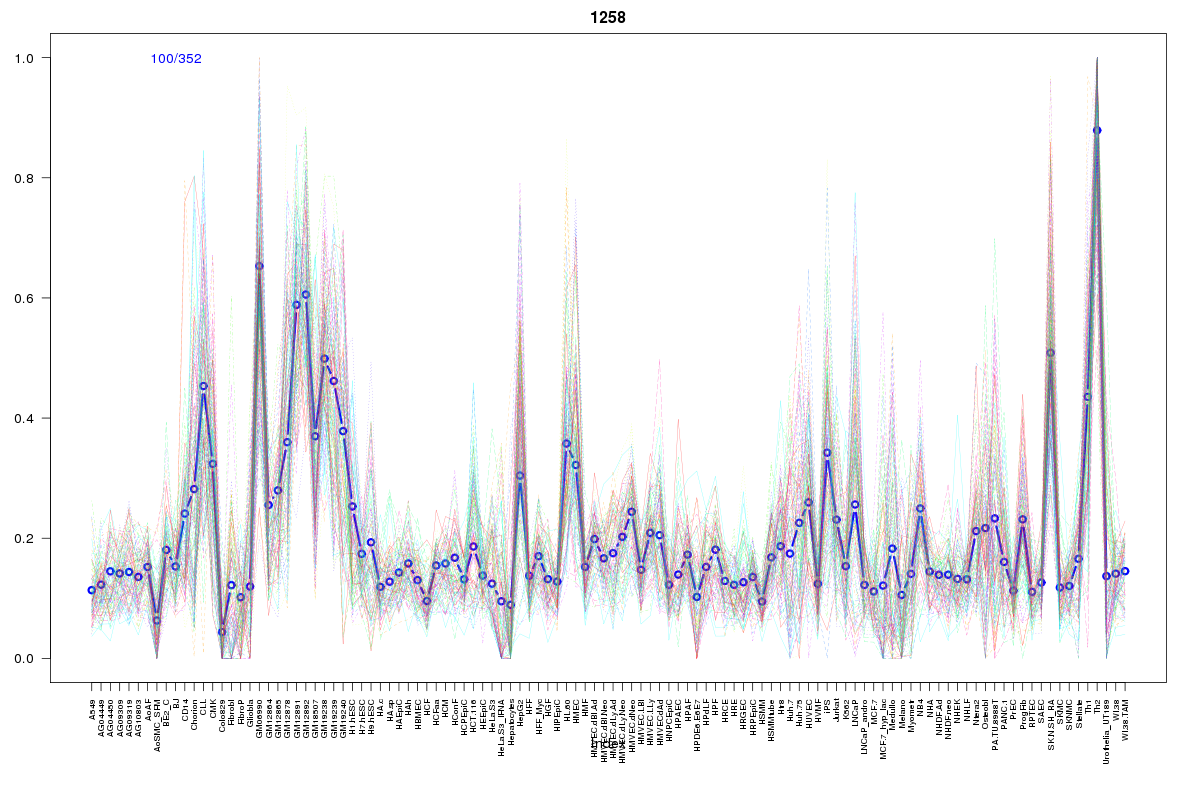 | 1258 | 1 |
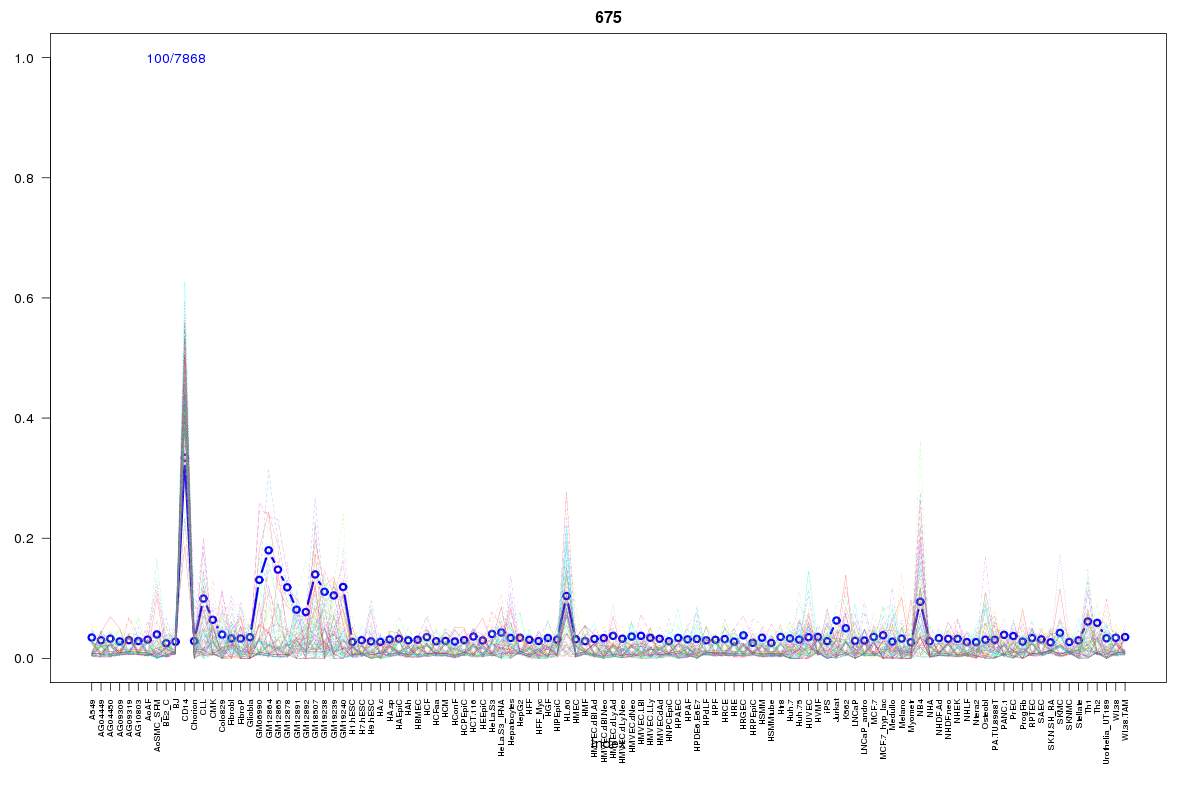 | 675 | 1 |
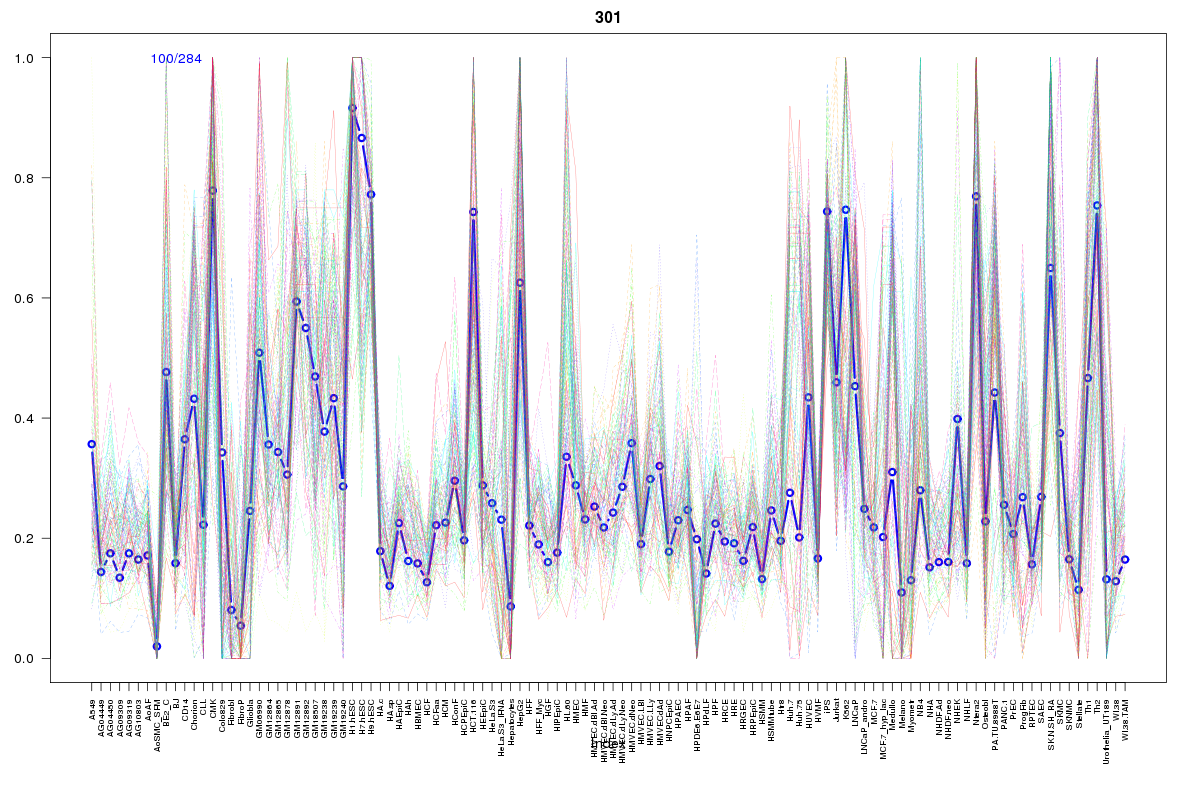 | 301 | 1 |
 | 327 | 1 |
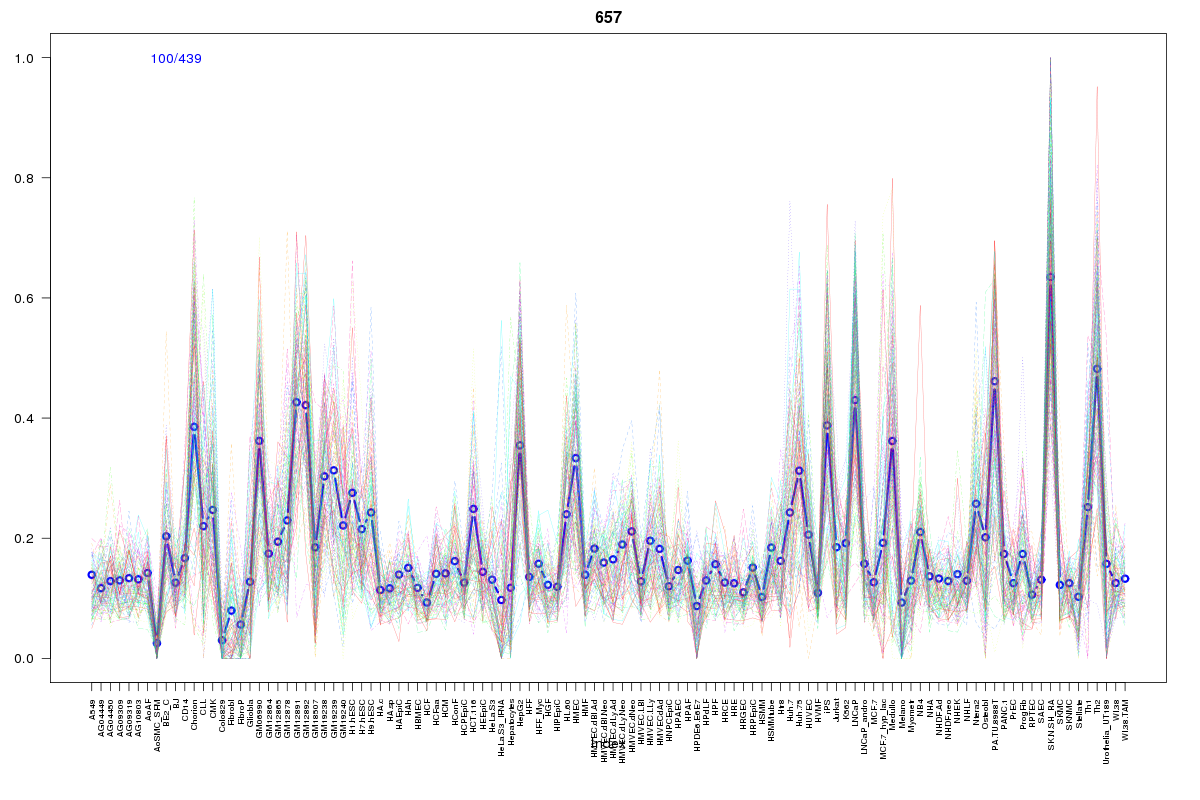 | 657 | 1 |
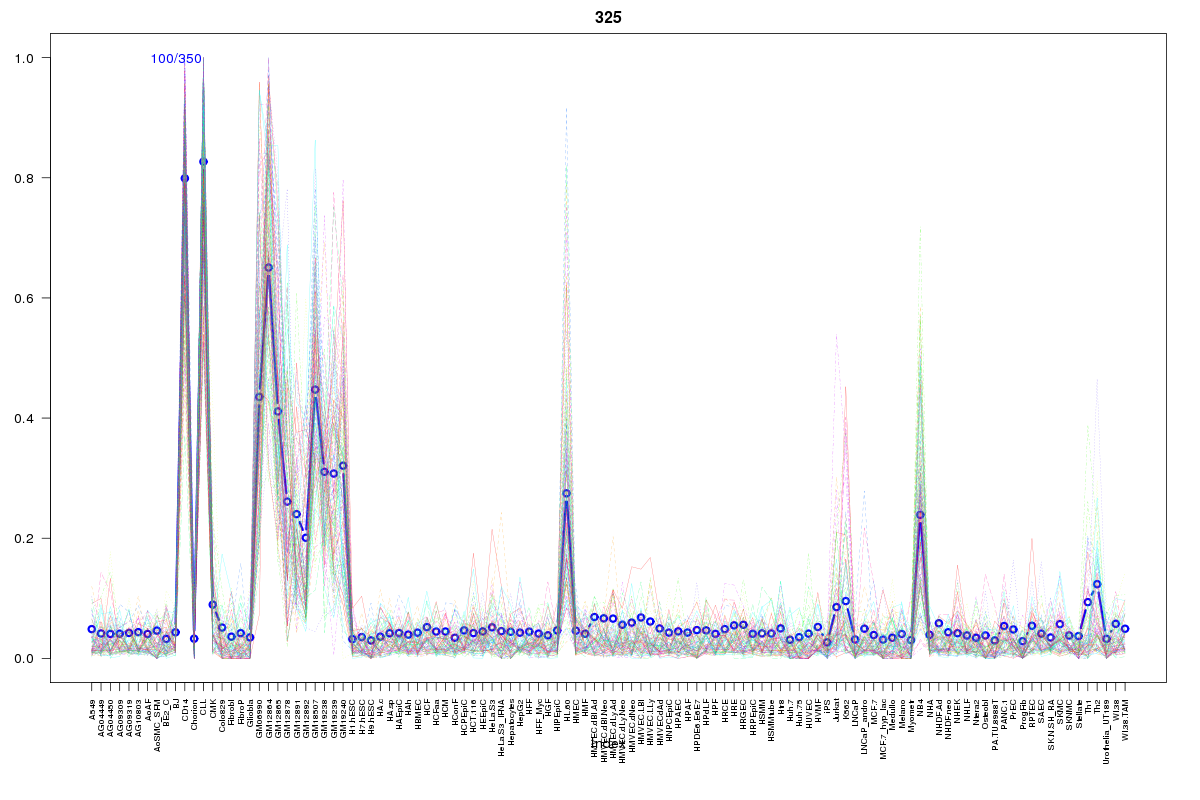 | 325 | 1 |
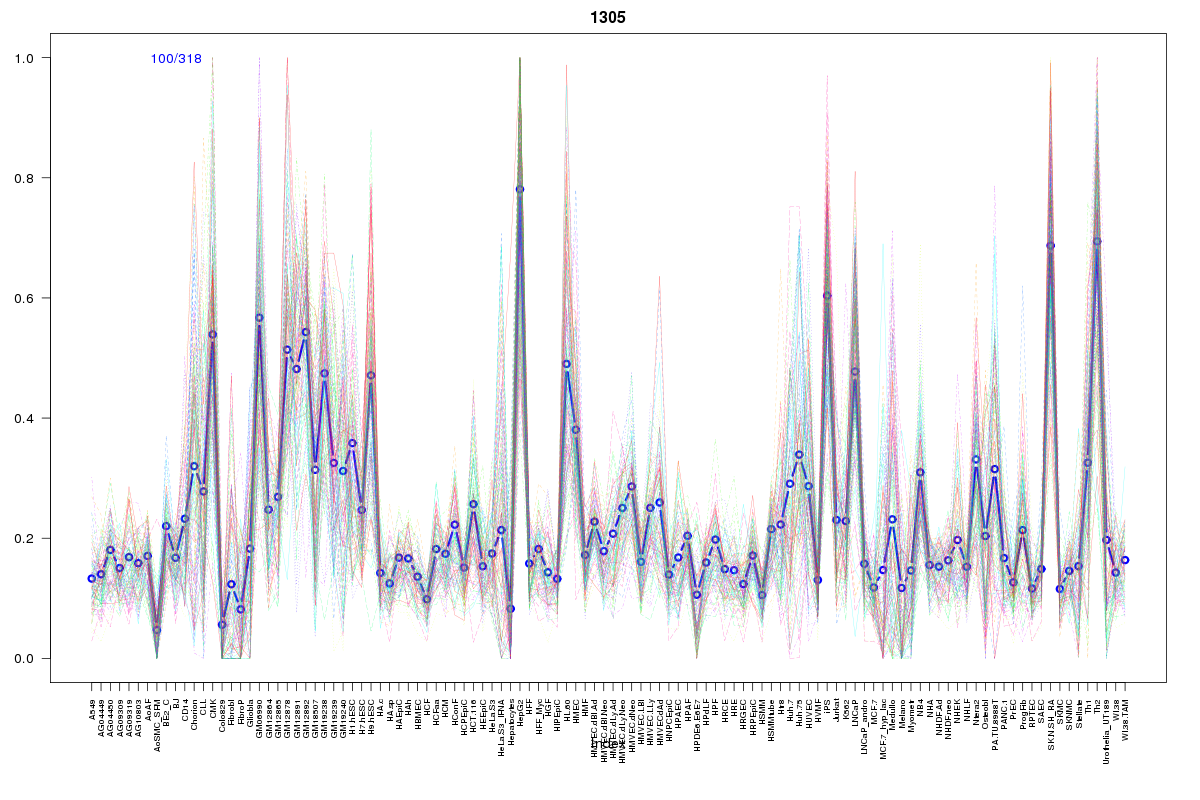 | 1305 | 1 |
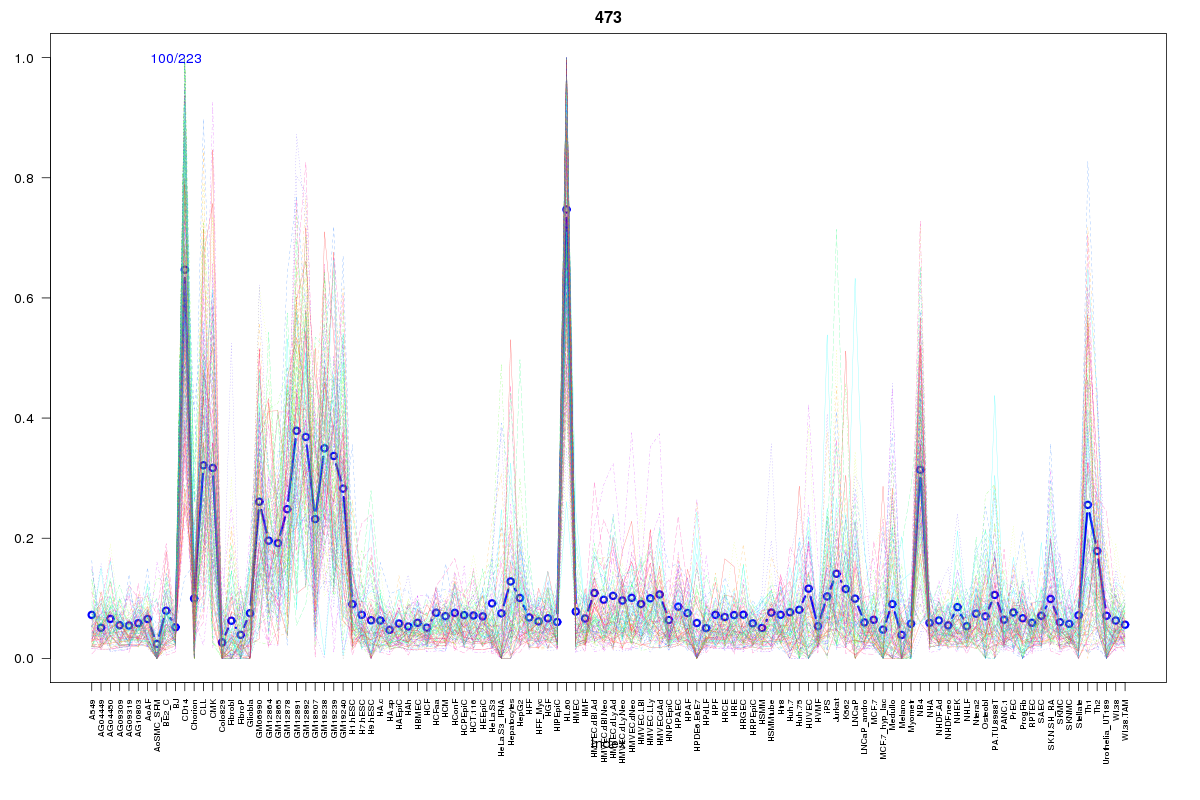 | 473 | 1 |
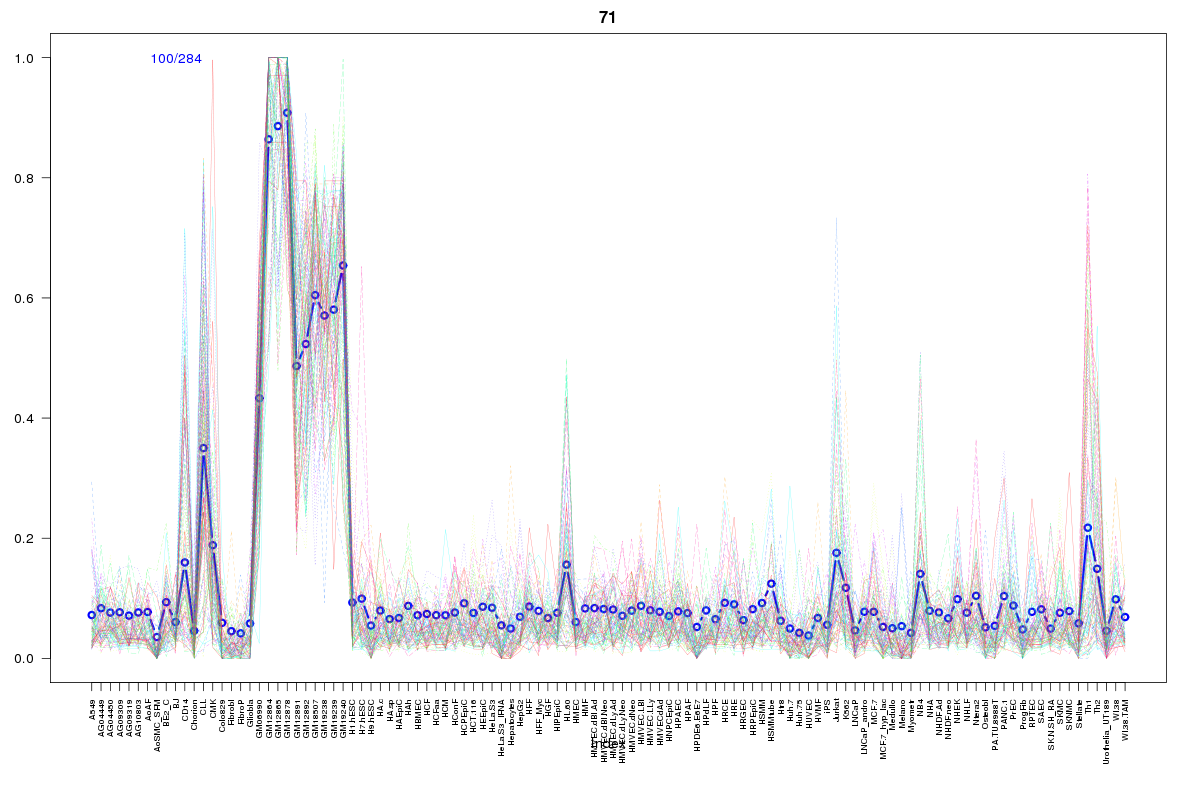 | 71 | 1 |
 | 77 | 1 |
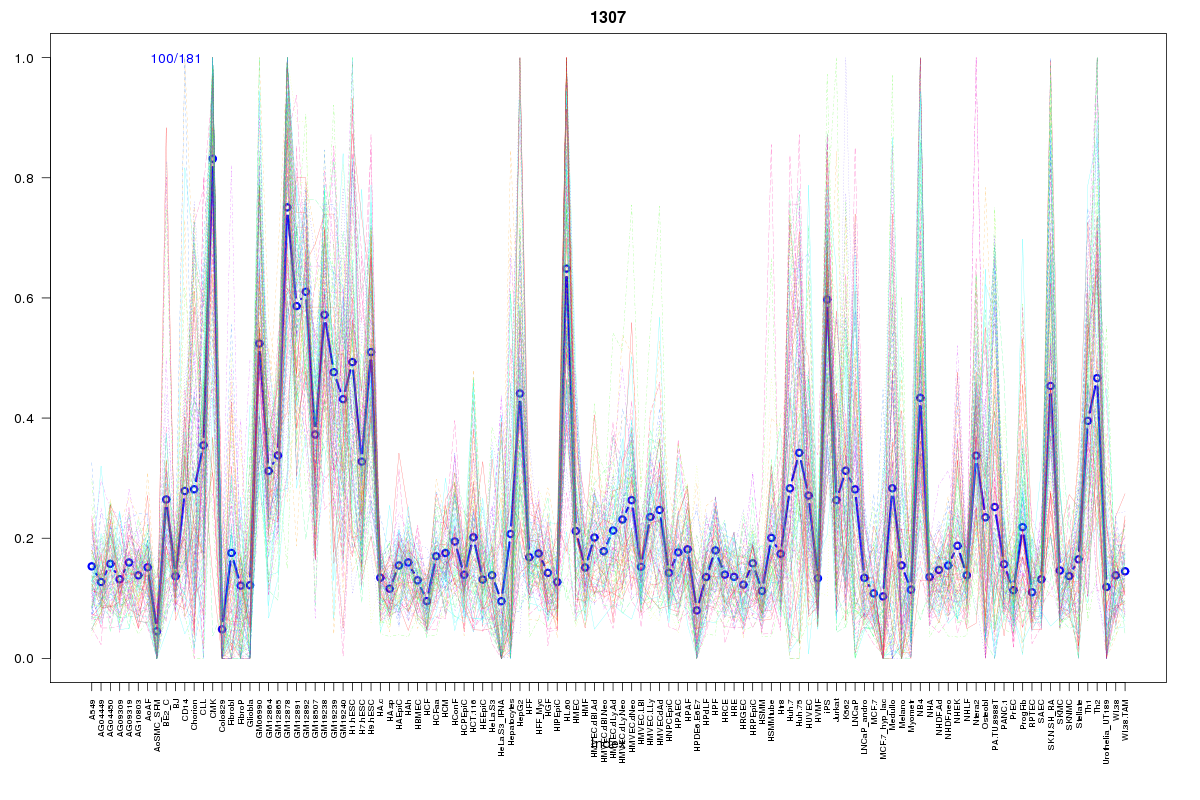 | 1307 | 1 |
 | 570 | 1 |
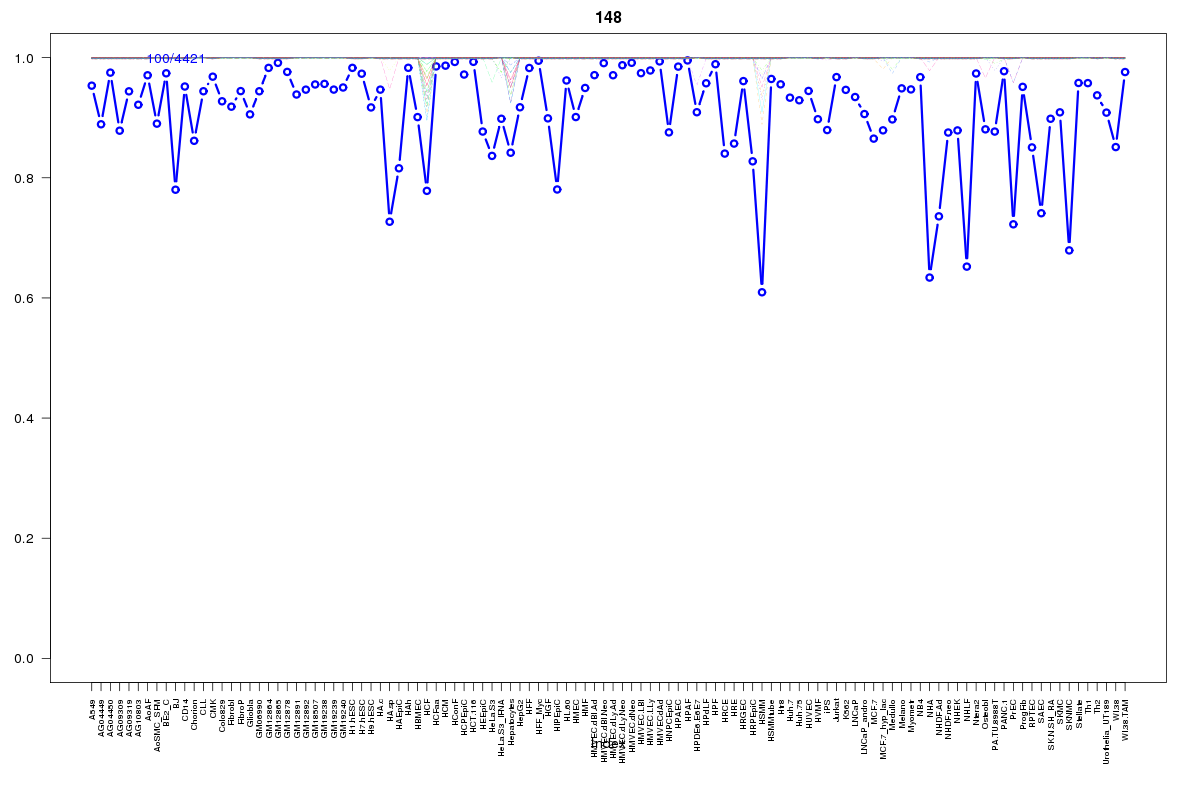 | 148 | 1 |
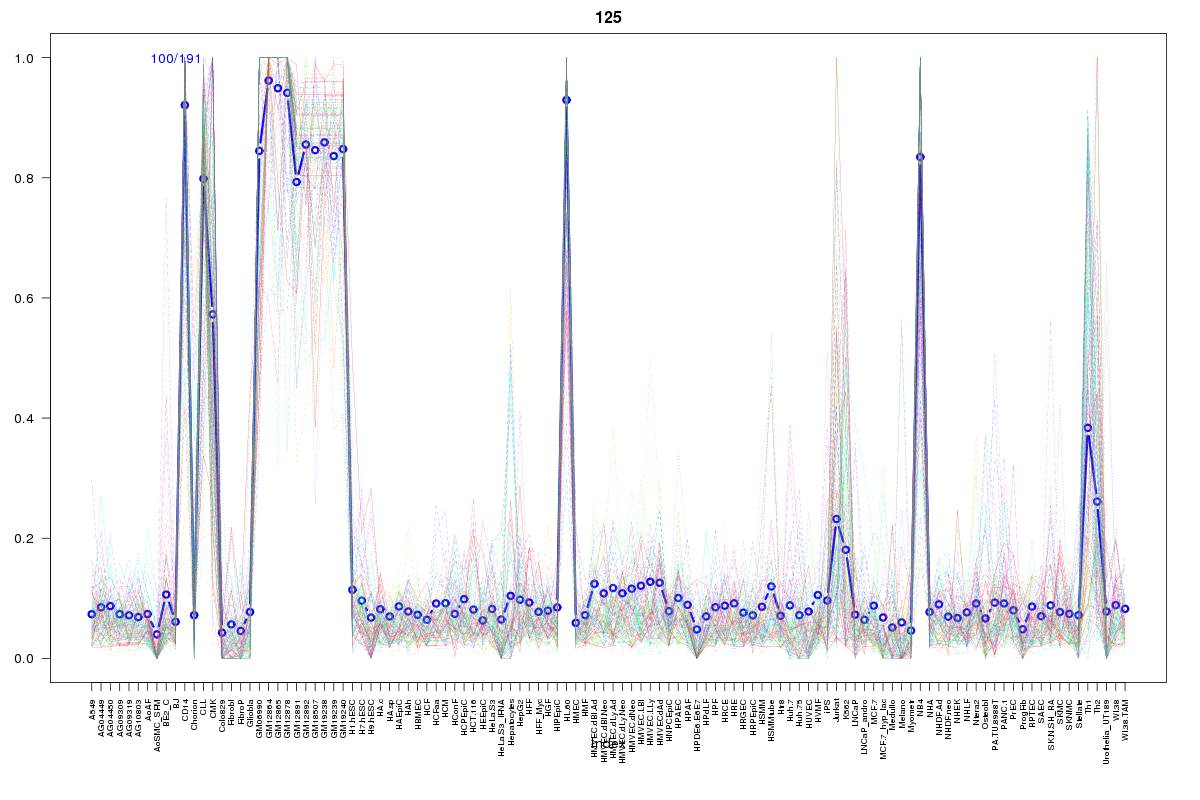 | 125 | 1 |
Resources
BED file downloads
Connects to 42 DHS sitesTop 10 Correlated DHS Sites
p-values indiciate significant higher or lower correlation| Location | Cluster | P-value |
|---|---|---|
| chr19:50320660-50320810 | 148 | 0.013 |
| chr19:50346700-50346850 | 381 | 0.024 |
| chr19:50470100-50470250 | 675 | 0.023 |
| chr19:50415140-50415290 | 265 | 0.022 |
| chr19:50379540-50379690 | 271 | 0.02 |
| chr19:50379360-50379510 | 1019 | 0.02 |
| chr19:50365405-50365695 | 1125 | 0.02 |
| chr19:50334540-50334690 | 1008 | 0.02 |
| chr19:50283265-50283415 | 325 | 0.02 |
| chr19:50399045-50399195 | 218 | 0.018 |
| chr19:50440400-50440550 | 2055 | 0.017 |
External Databases
UCSCEnsembl (ENSG00000204673)