Gene: PTPMT1
chr11: 47586981-47593479Expression Profile
(log scale)
Graphical Connections
Distribution of linked clusters:
You may find it interesting if many of the connected DHS sites belong to the same cluster.| Cluster Profile | Cluster ID | Number of DHS sites in this cluster |
|---|---|---|
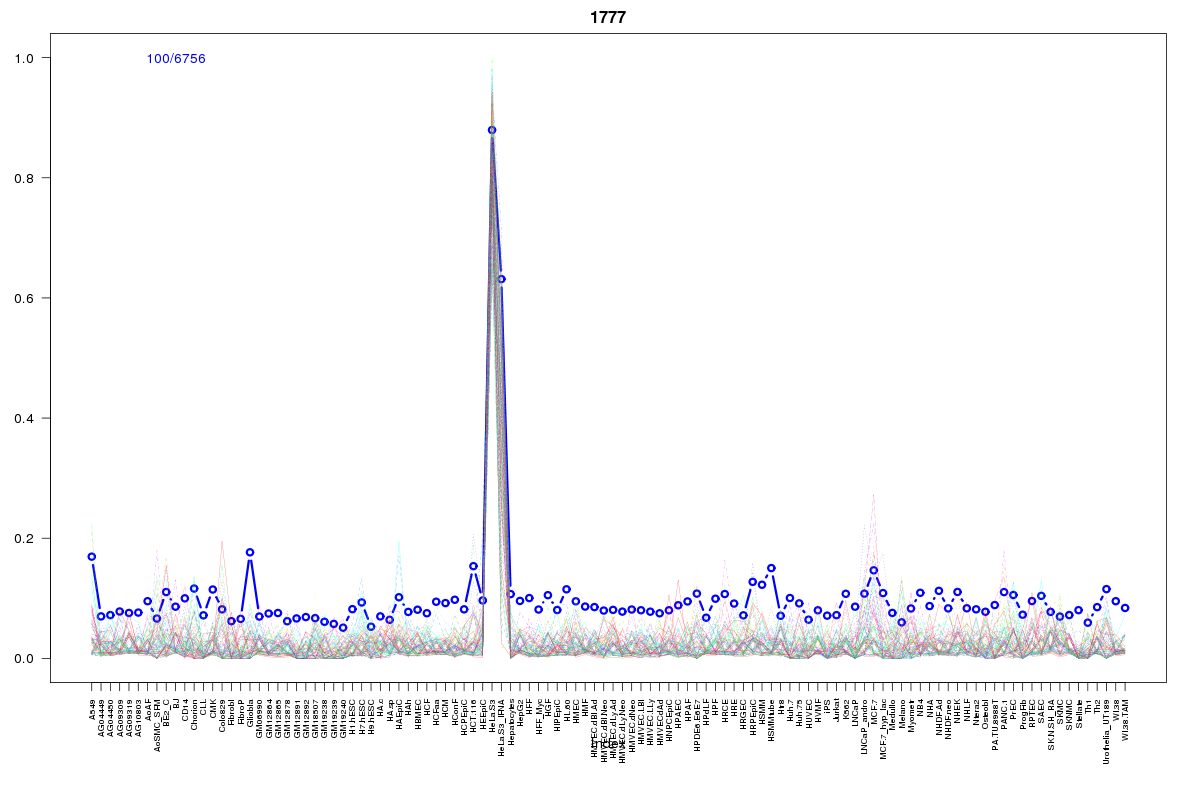 | 1777 | 3 |
 | 1724 | 3 |
 | 1755 | 2 |
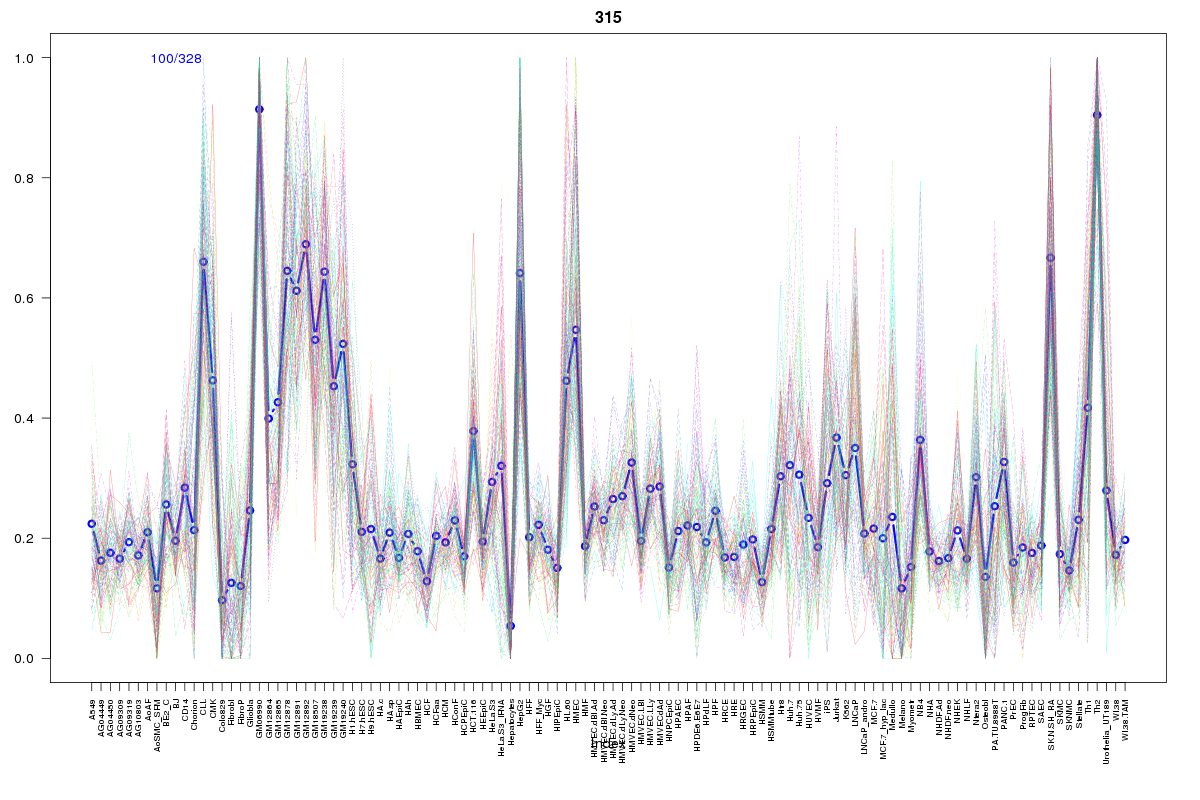 | 315 | 2 |
 | 881 | 2 |
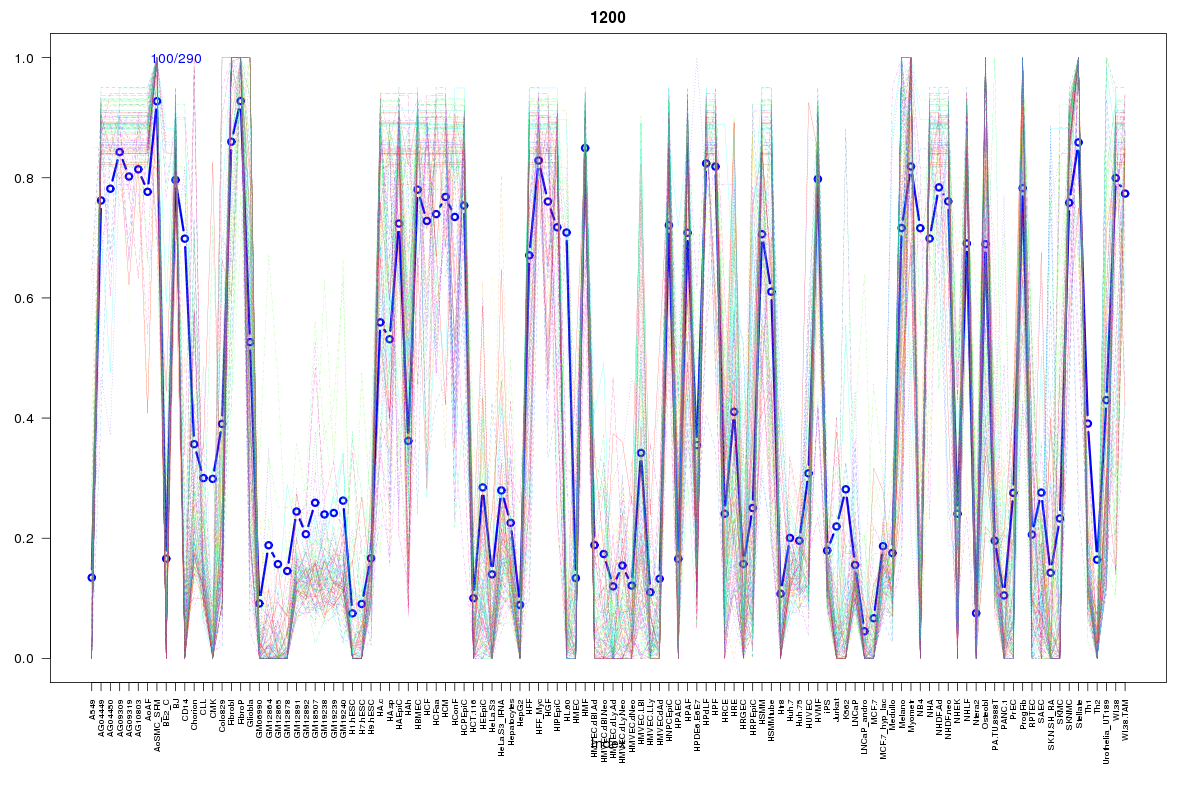 | 1200 | 2 |
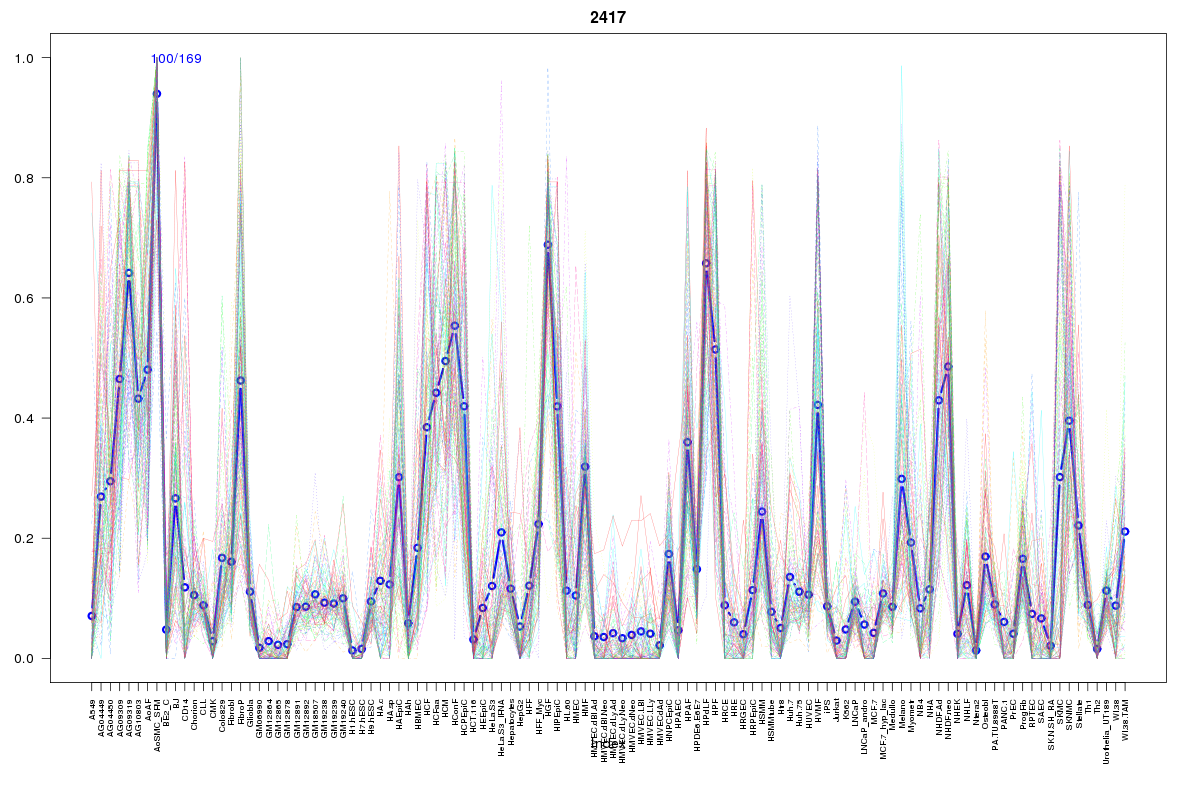 | 2417 | 1 |
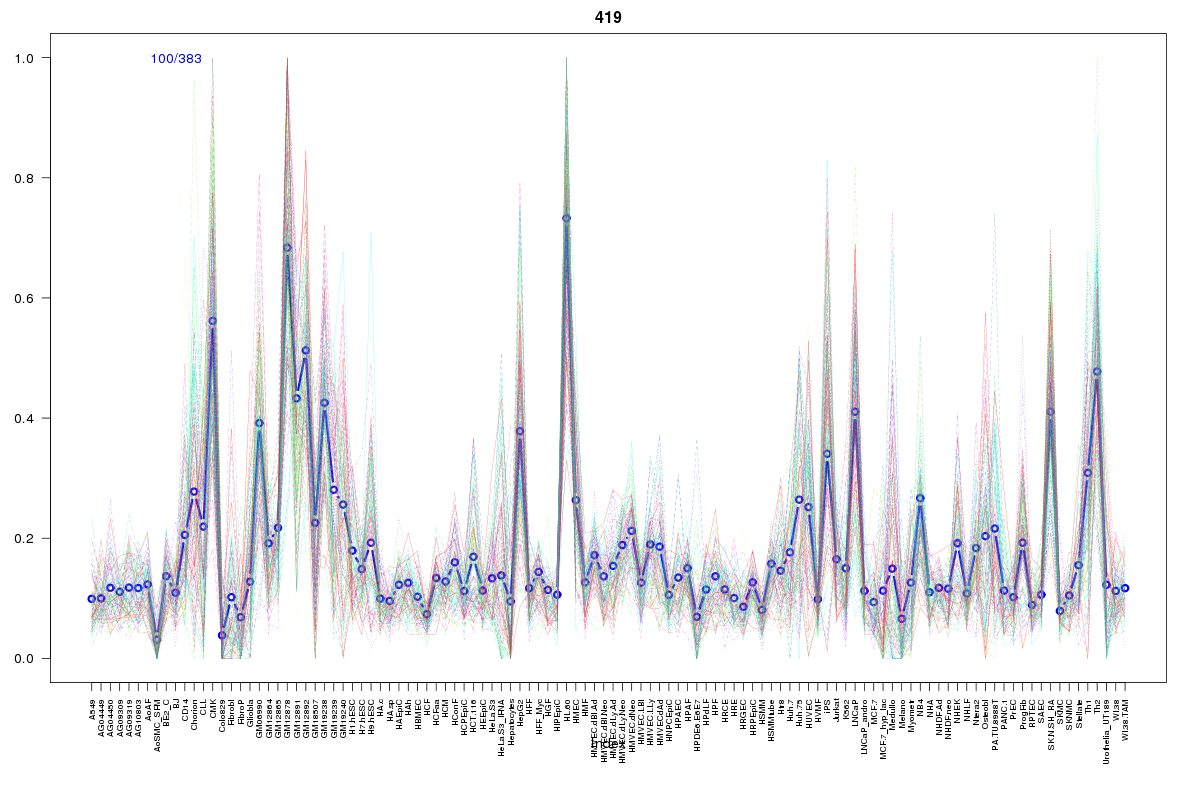 | 419 | 1 |
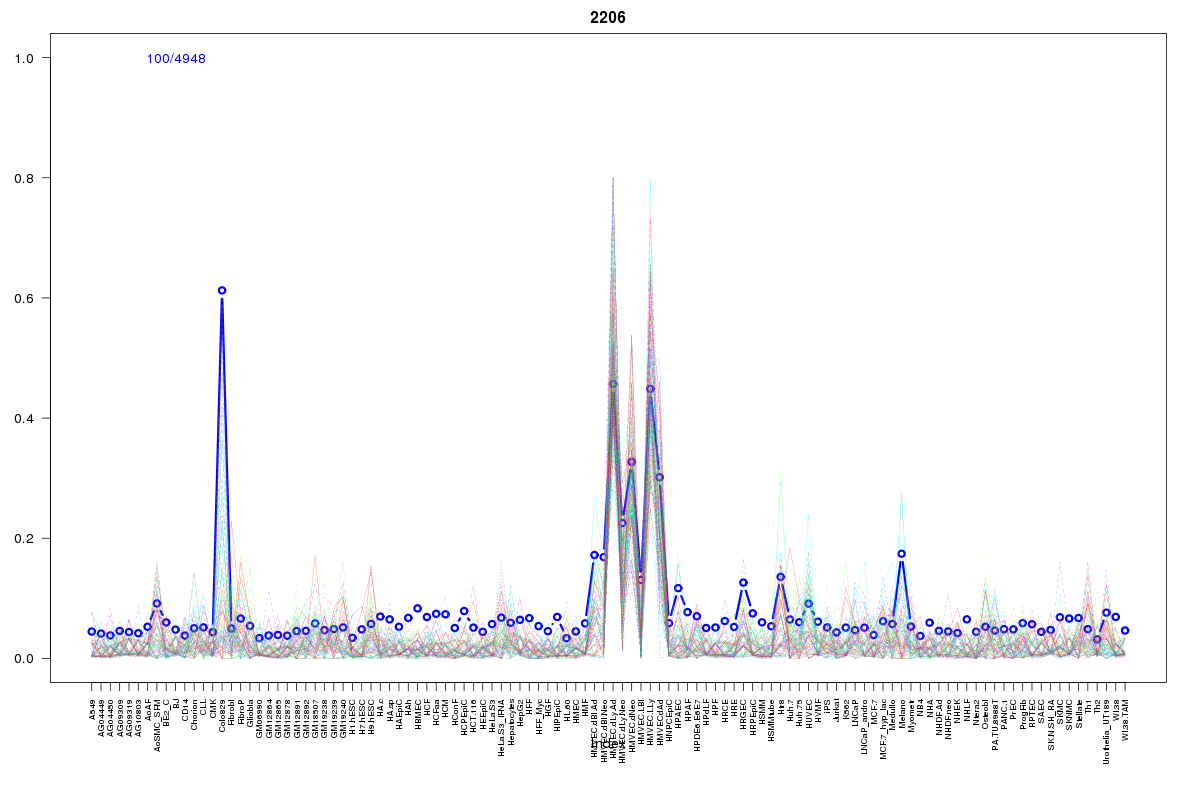 | 2206 | 1 |
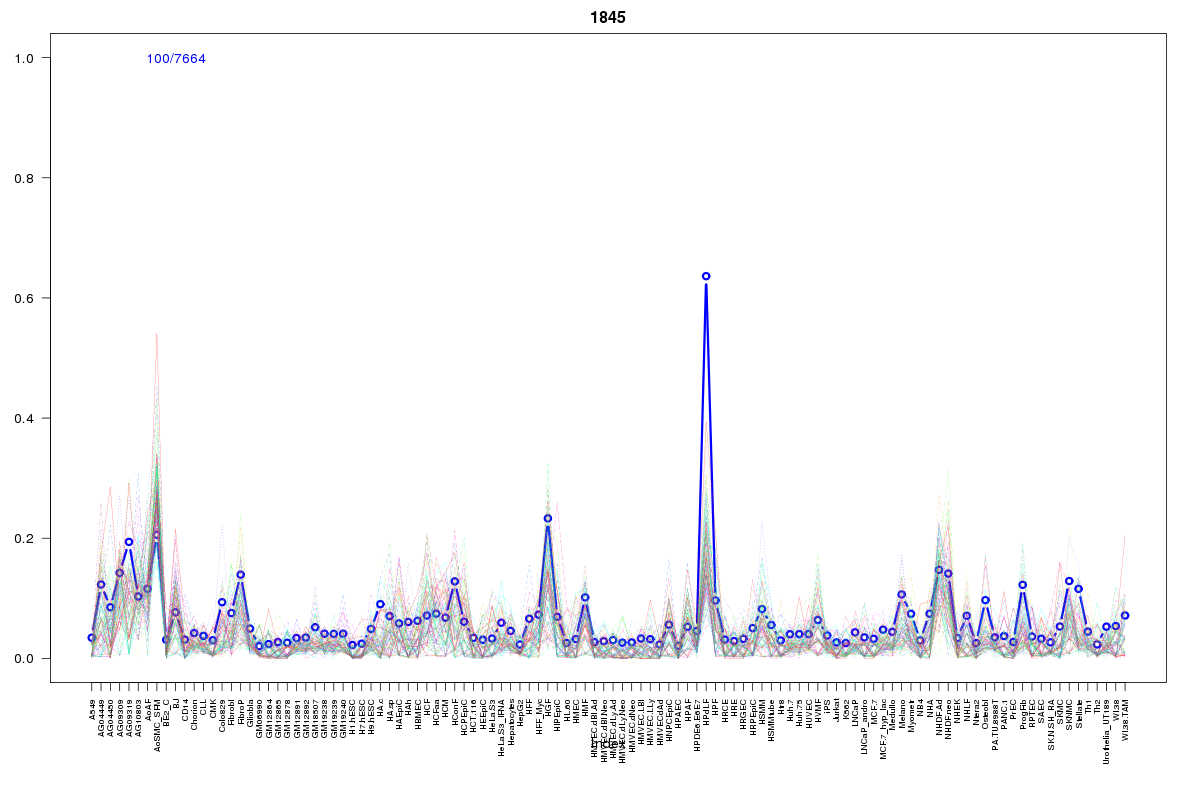 | 1845 | 1 |
 | 1604 | 1 |
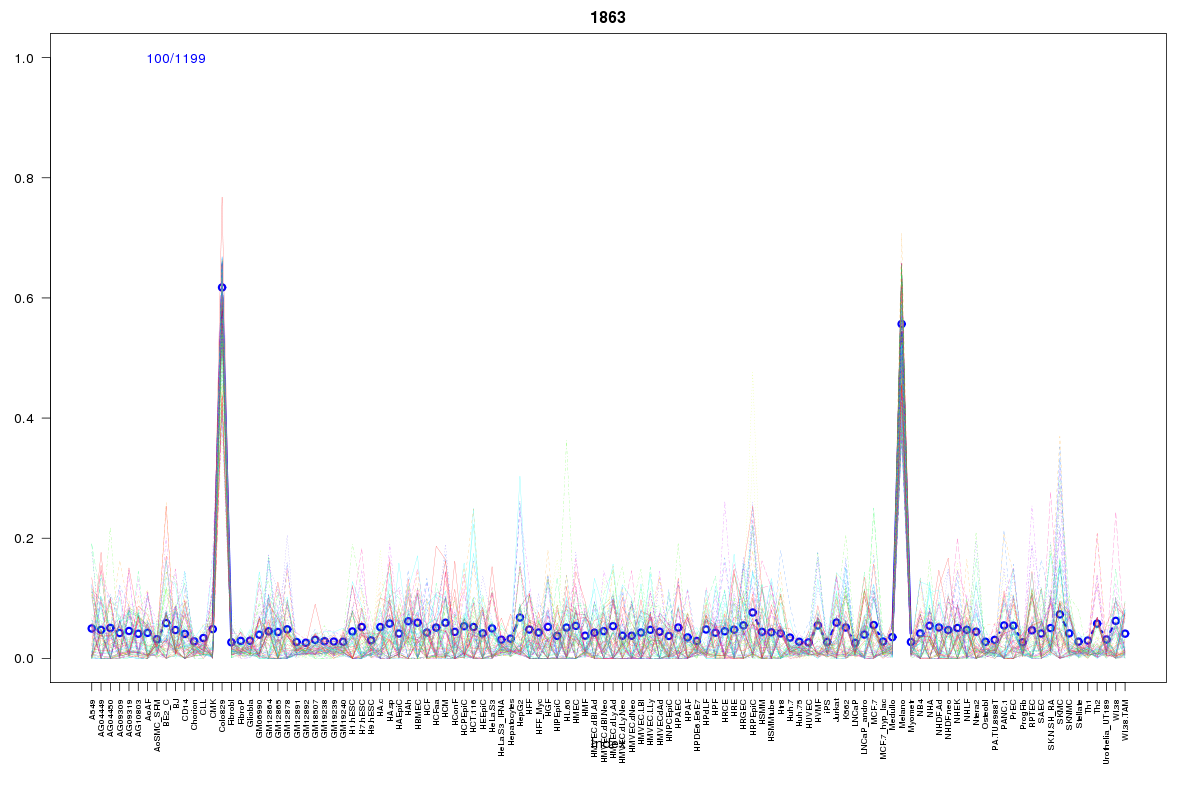 | 1863 | 1 |
 | 2122 | 1 |
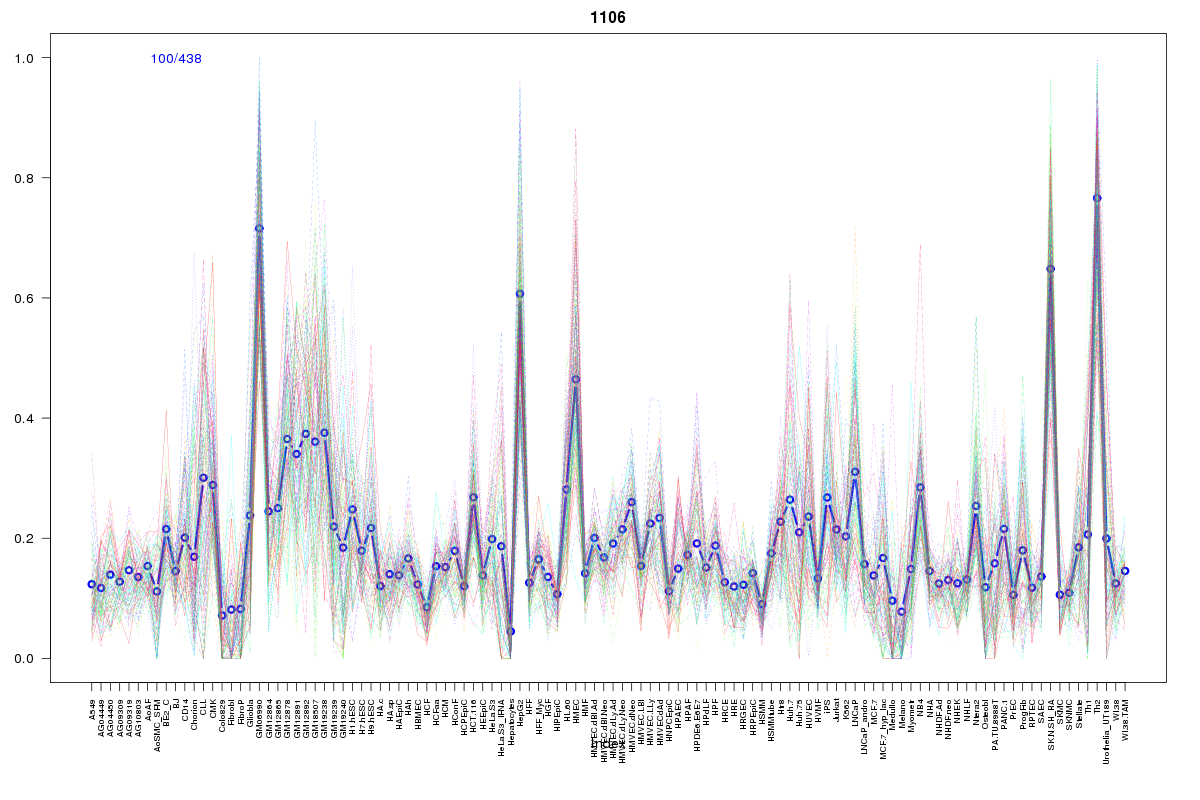 | 1106 | 1 |
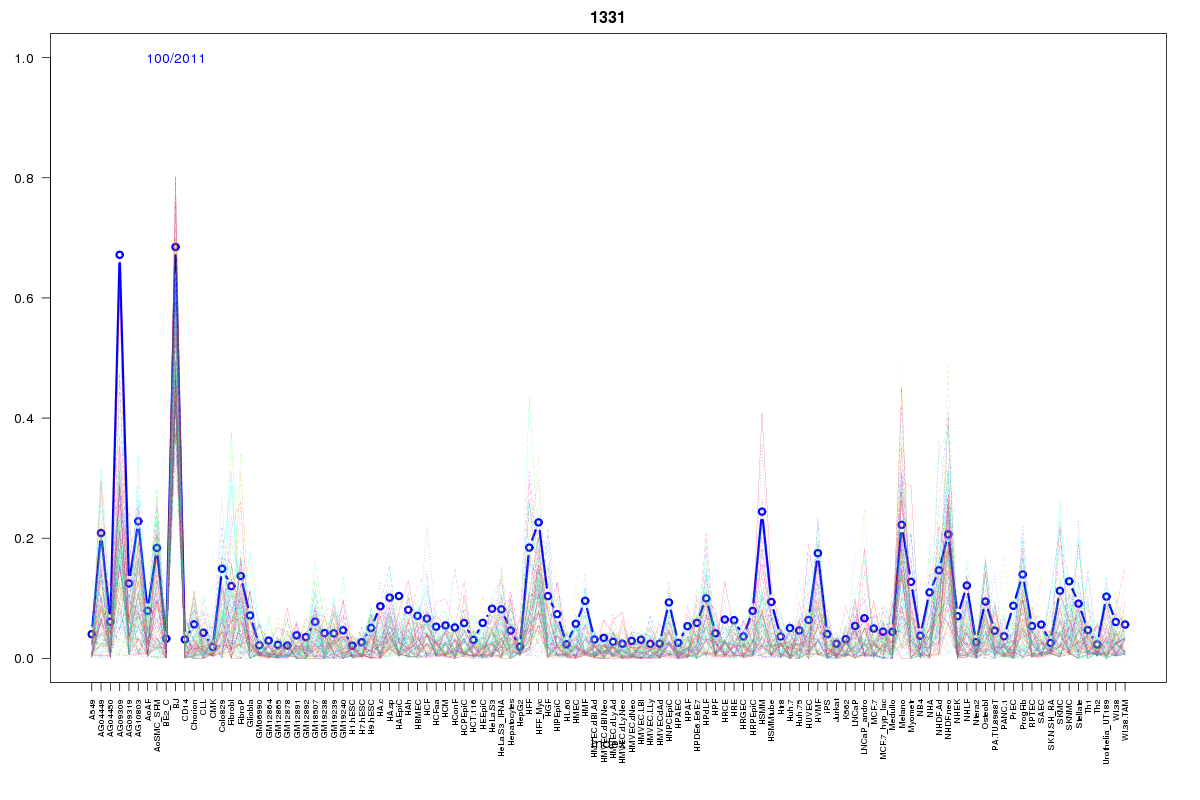 | 1331 | 1 |
 | 570 | 1 |
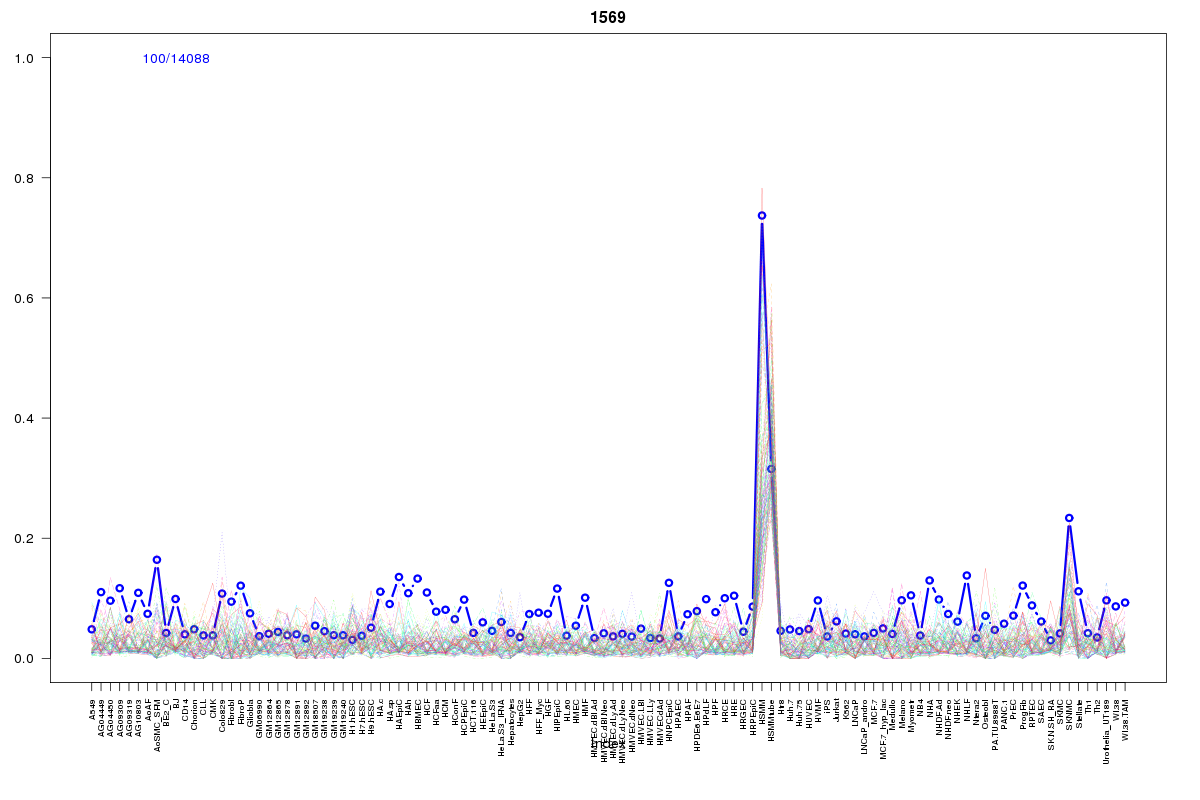 | 1569 | 1 |
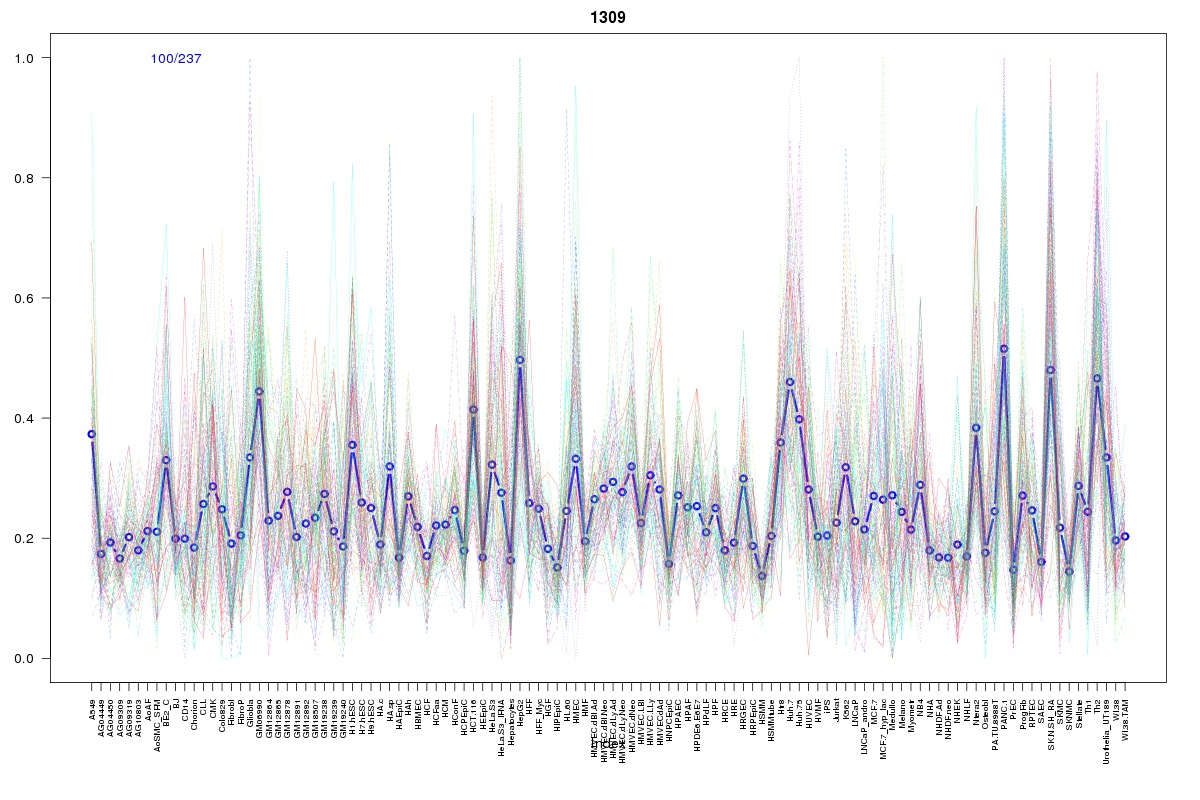 | 1309 | 1 |
 | 1923 | 1 |
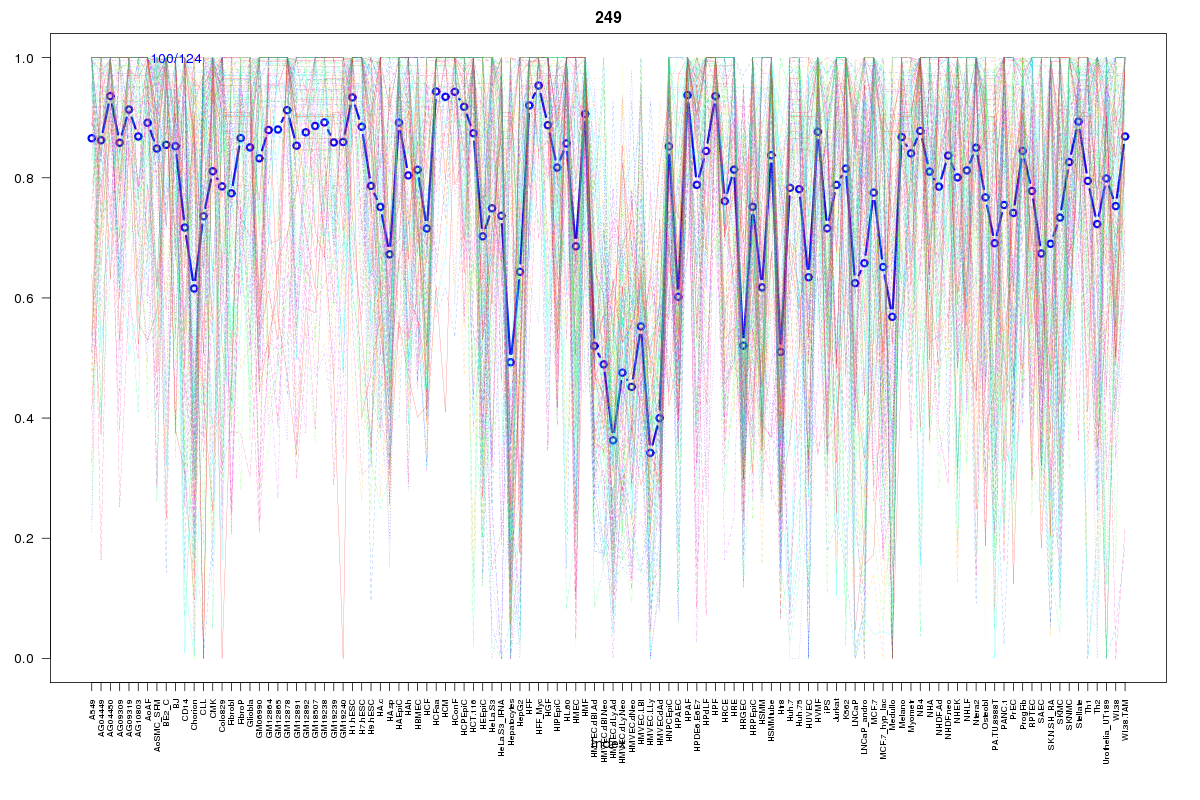 | 249 | 1 |
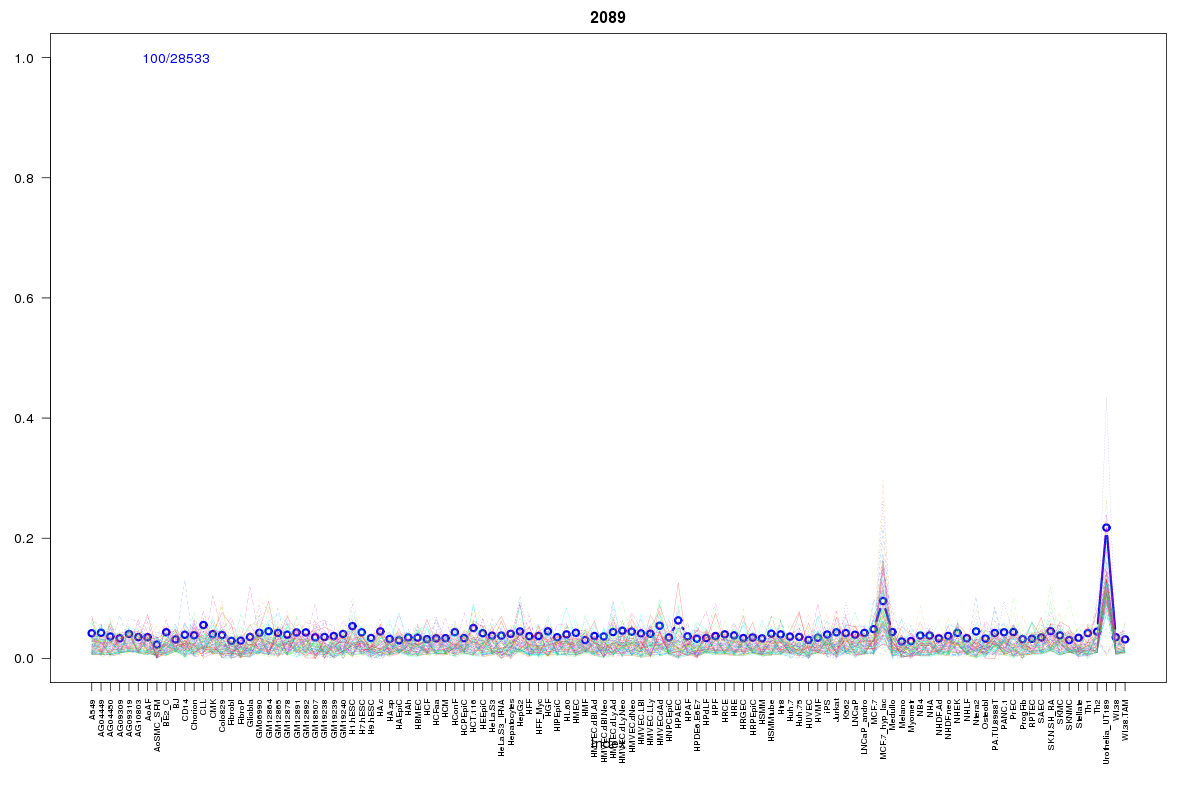 | 2089 | 1 |
 | 2017 | 1 |
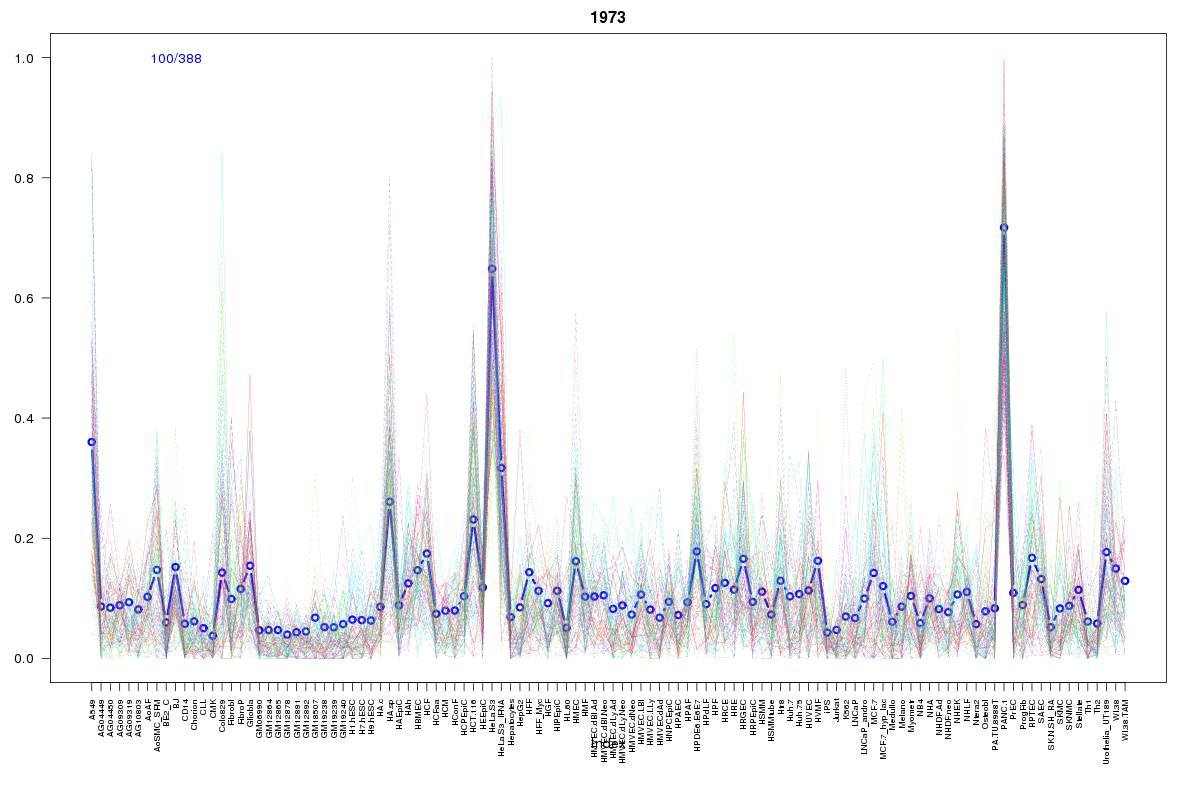 | 1973 | 1 |
 | 2279 | 1 |
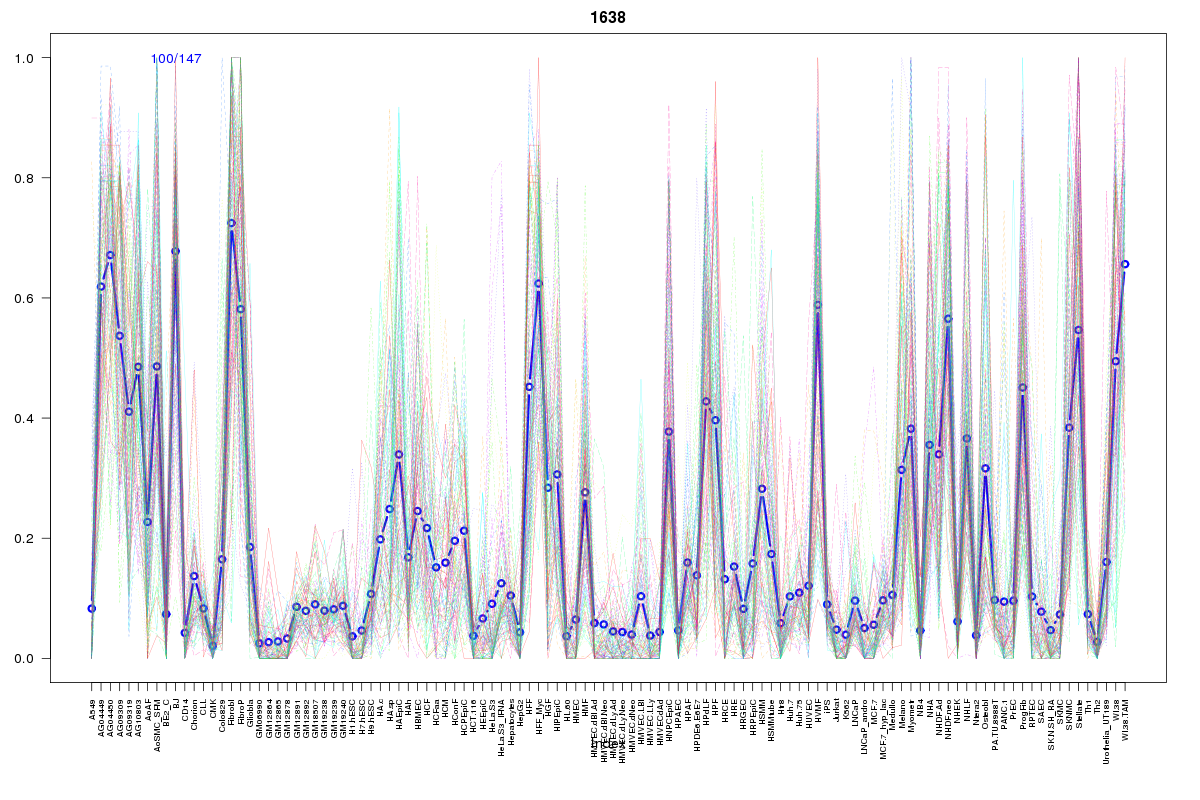 | 1638 | 1 |
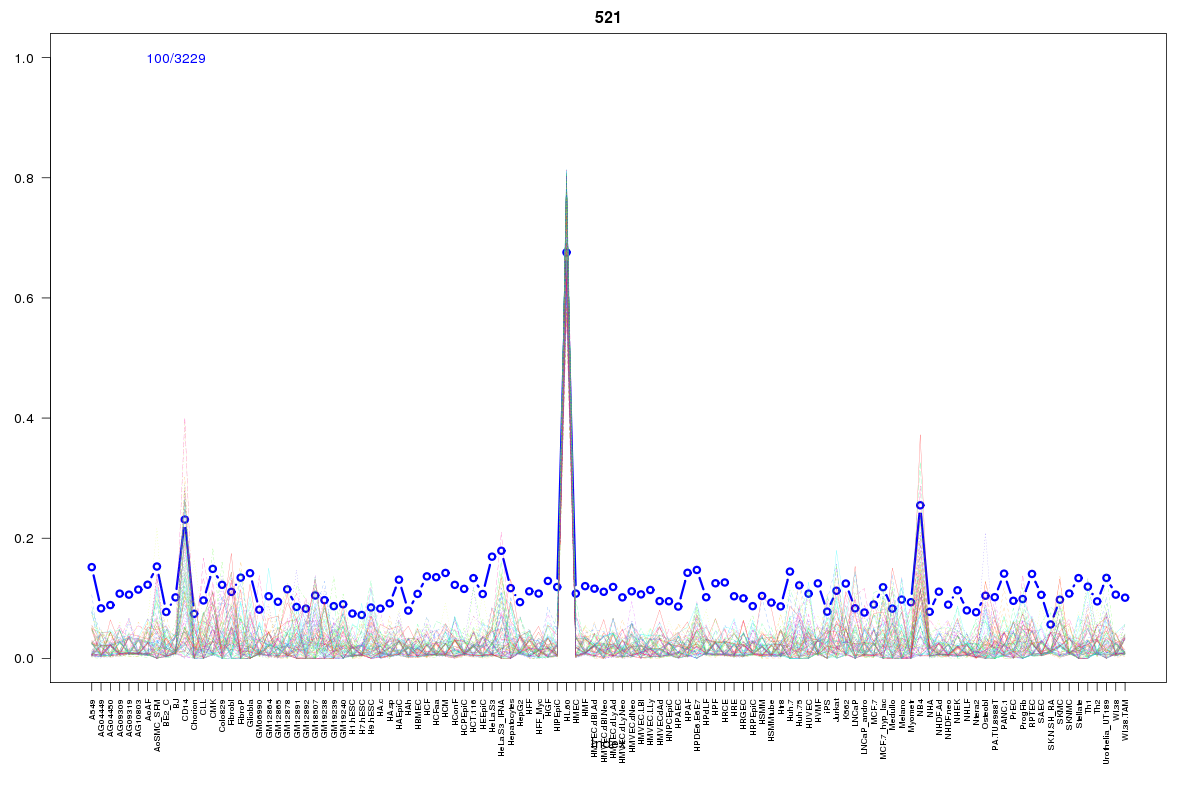 | 521 | 1 |
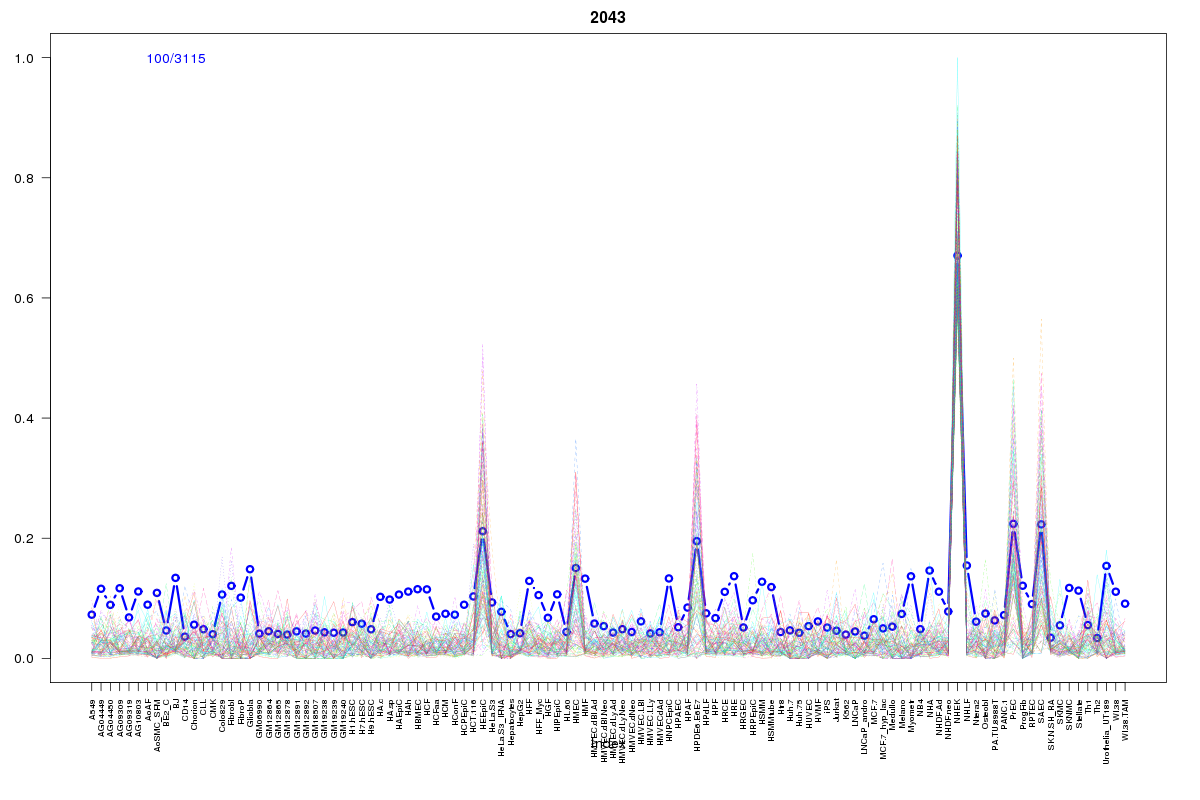 | 2043 | 1 |
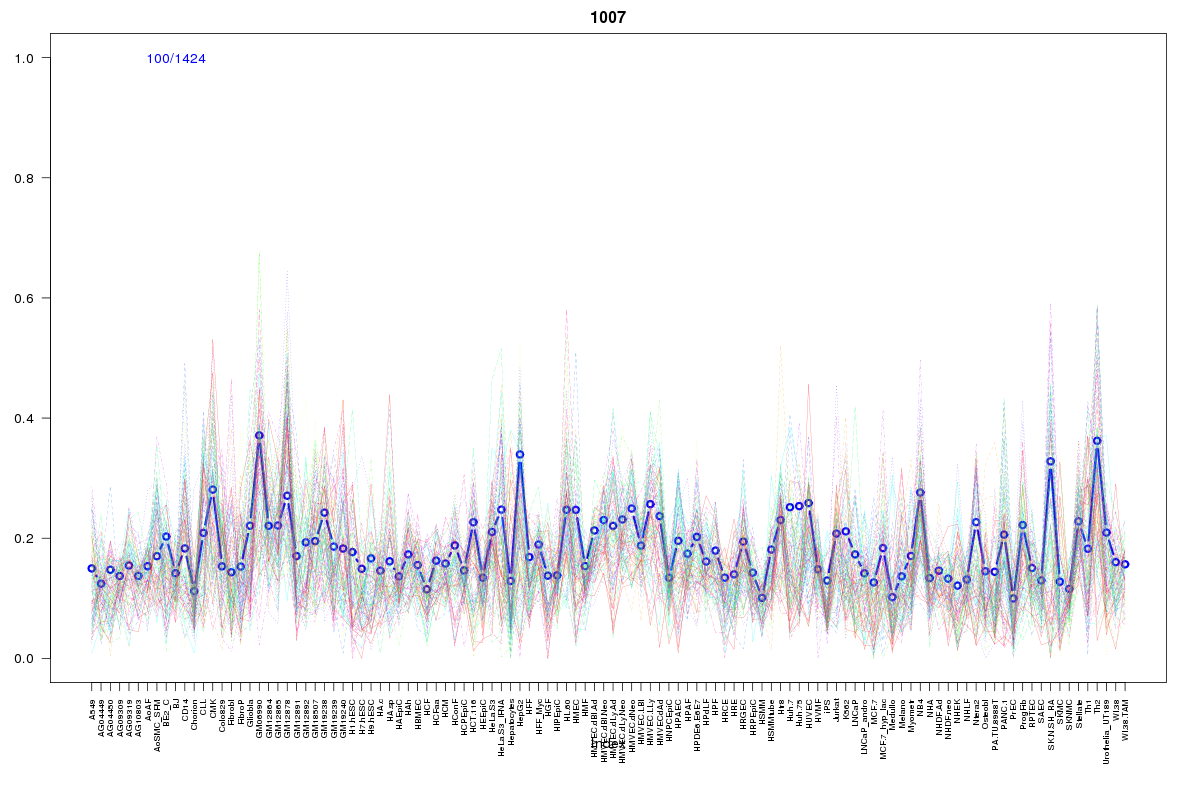 | 1007 | 1 |
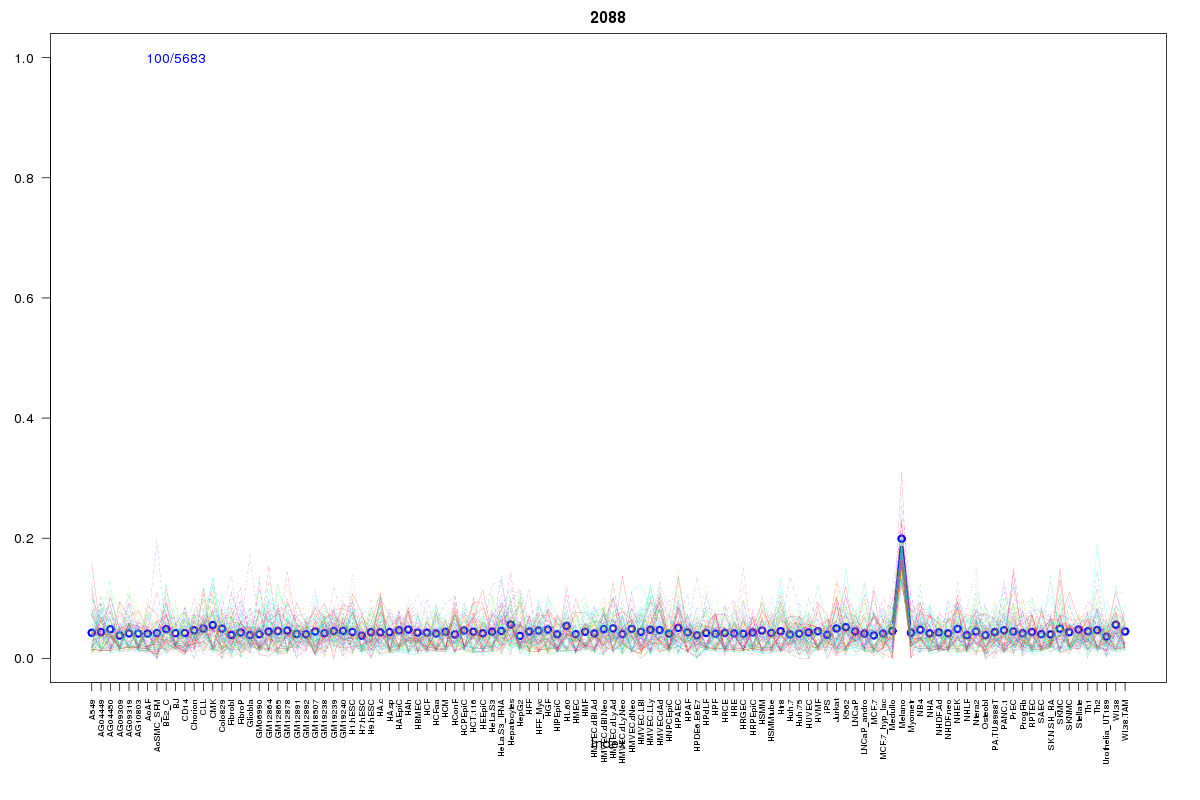 | 2088 | 1 |
 | 469 | 1 |
 | 2055 | 1 |
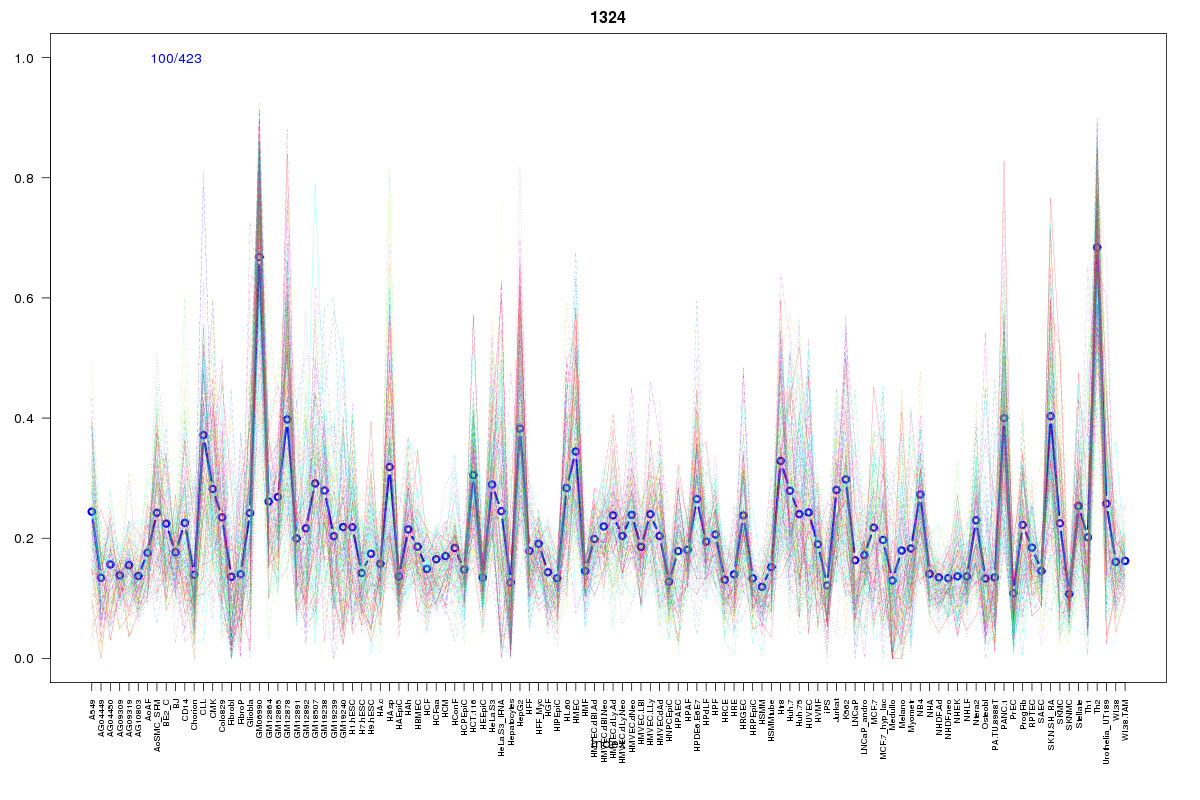 | 1324 | 1 |
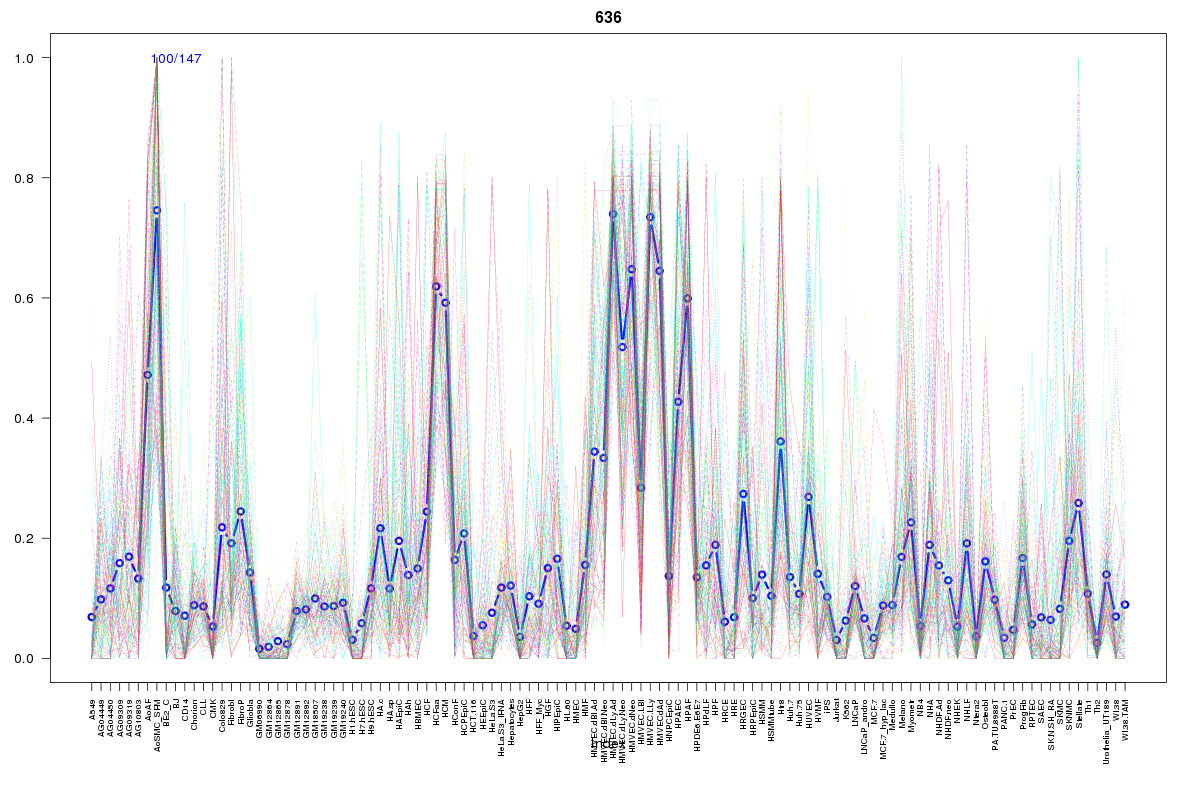 | 636 | 1 |
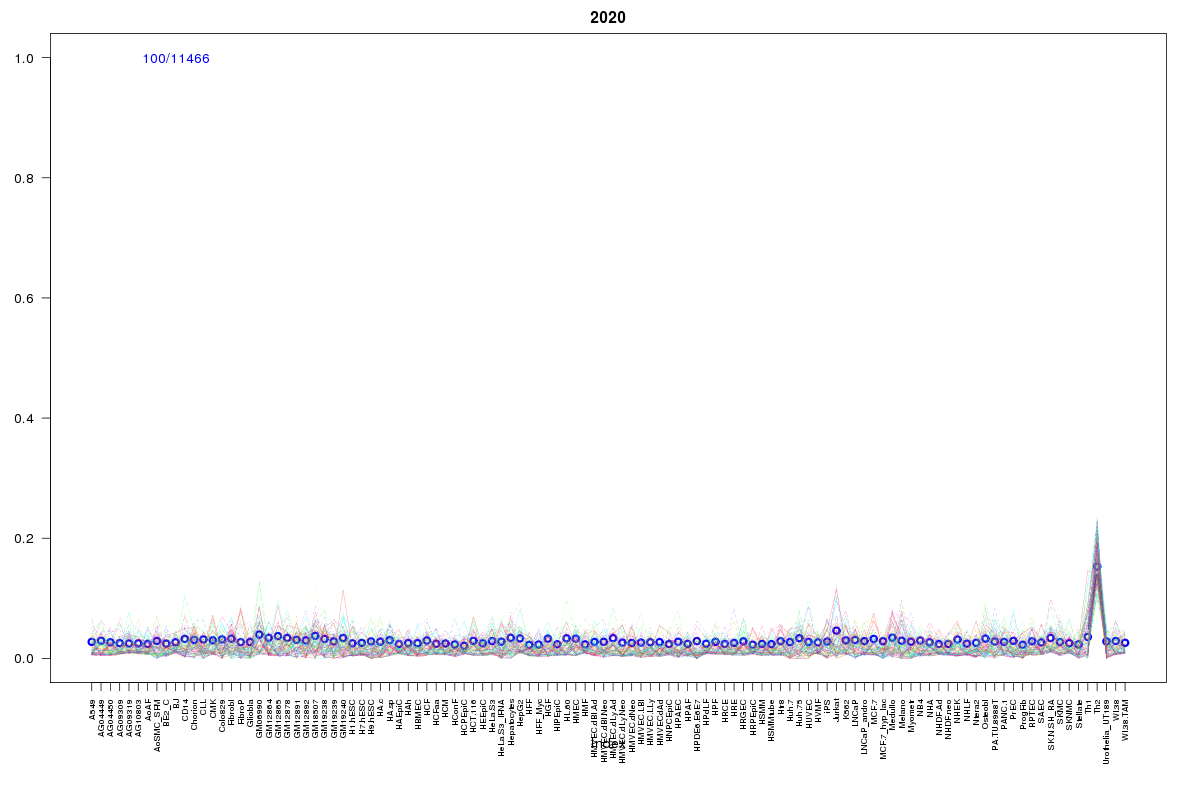 | 2020 | 1 |
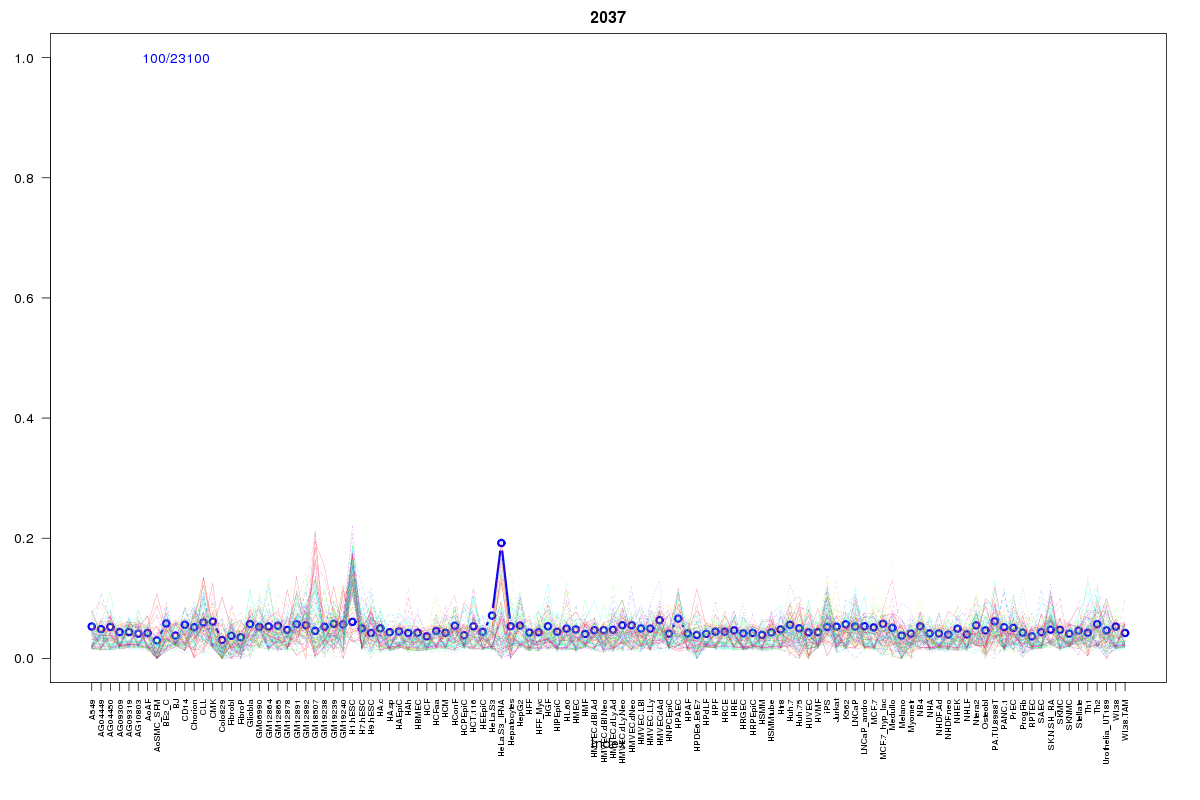 | 2037 | 1 |
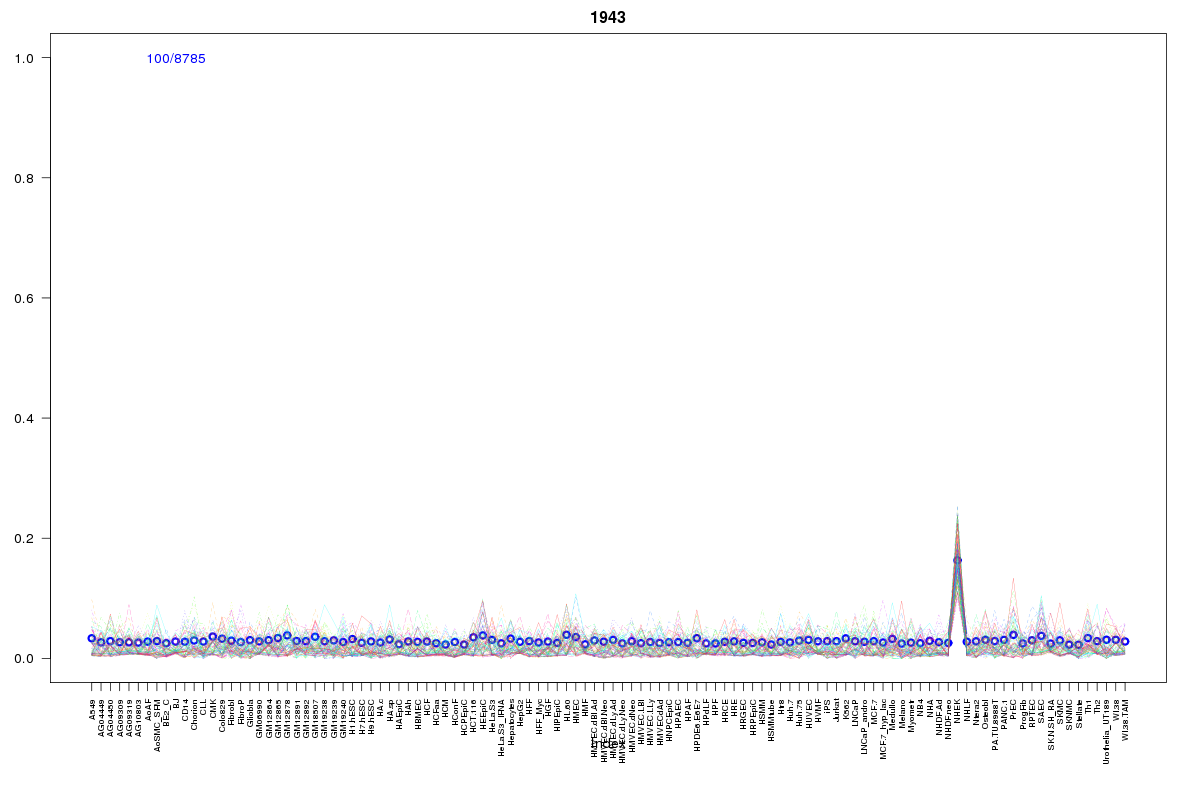 | 1943 | 1 |
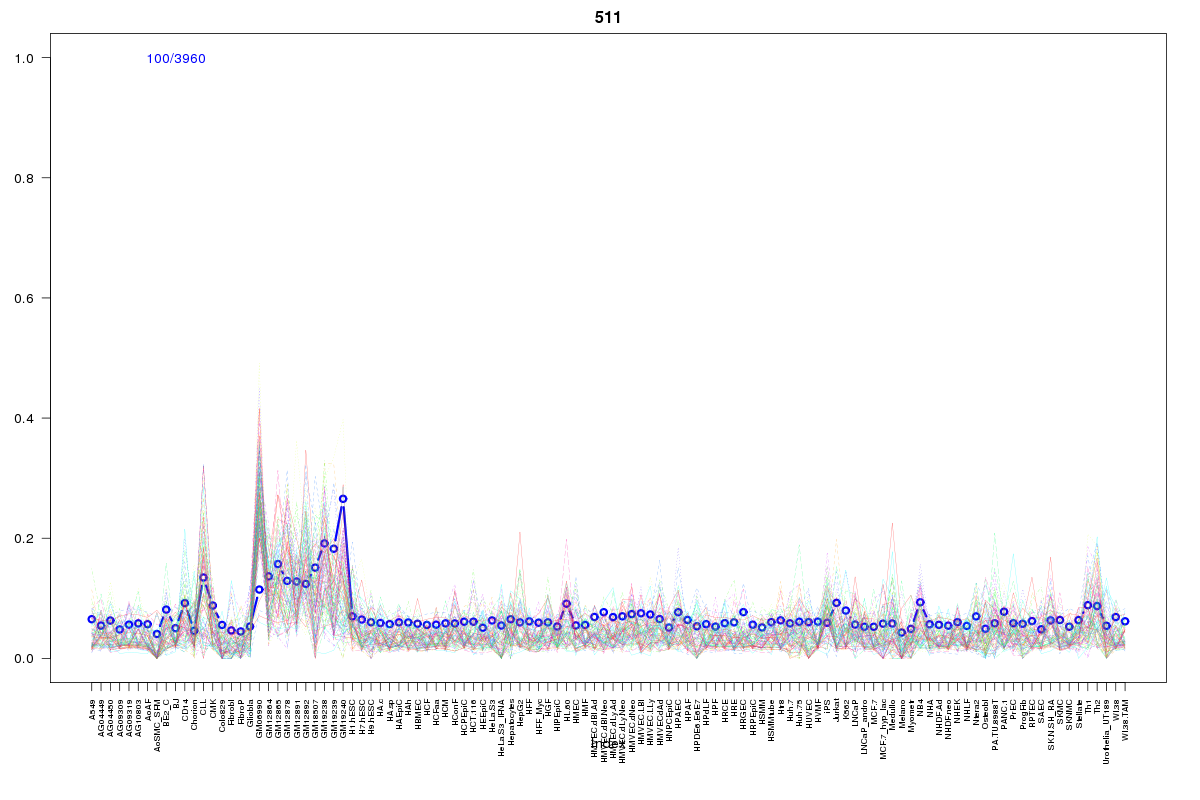 | 511 | 1 |
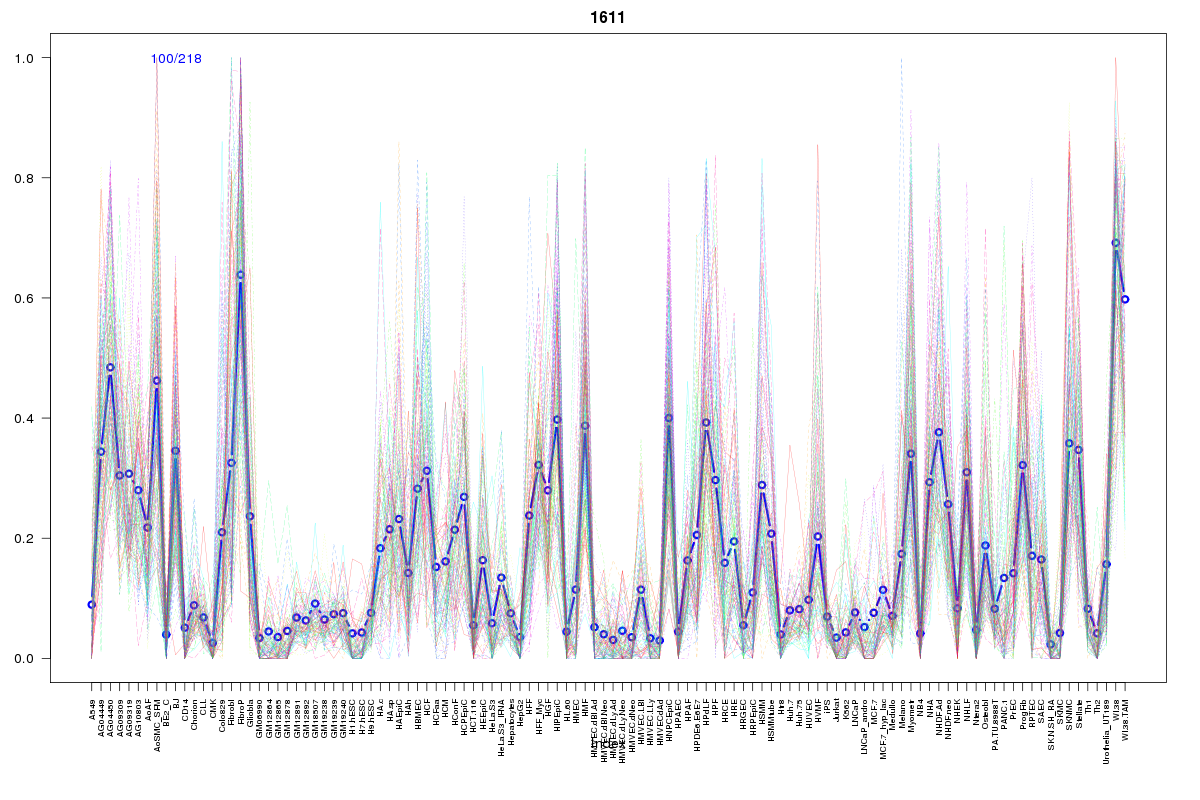 | 1611 | 1 |
Resources
BED file downloads
Connects to 46 DHS sitesTop 10 Correlated DHS Sites
p-values indiciate significant higher or lower correlation| Location | Cluster | P-value |
|---|---|---|
| chr11:47663720-47663870 | 315 | 0.003 |
| chr11:47663565-47663715 | 1106 | 0.003 |
| chr11:47573960-47574110 | 1007 | 0.003 |
| chr11:47532820-47532970 | 1724 | 0.003 |
| chr11:47600180-47600330 | 249 | 0.004 |
| chr11:47574220-47574370 | 469 | 0.004 |
| chr11:47693125-47693275 | 1724 | 0.004 |
| chr11:47601100-47601250 | 2017 | 0.005 |
| chr11:47575000-47575150 | 1324 | 0.005 |
| chr11:47561420-47561570 | 2043 | 0.007 |
| chr11:47531240-47531390 | 1777 | 0.008 |
External Databases
UCSCEnsembl (ENSG00000110536)