Gene: GNB3
chr12: 6949117-6956557Expression Profile
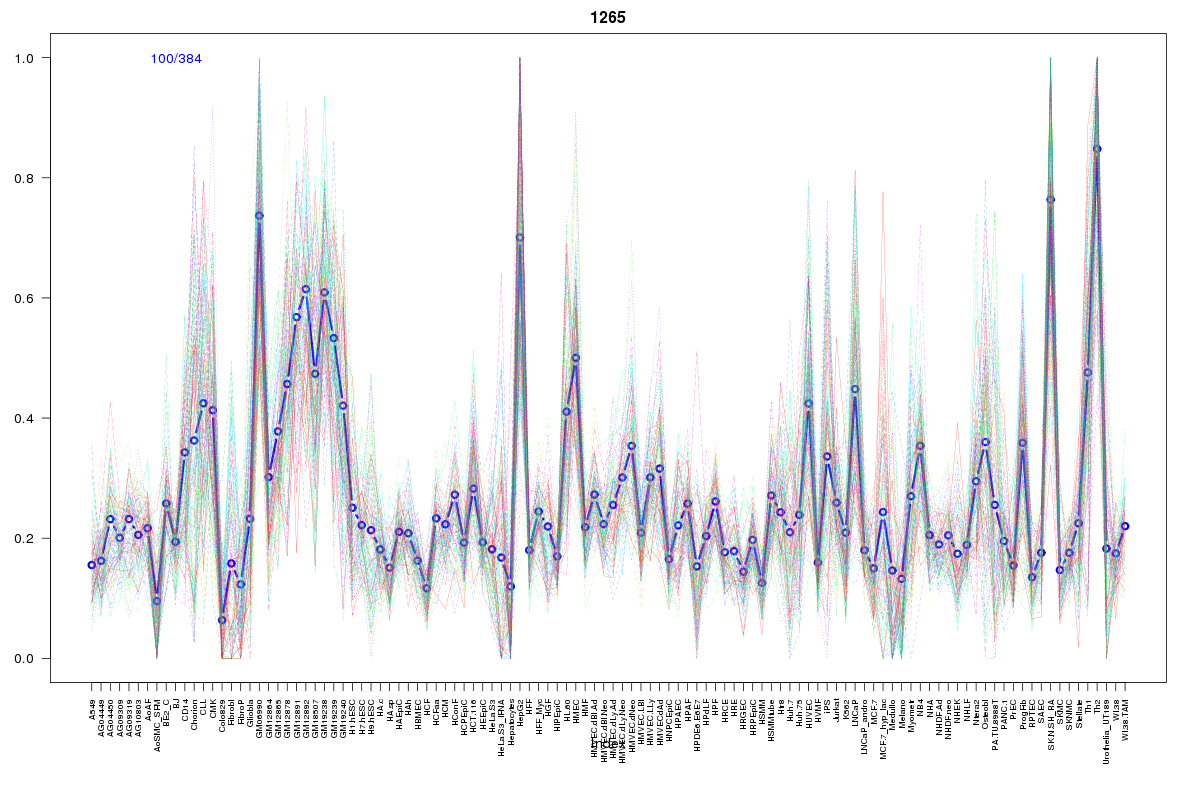
(log scale)
Graphical Connections
Distribution of linked clusters:
You may find it interesting if many of the connected DHS sites belong to the same cluster.| Cluster Profile | Cluster ID | Number of DHS sites in this cluster |
|---|---|---|
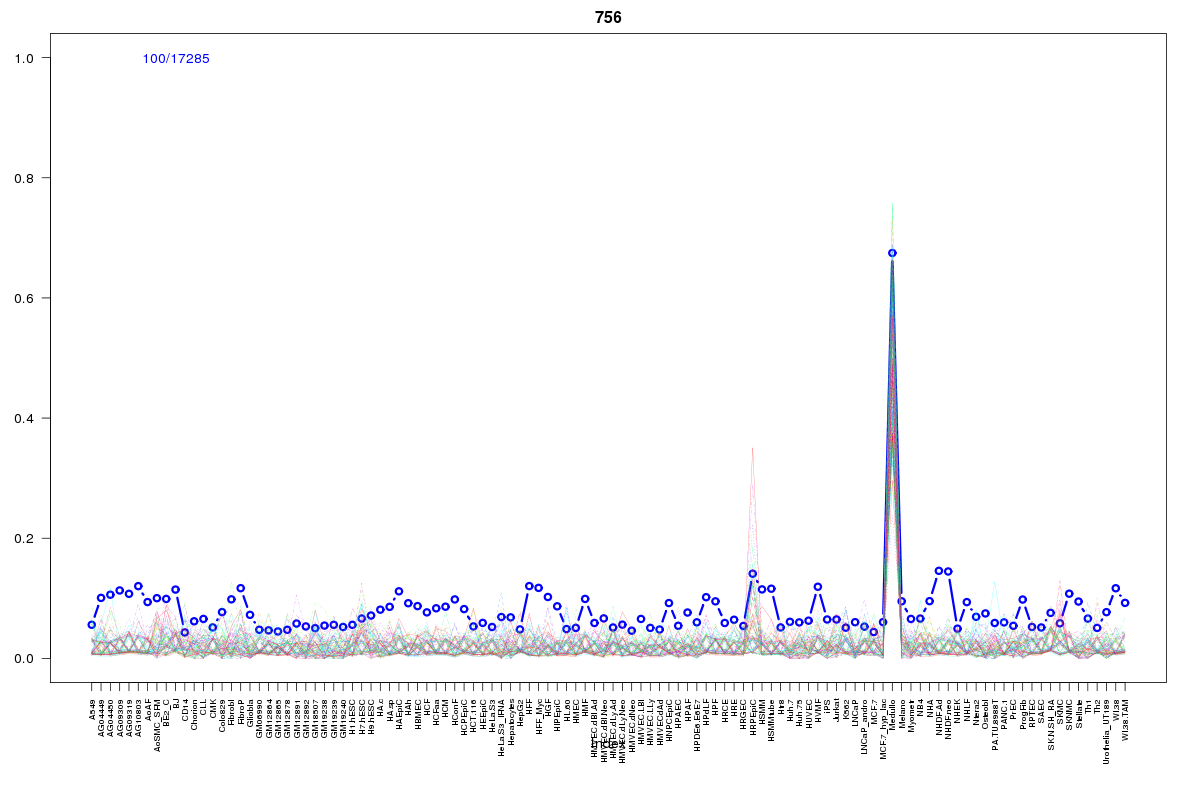 | 756 | 9 |
 | 655 | 5 |
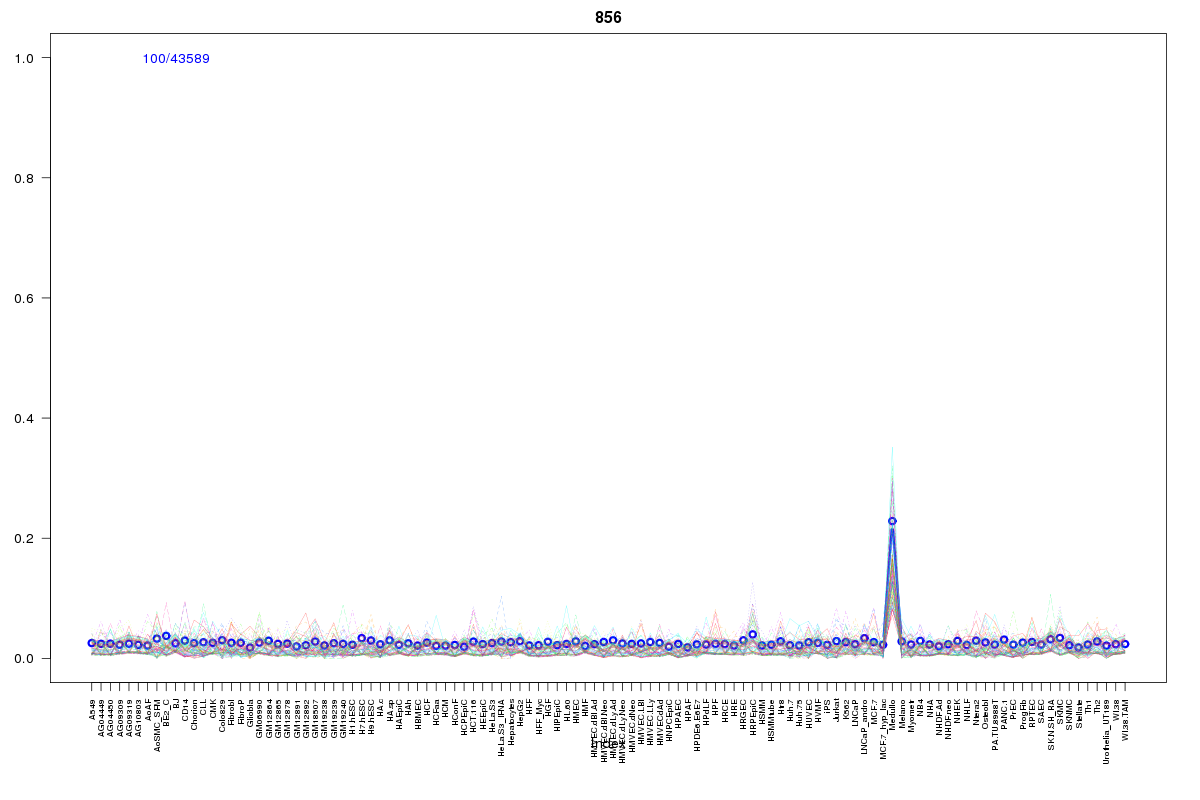 | 856 | 3 |
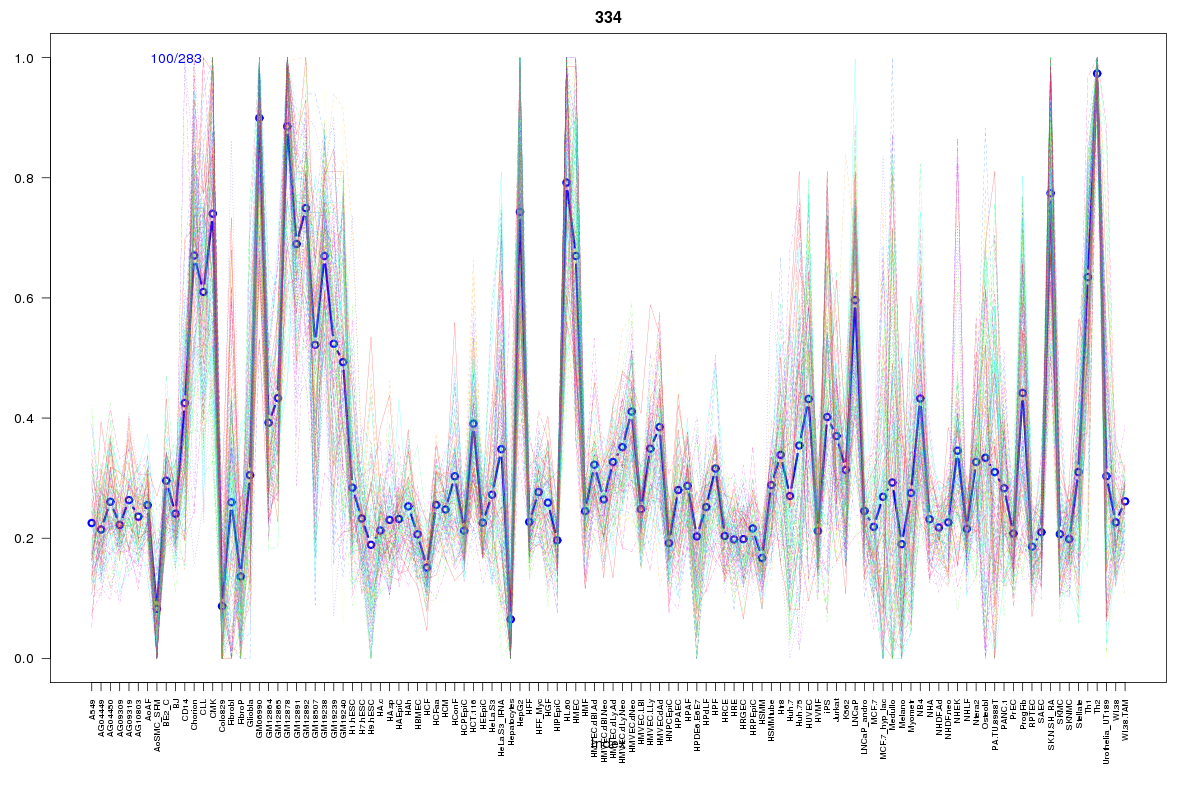 | 334 | 2 |
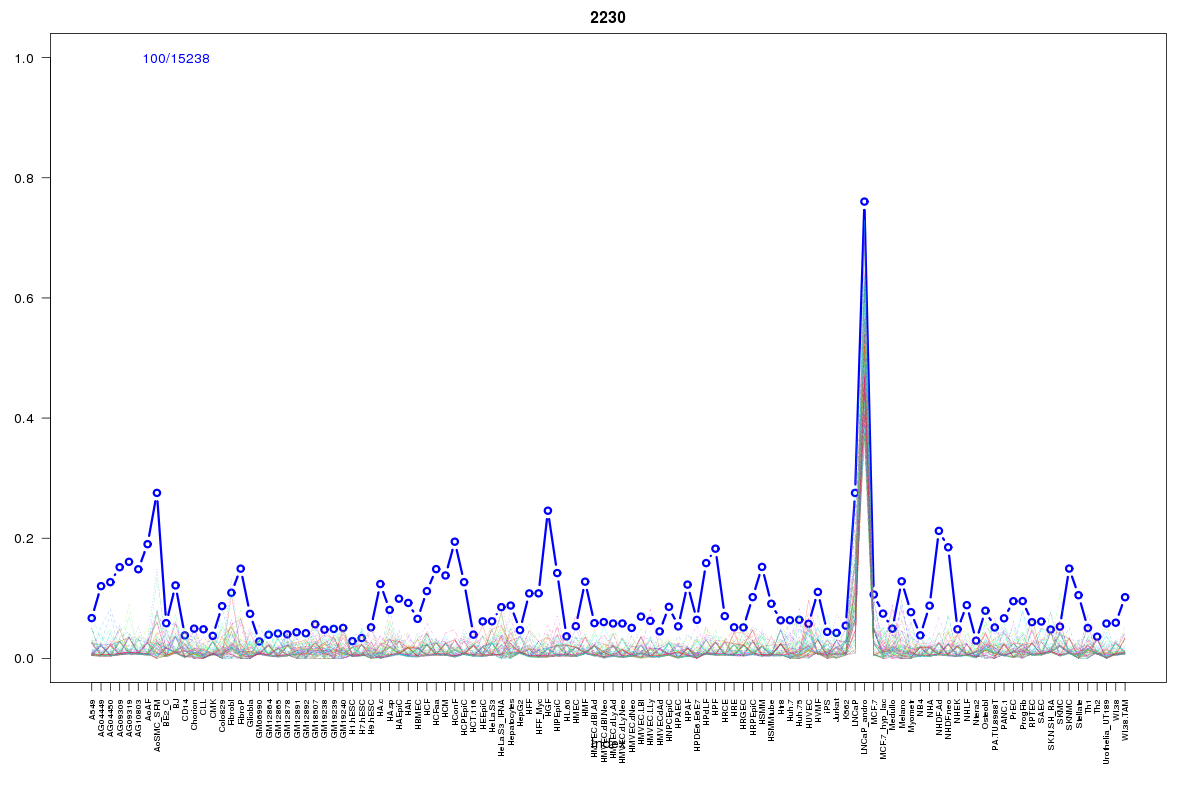 | 2230 | 2 |
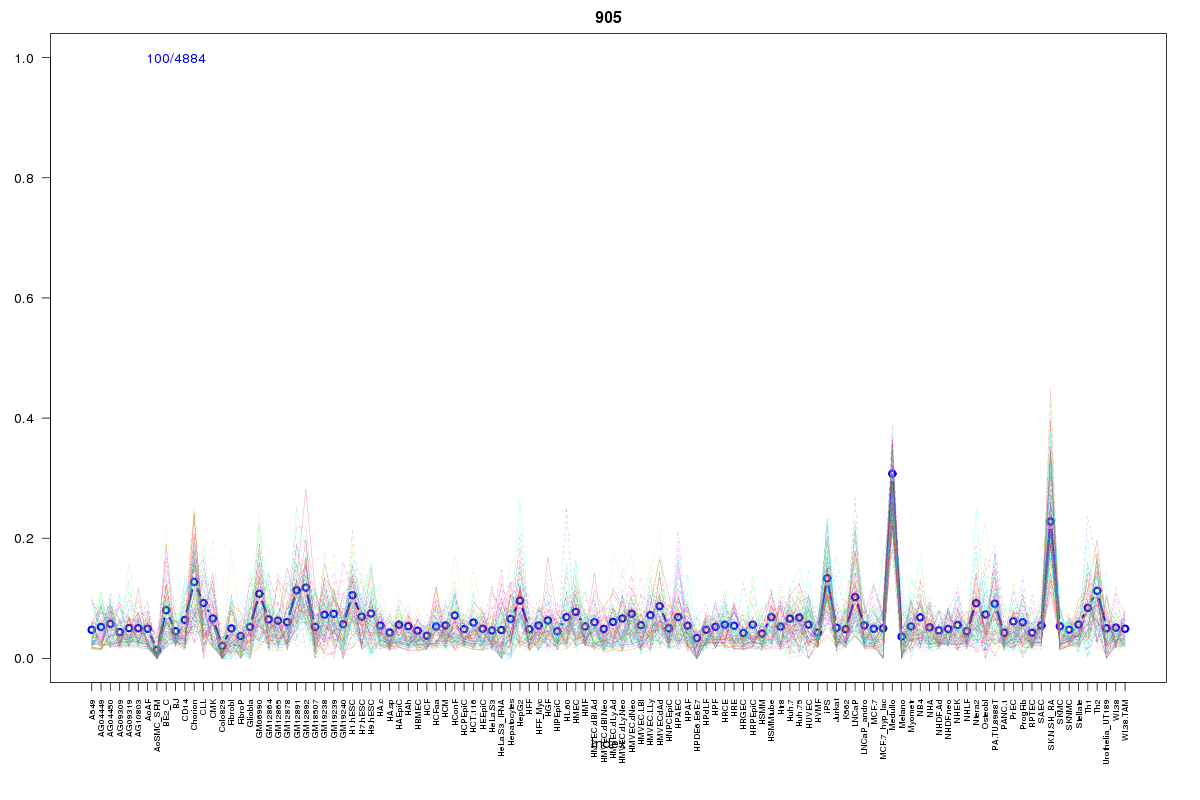 | 905 | 2 |
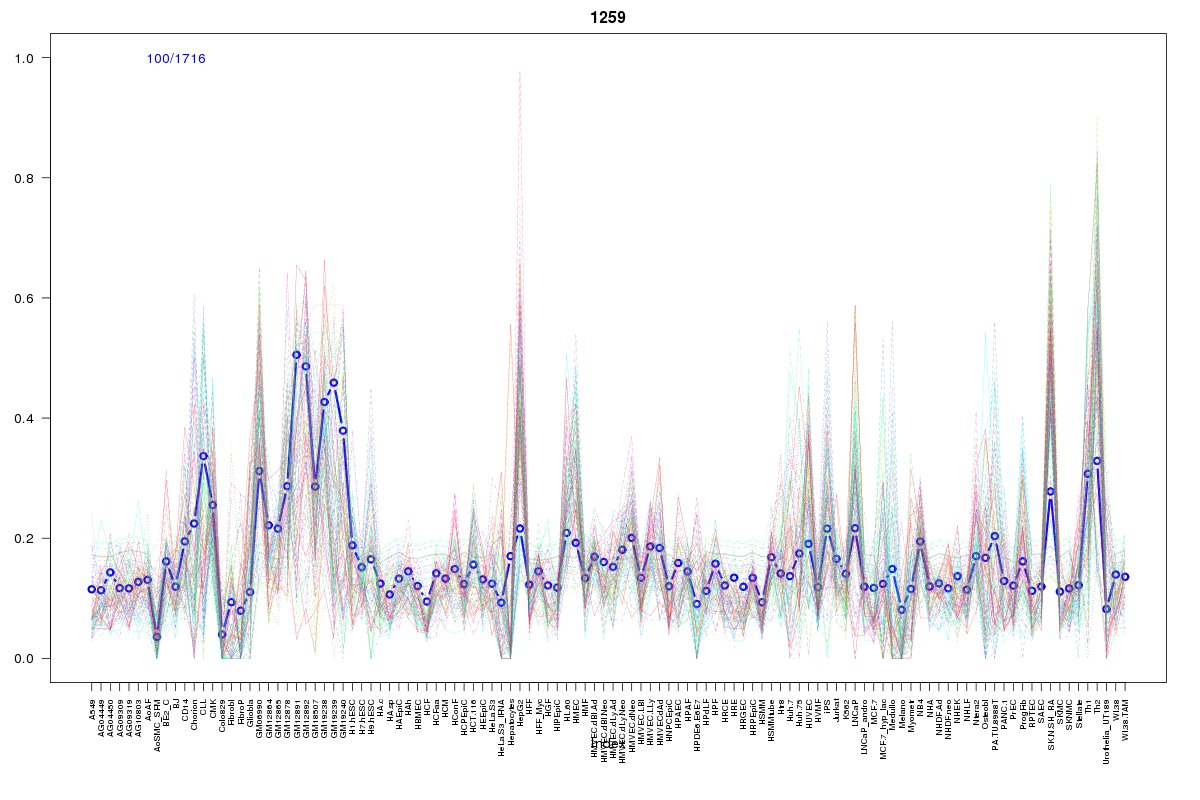 | 1259 | 1 |
 | 554 | 1 |
 | 570 | 1 |
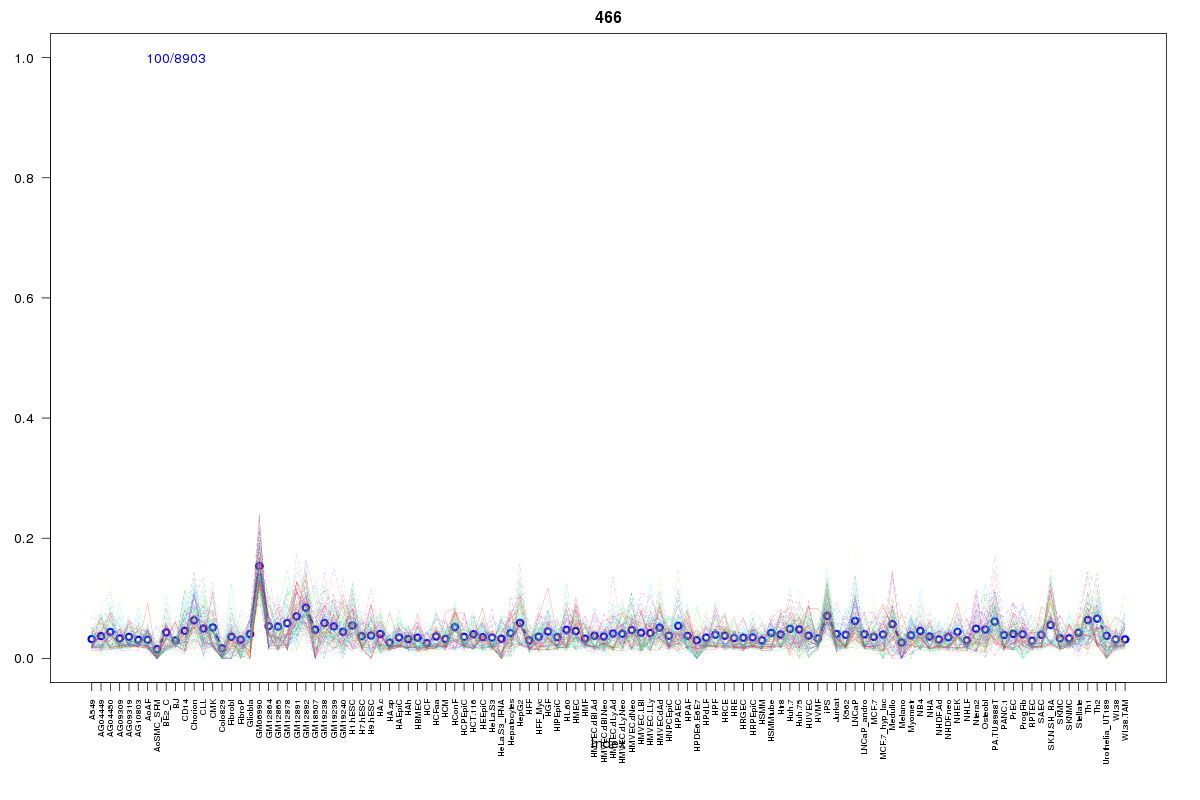 | 466 | 1 |
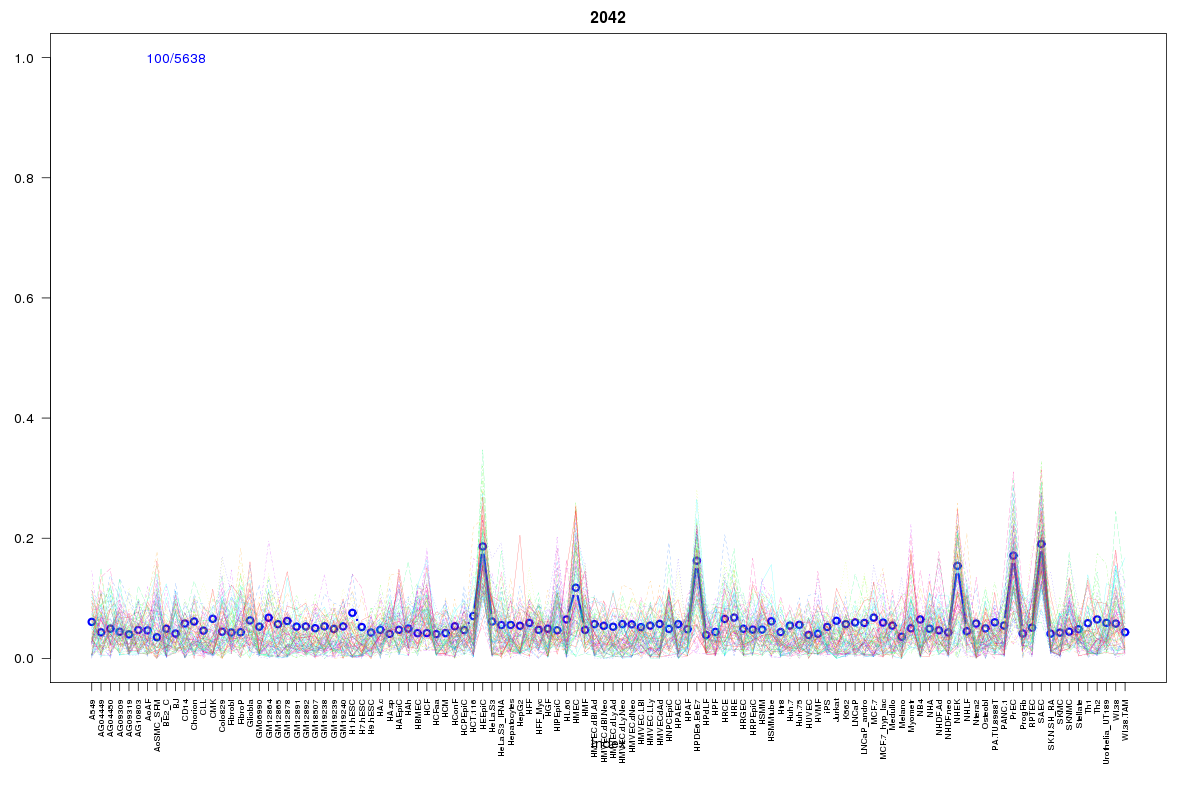 | 2042 | 1 |
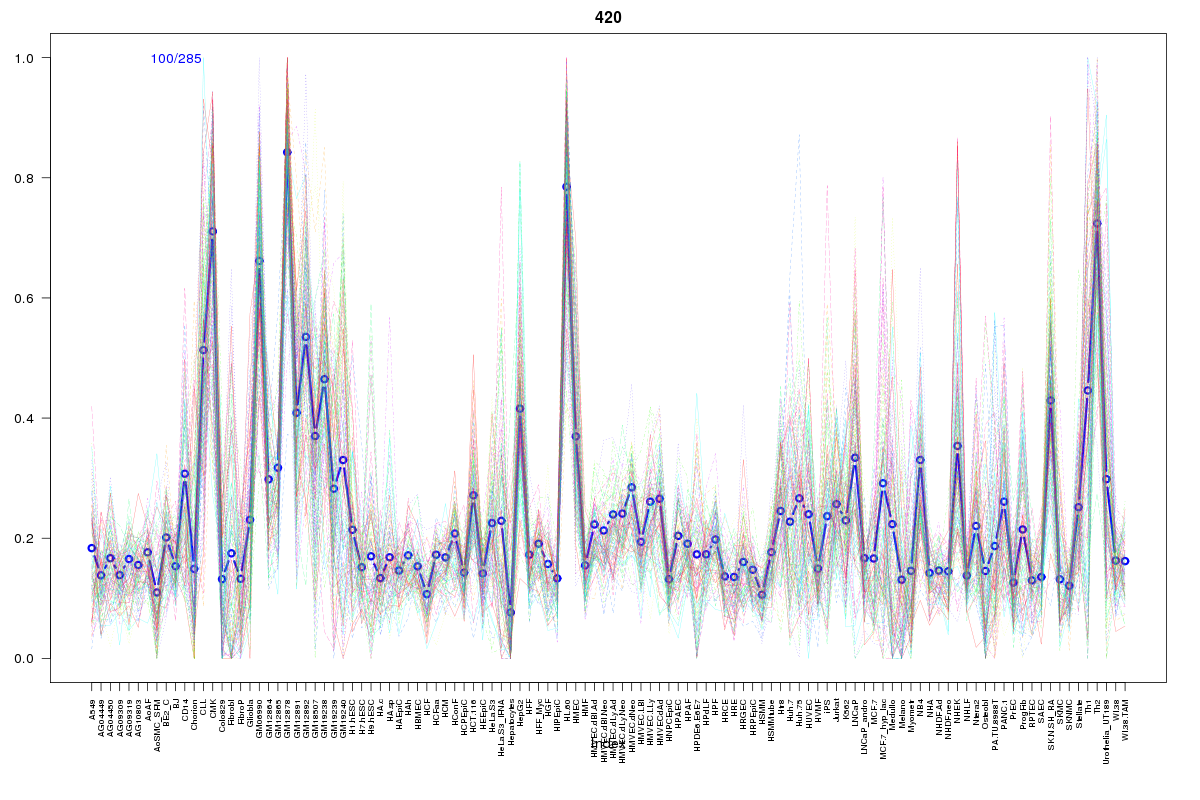 | 420 | 1 |
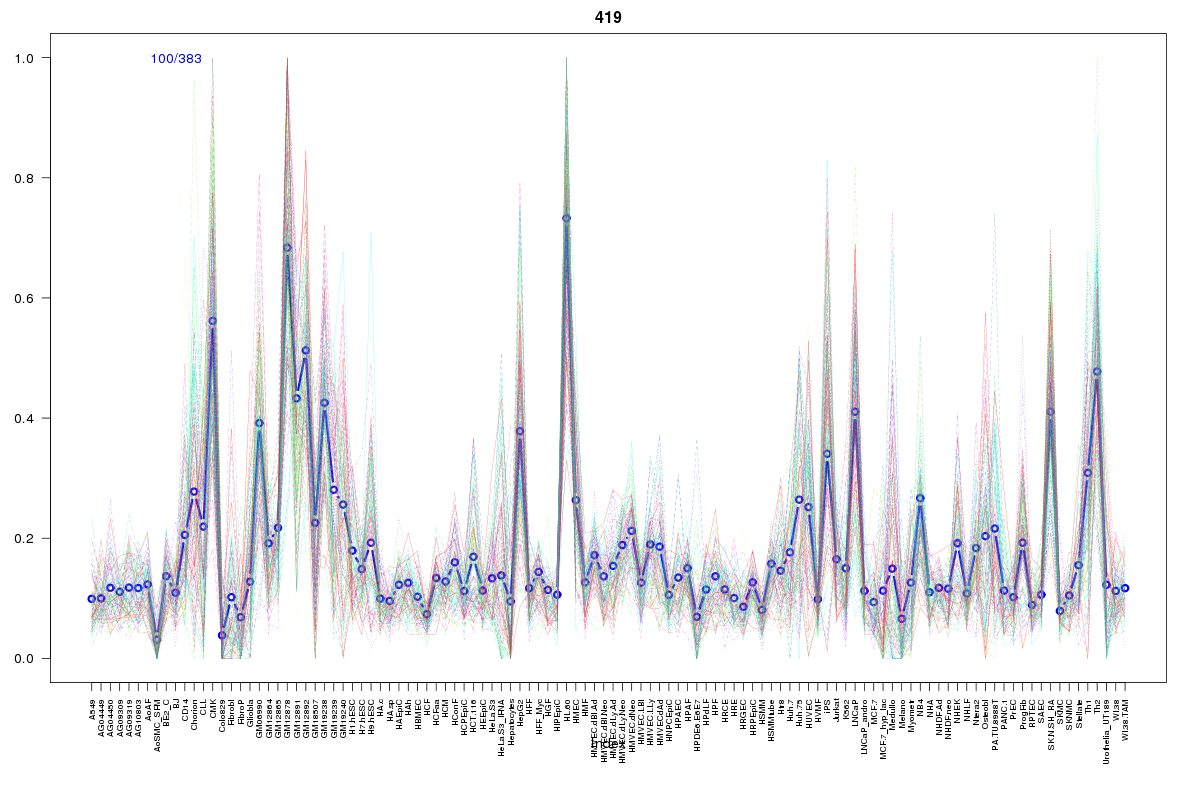 | 419 | 1 |
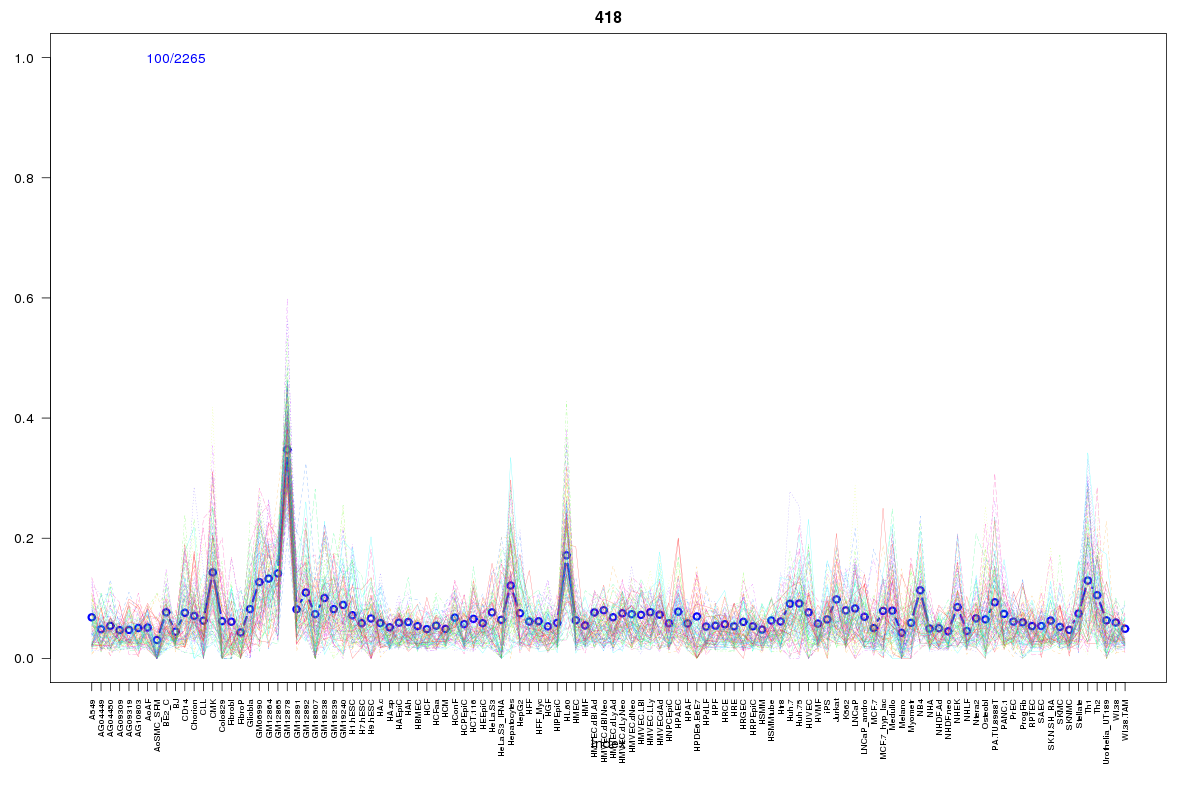 | 418 | 1 |
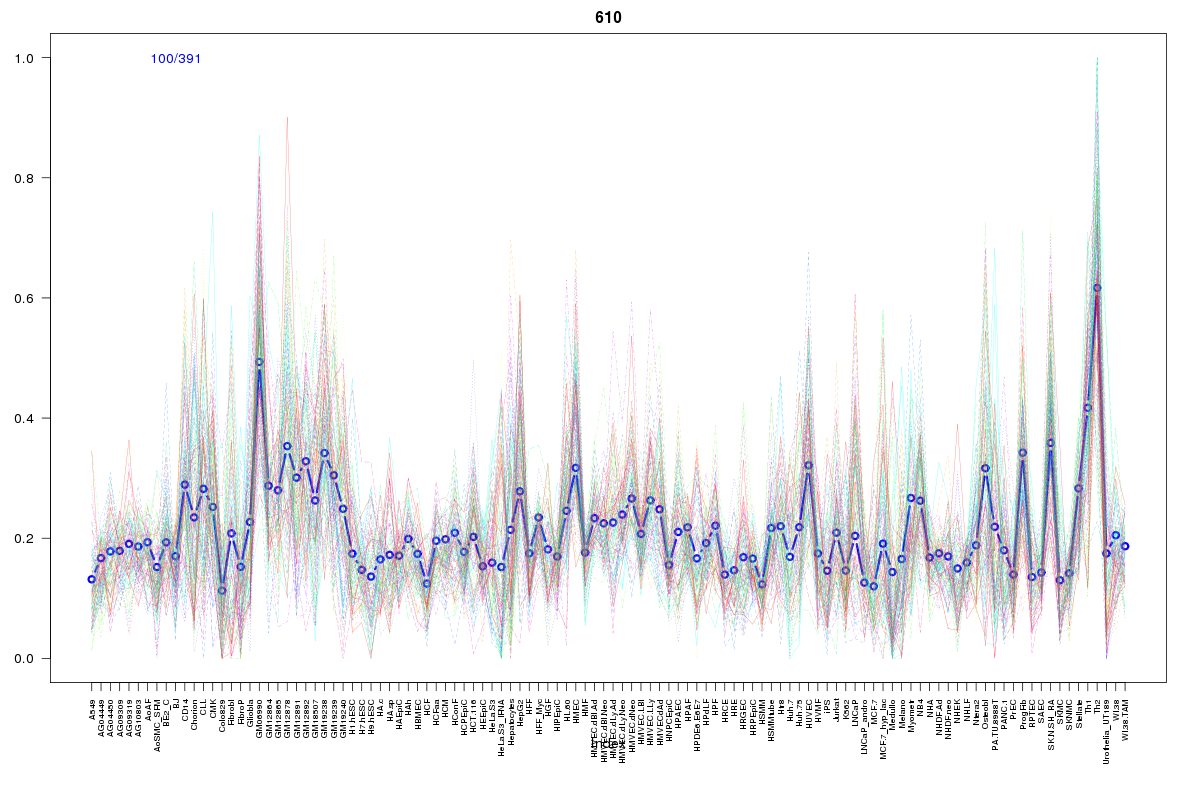 | 610 | 1 |
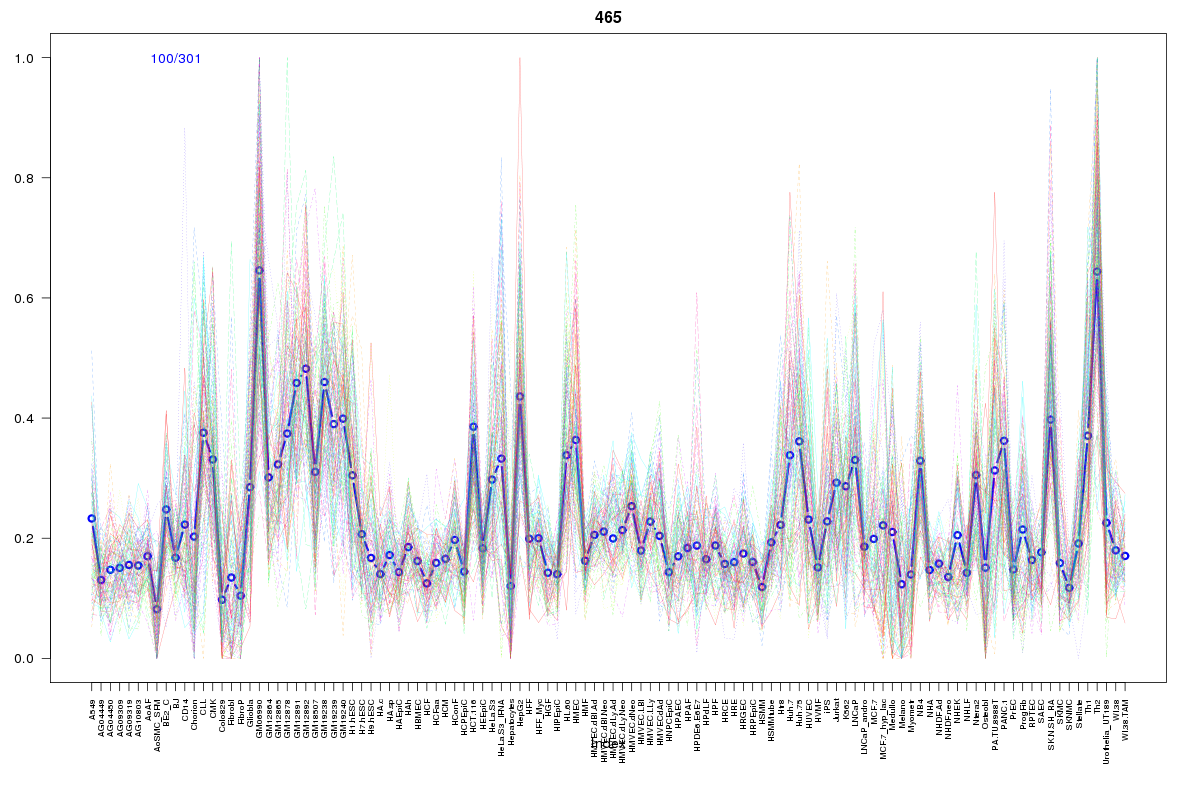 | 465 | 1 |
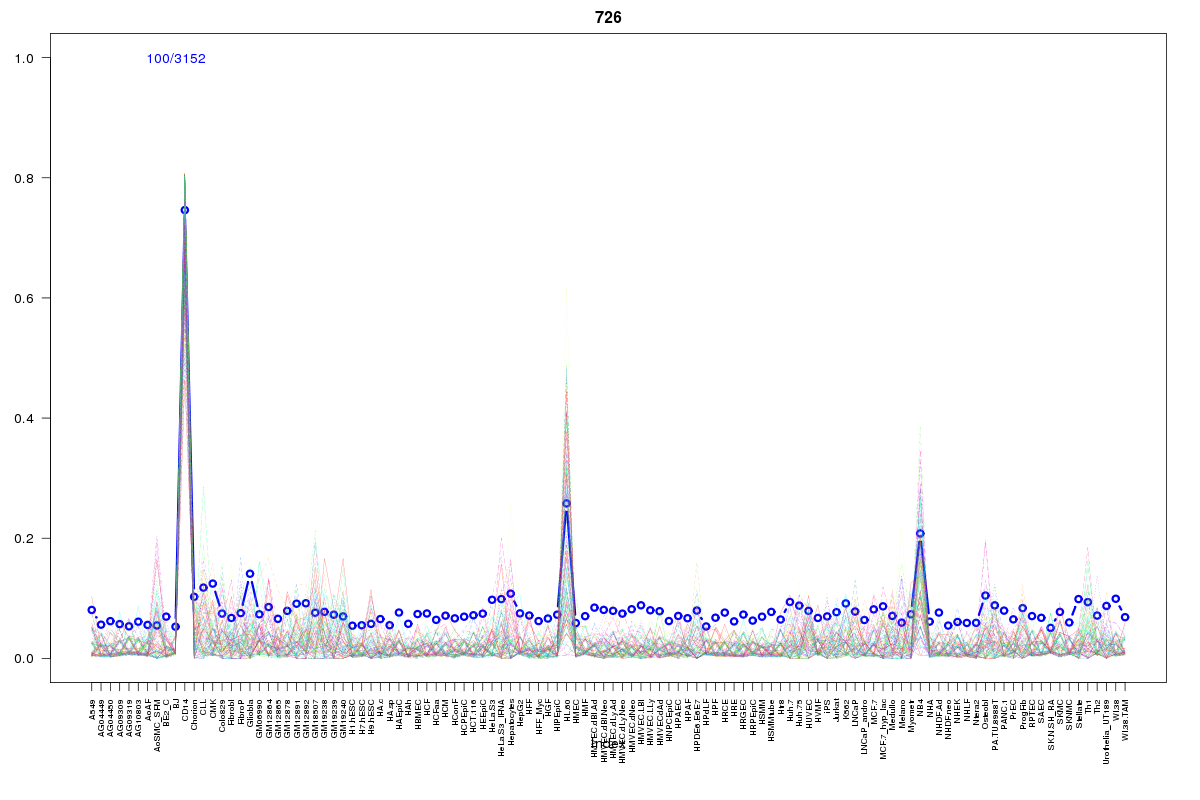 | 726 | 1 |
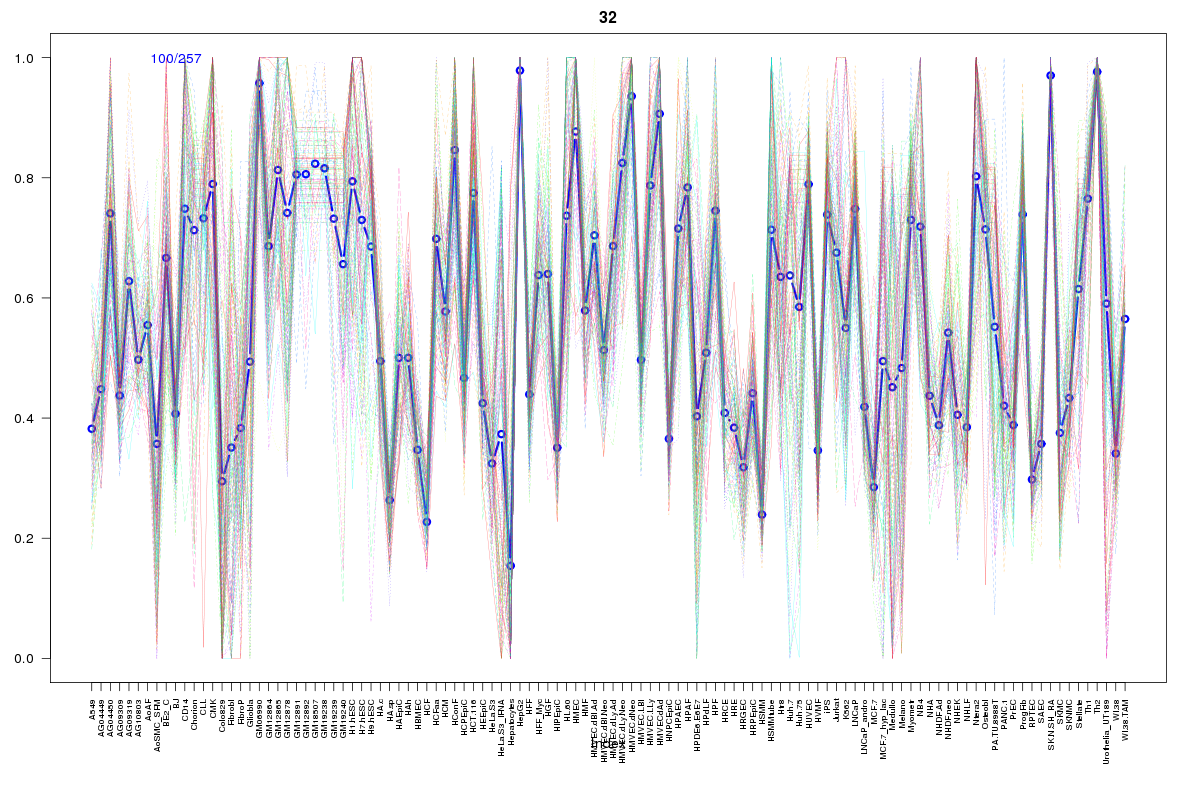 | 32 | 1 |
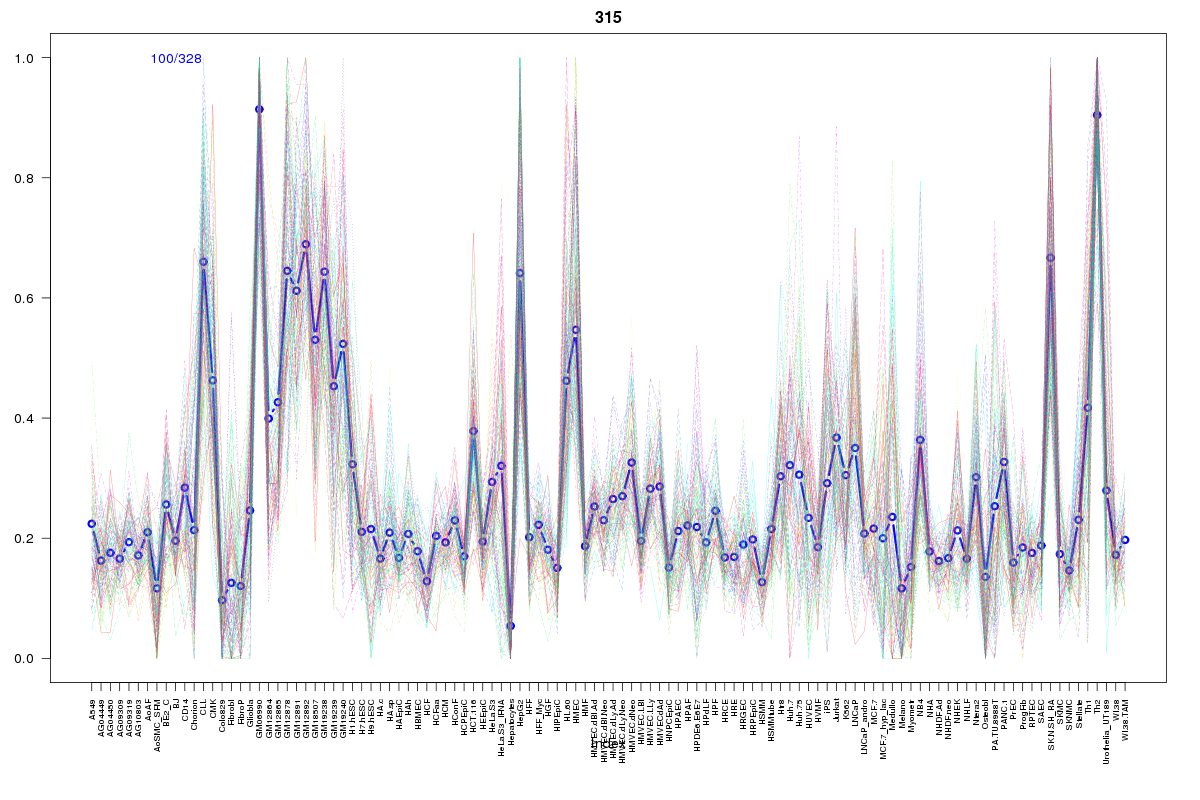 | 315 | 1 |
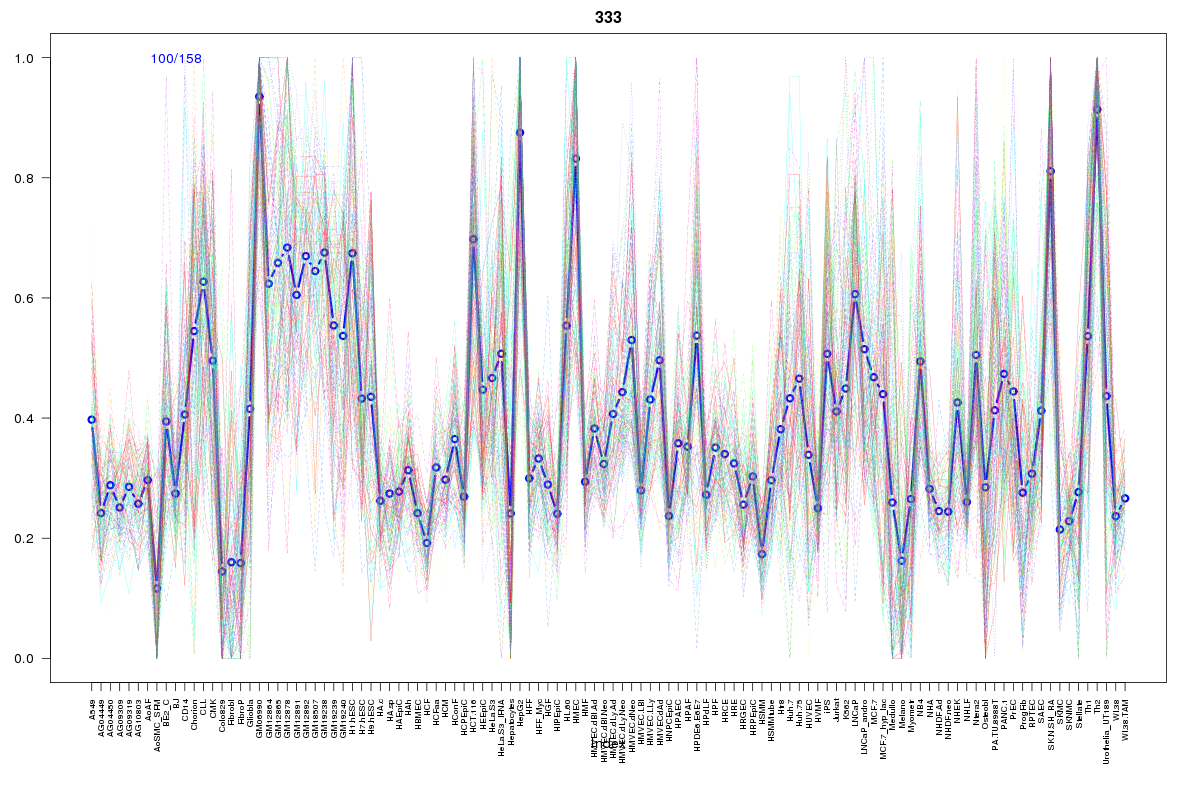 | 333 | 1 |
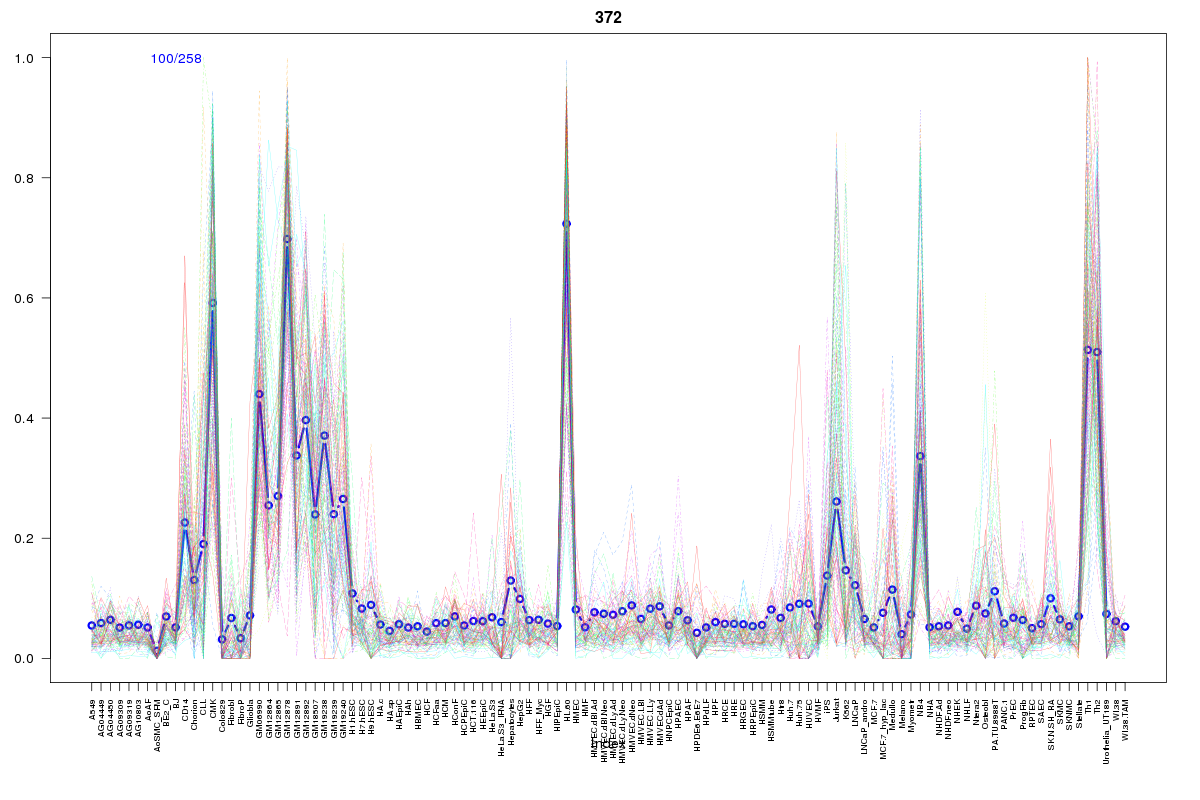 | 372 | 1 |
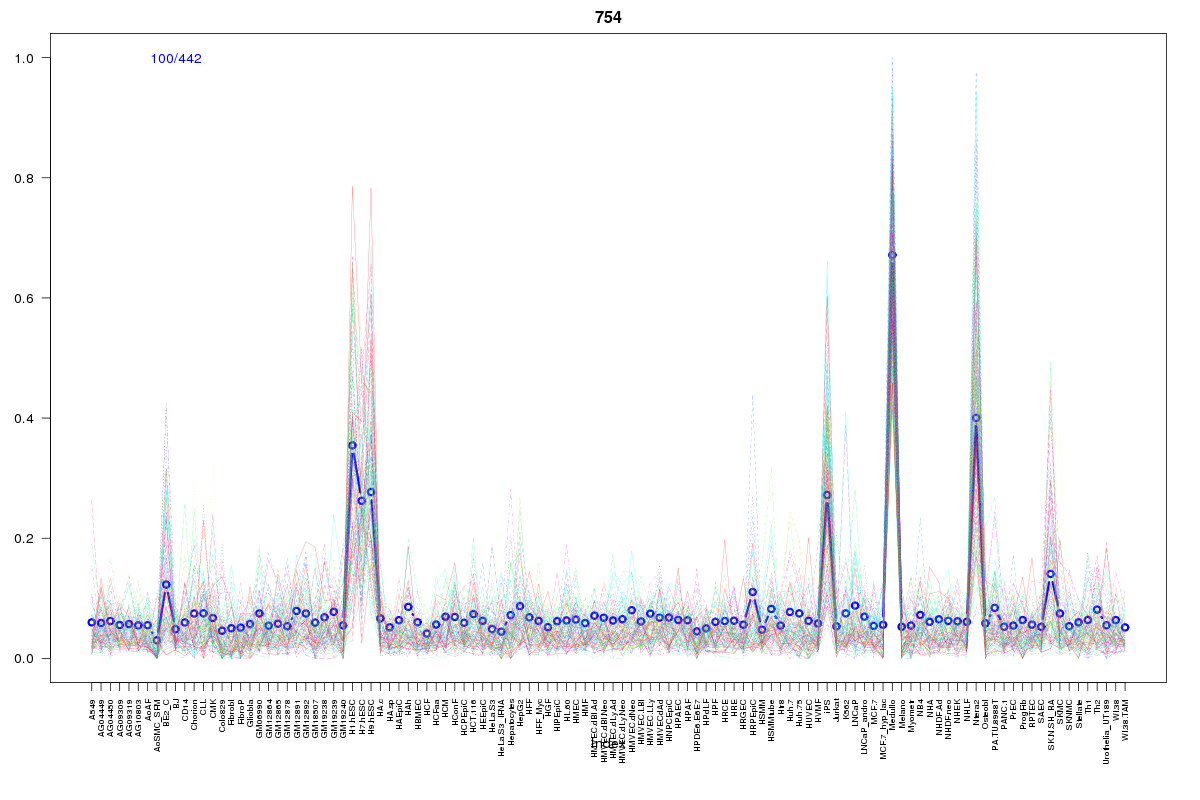 | 754 | 1 |
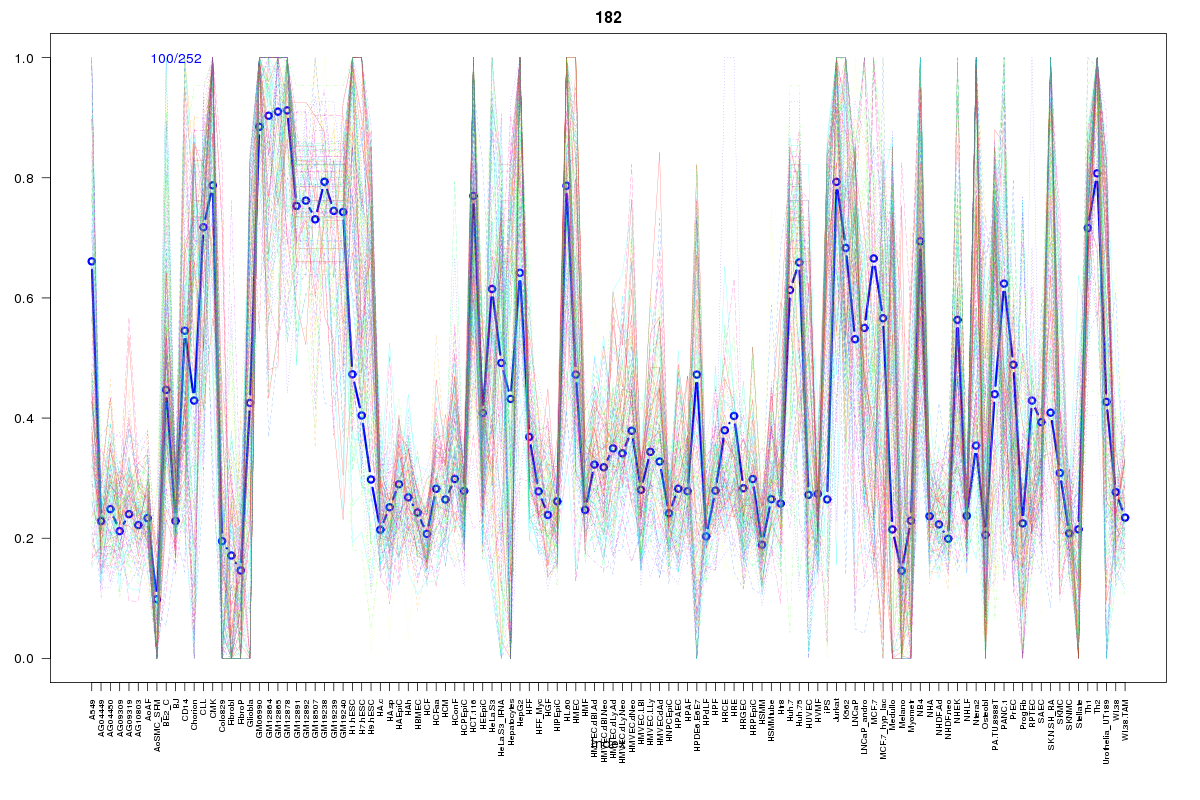 | 182 | 1 |
 | 2122 | 1 |
 | 1265 | 1 |
Resources
BED file downloads
Connects to 42 DHS sitesTop 10 Correlated DHS Sites
p-values indiciate significant higher or lower correlation| Location | Cluster | P-value |
|---|---|---|
| chr12:6869000-6869150 | 756 | 0 |
| chr12:6955600-6955750 | 756 | 0.004 |
| chr12:6957000-6957150 | 756 | 0.004 |
| chr12:7012020-7012170 | 756 | 0.011 |
| chr12:7012720-7012870 | 756 | 0.011 |
| chr12:6907960-6908110 | 655 | 0.013 |
| chr12:6949385-6949535 | 756 | 0.013 |
| chr12:6970125-6970275 | 655 | 0.015 |
| chr12:6992805-6992955 | 856 | 0.015 |
| chr12:7029305-7029455 | 756 | 0.015 |
| chr12:6939900-6940050 | 756 | 0.018 |
External Databases
UCSCEnsembl (ENSG00000111664)