Gene: TLR9
chr3: 52255096-52265206Expression Profile
(log scale)
Graphical Connections
Distribution of linked clusters:
You may find it interesting if many of the connected DHS sites belong to the same cluster.| Cluster Profile | Cluster ID | Number of DHS sites in this cluster |
|---|---|---|
 | 1755 | 7 |
 | 2062 | 2 |
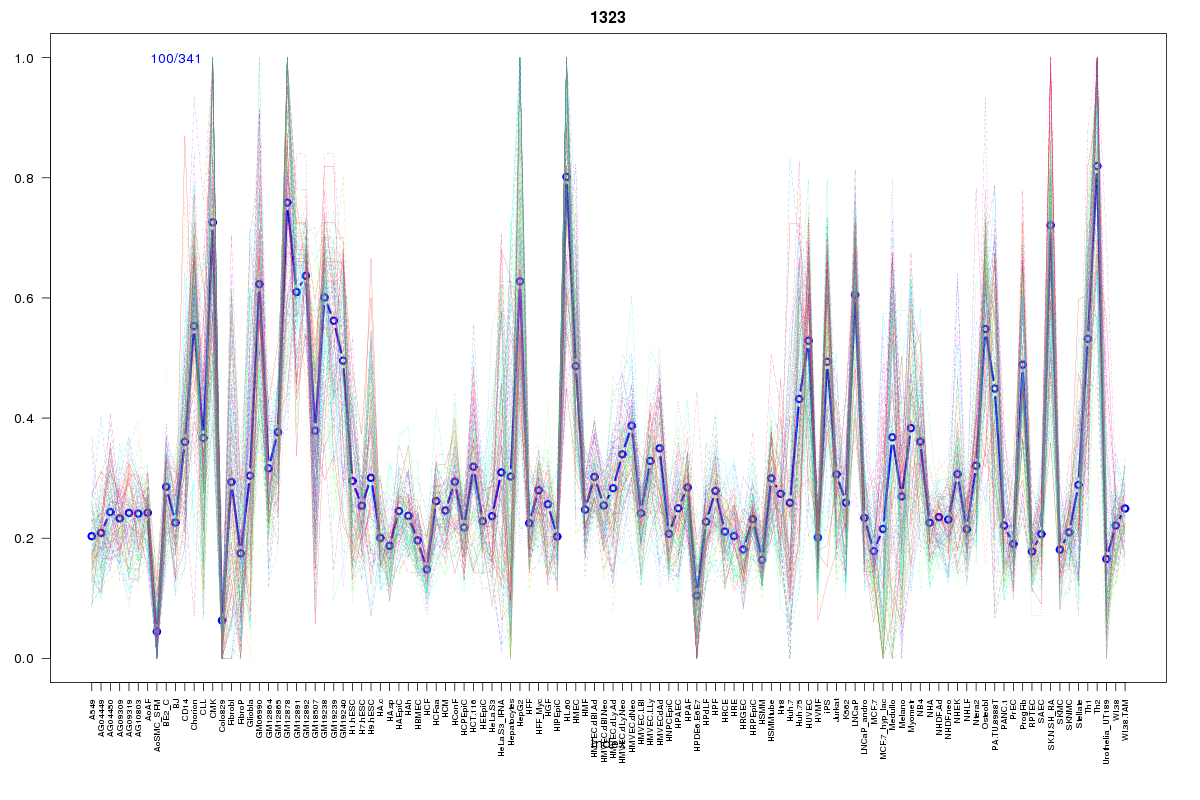 | 1323 | 2 |
 | 2072 | 2 |
 | 2170 | 1 |
 | 2216 | 1 |
 | 881 | 1 |
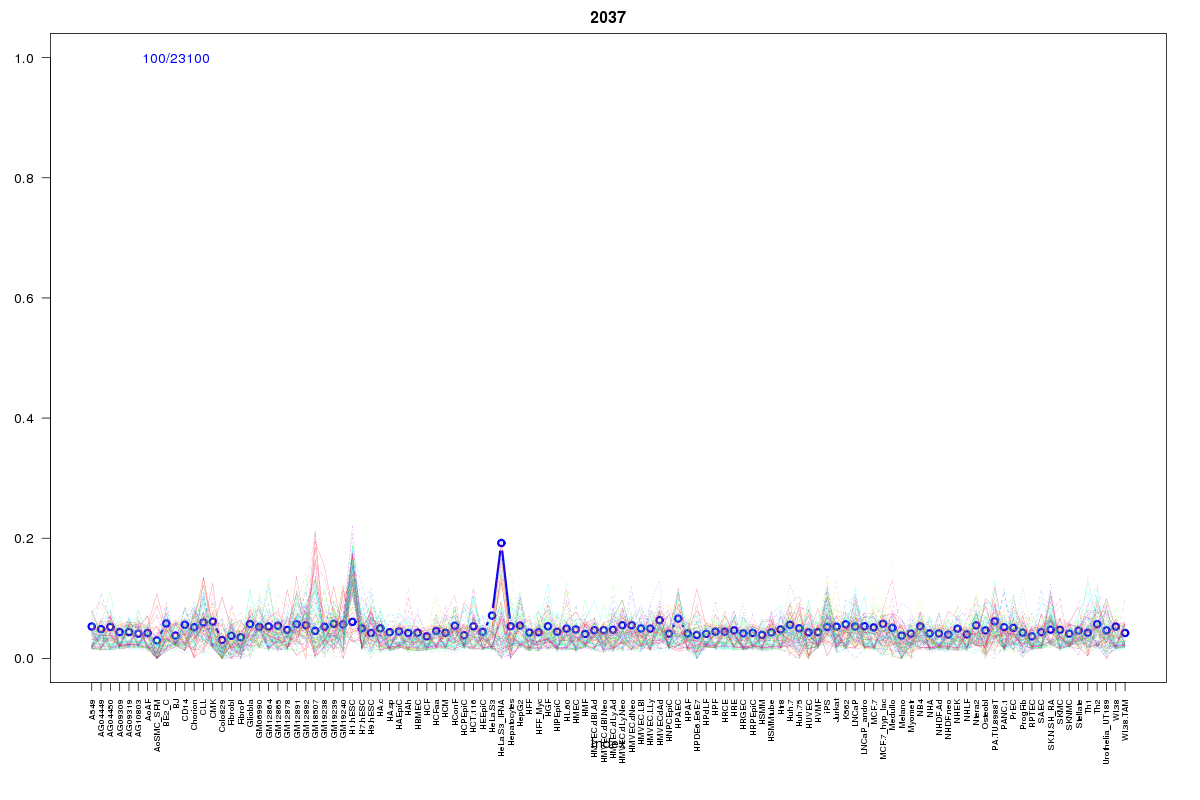 | 2037 | 1 |
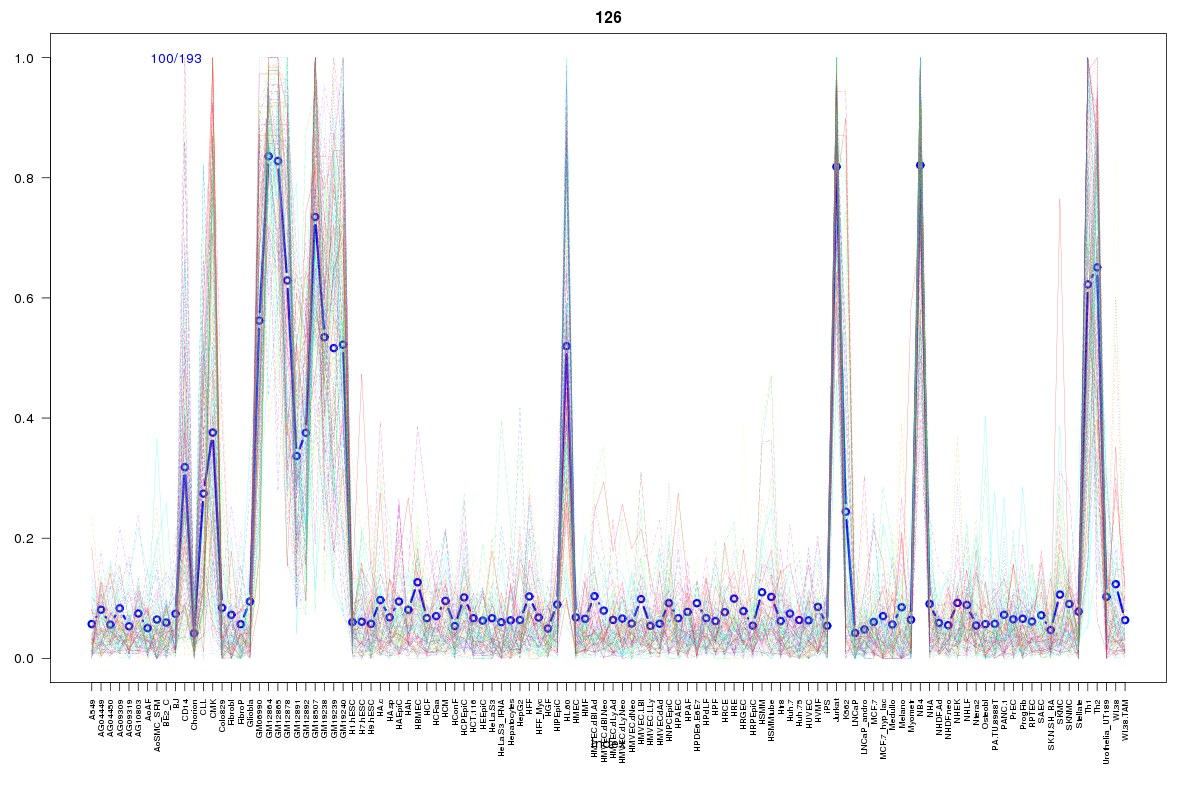 | 126 | 1 |
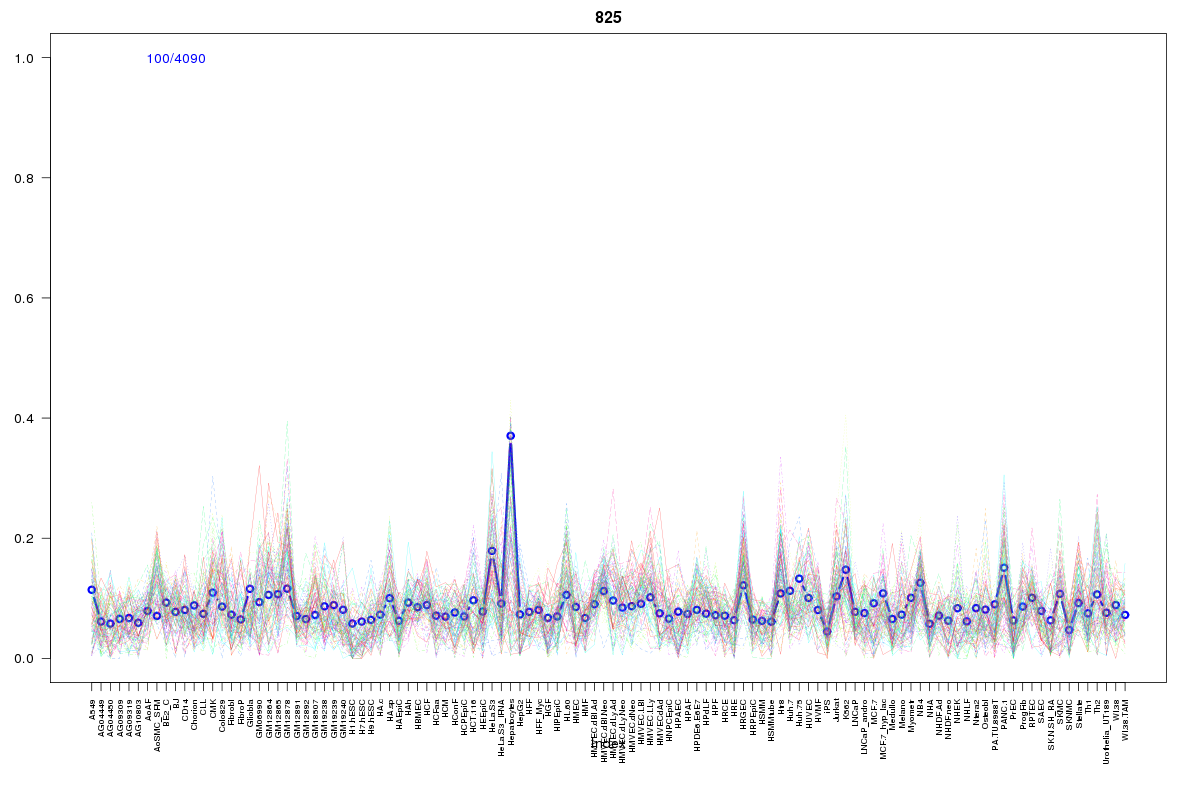 | 825 | 1 |
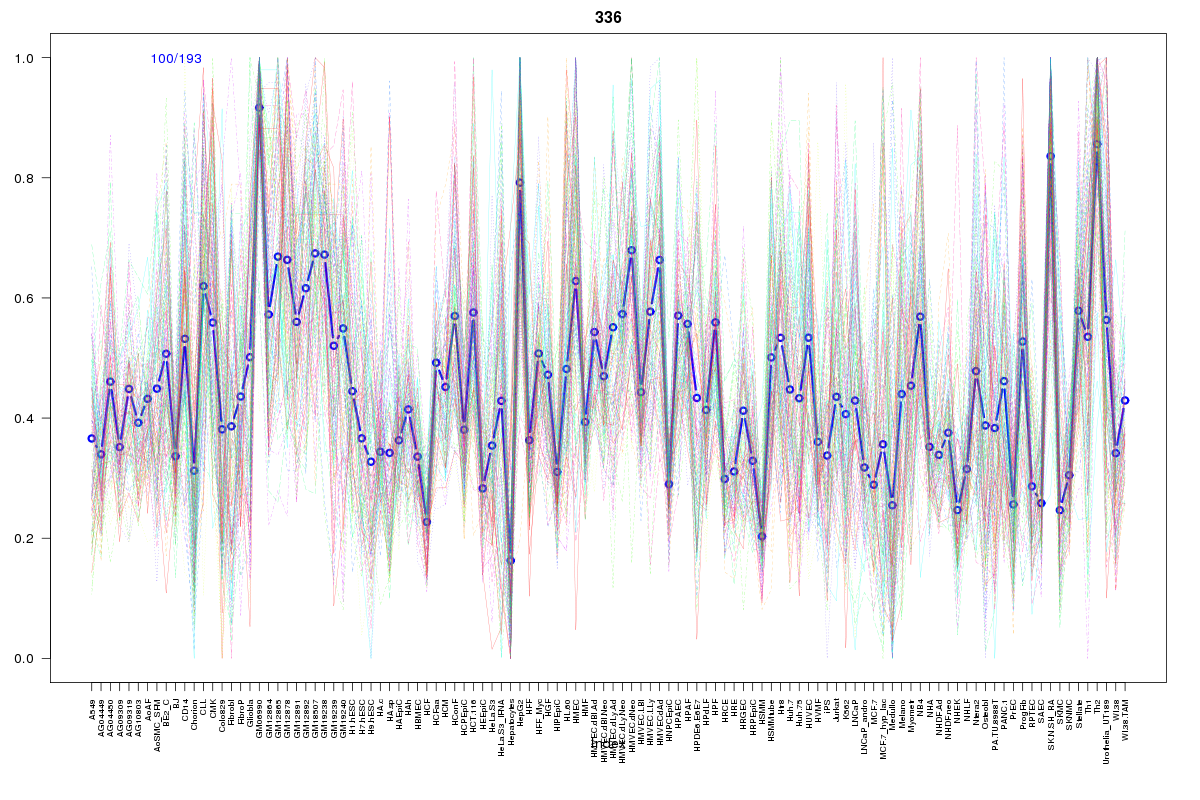 | 336 | 1 |
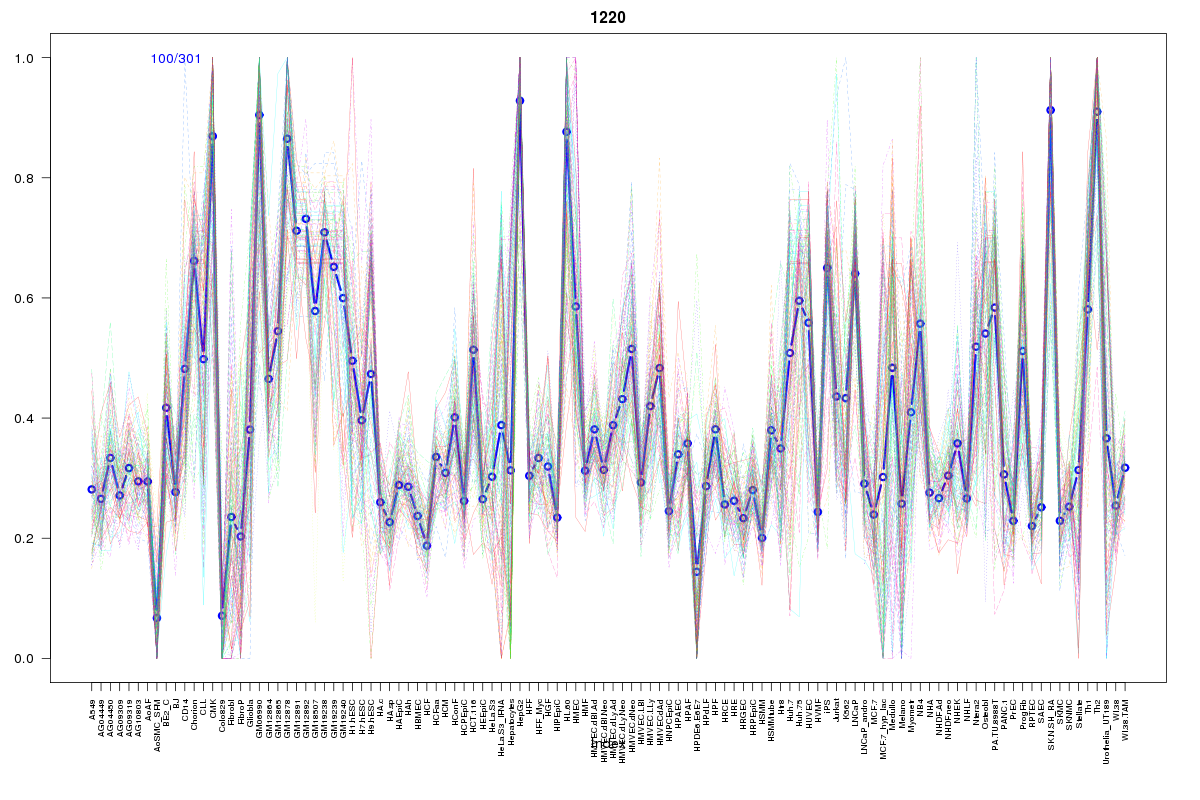 | 1220 | 1 |
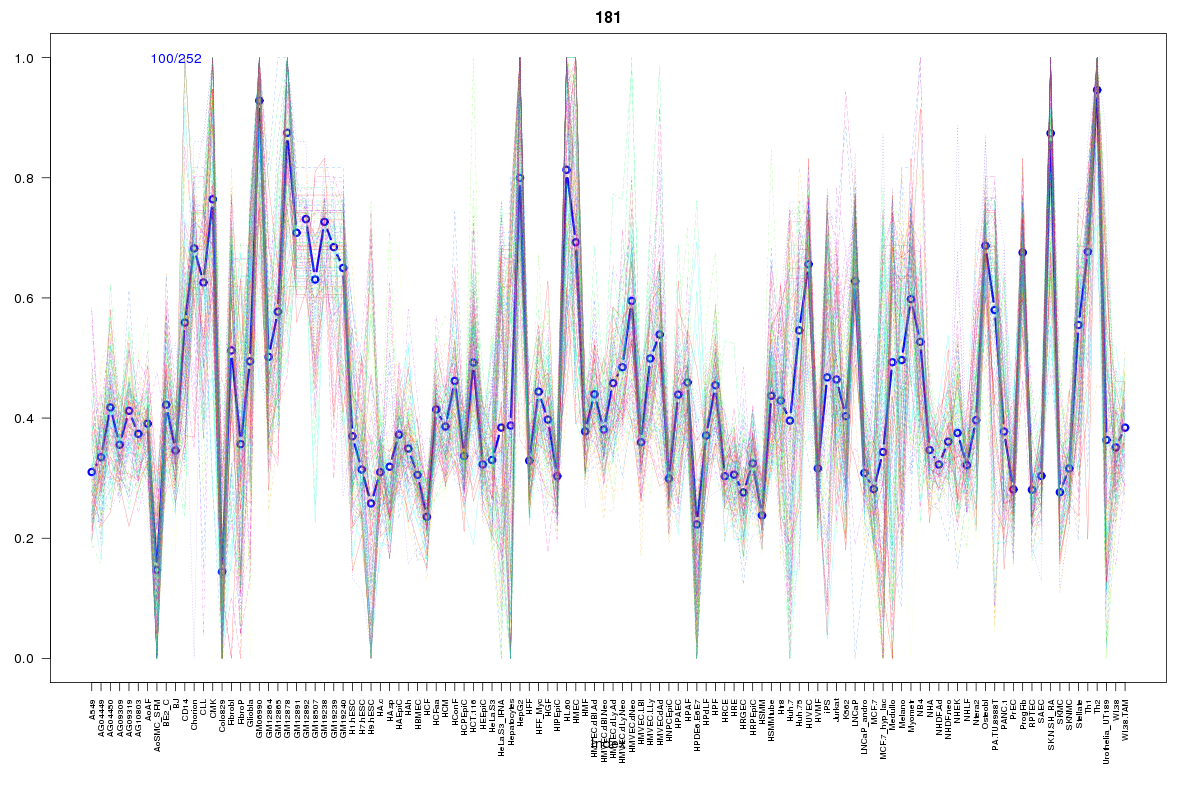 | 181 | 1 |
 | 283 | 1 |
 | 282 | 1 |
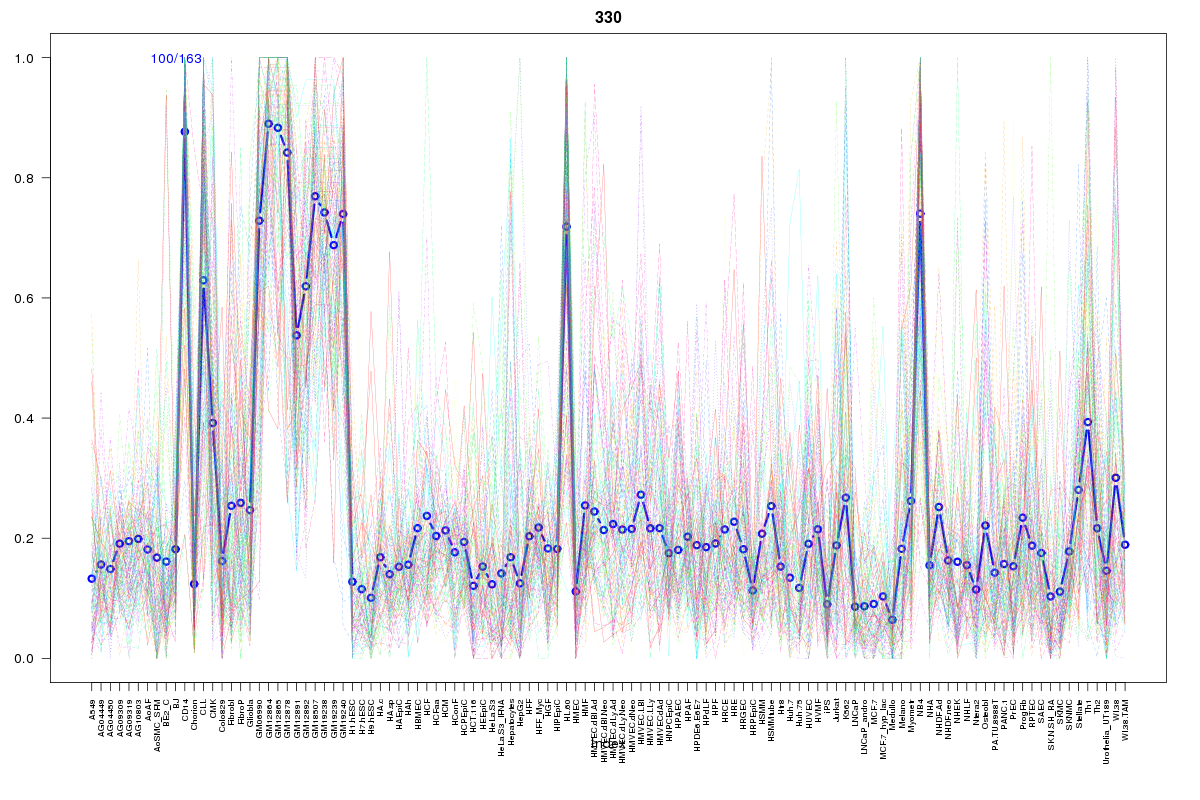 | 330 | 1 |
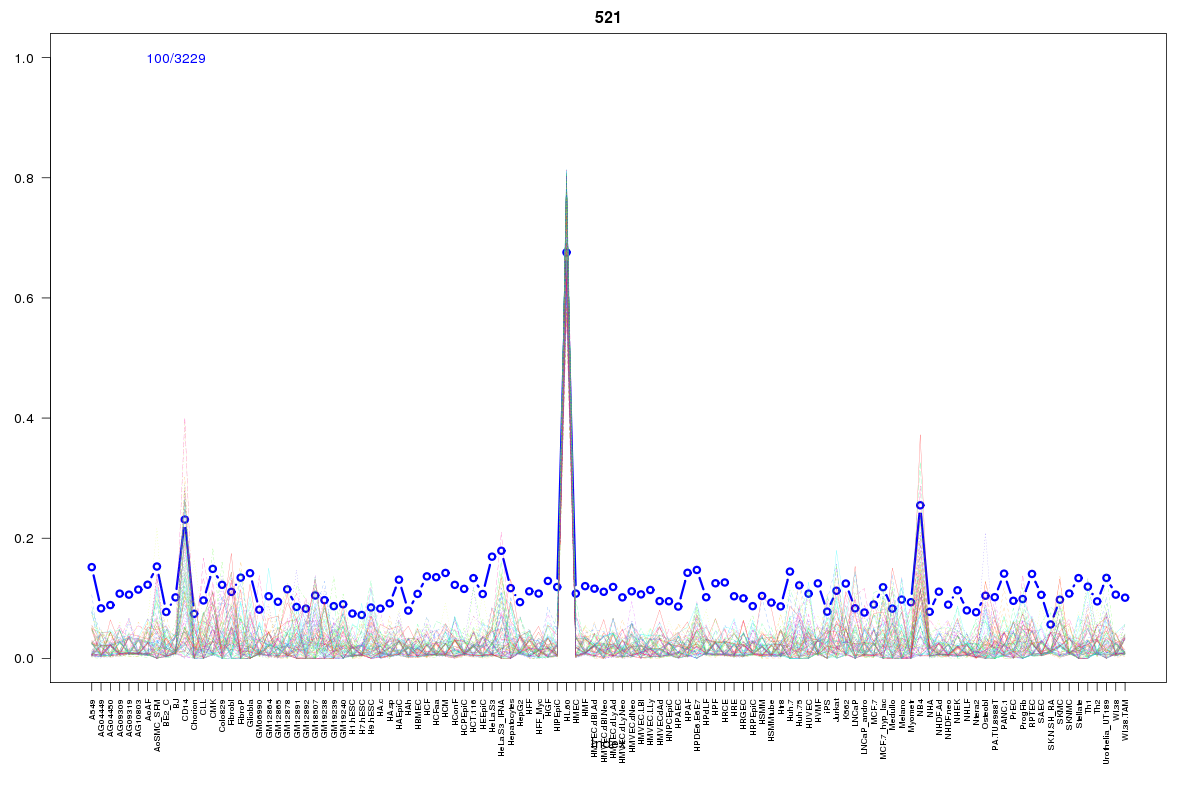 | 521 | 1 |
 | 130 | 1 |
 | 1970 | 1 |
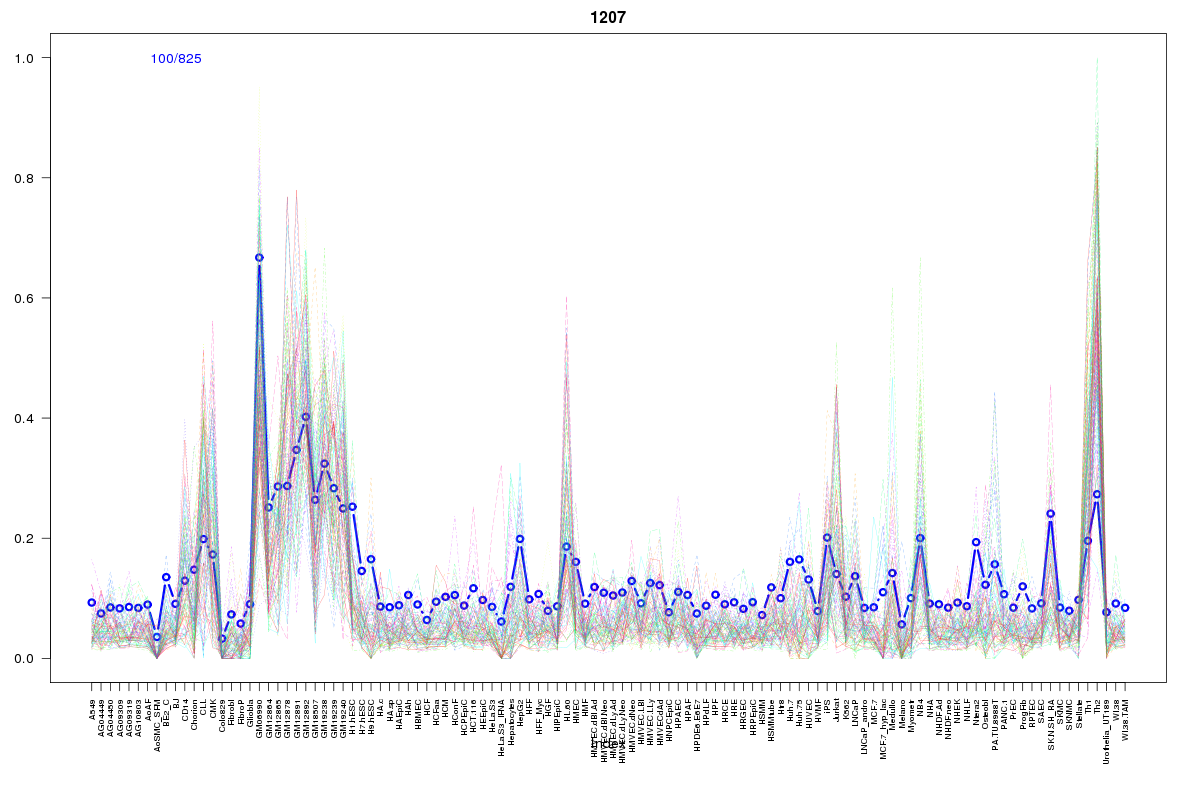 | 1207 | 1 |
 | 1011 | 1 |
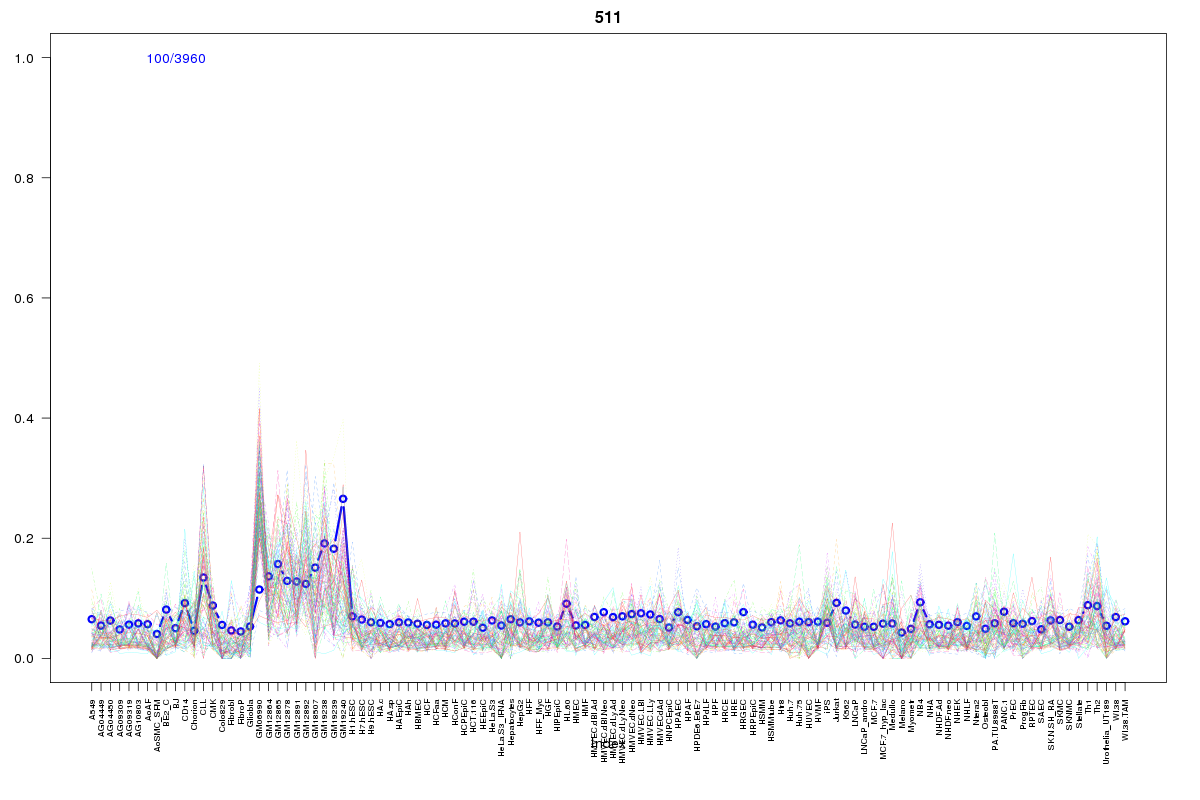 | 511 | 1 |
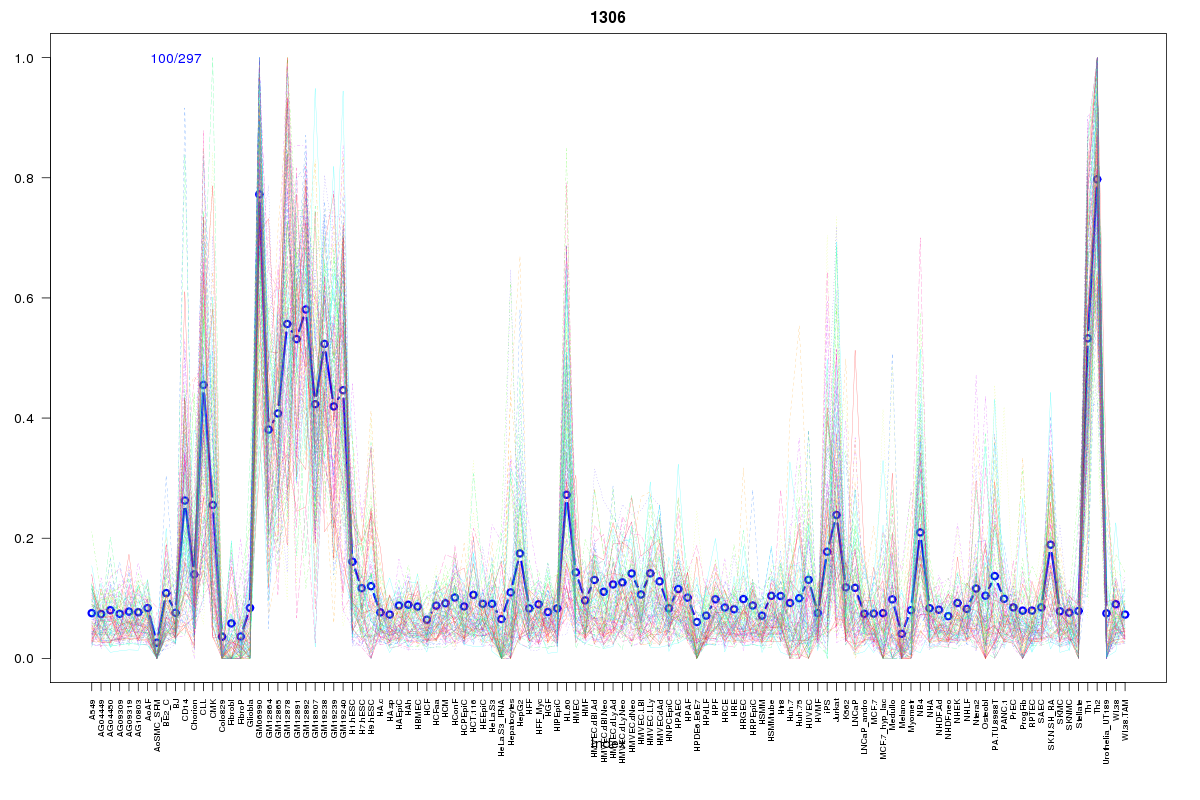 | 1306 | 1 |
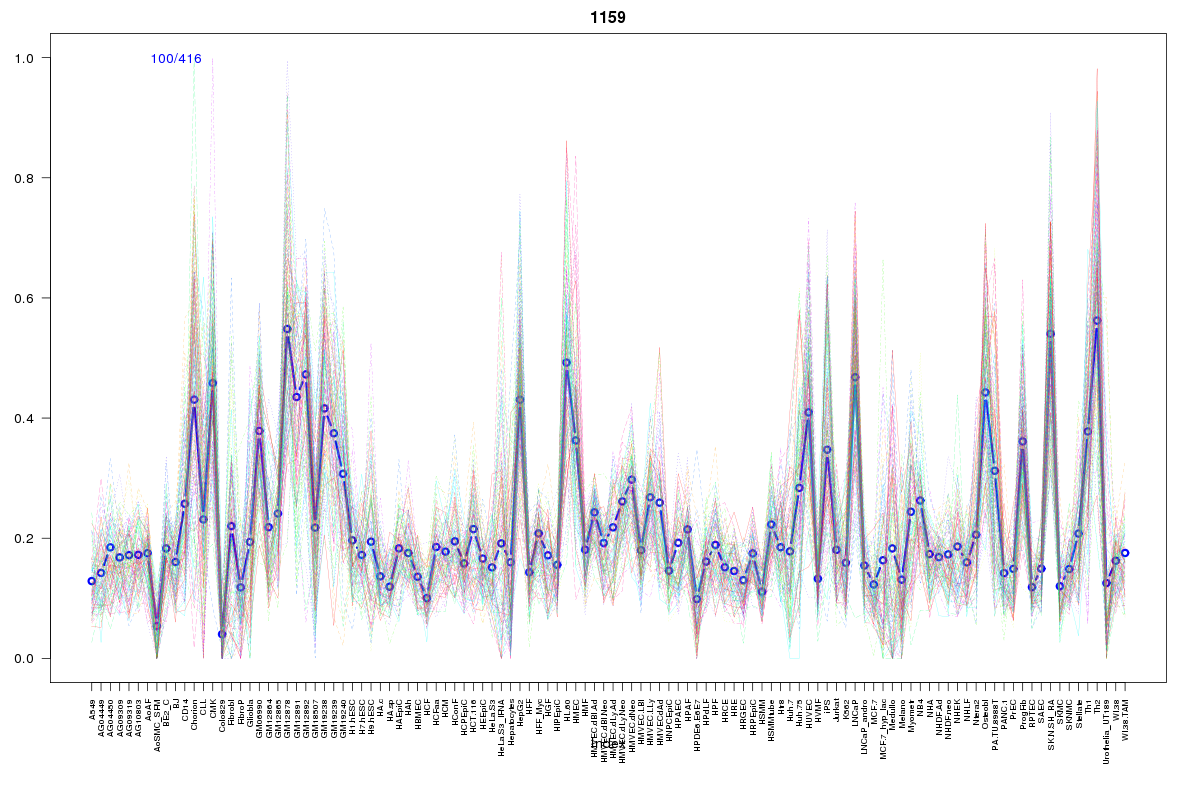 | 1159 | 1 |
 | 15 | 1 |
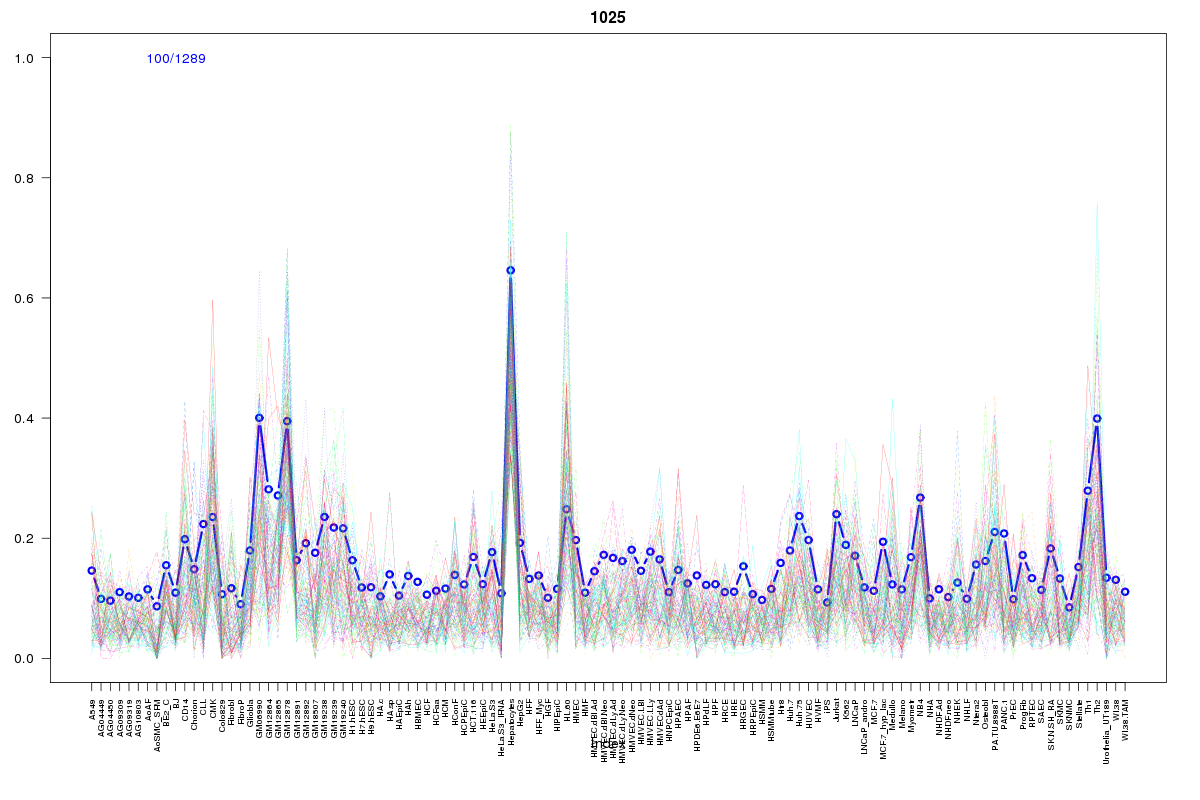 | 1025 | 1 |
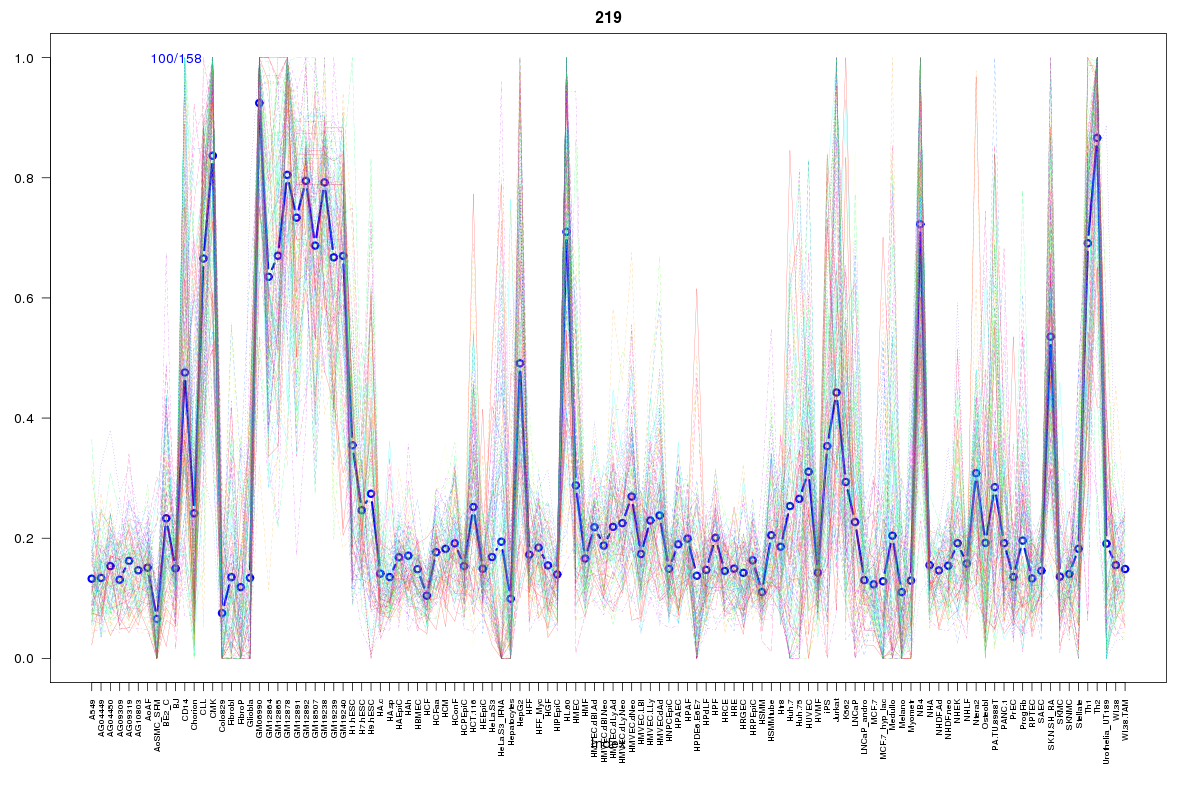 | 219 | 1 |
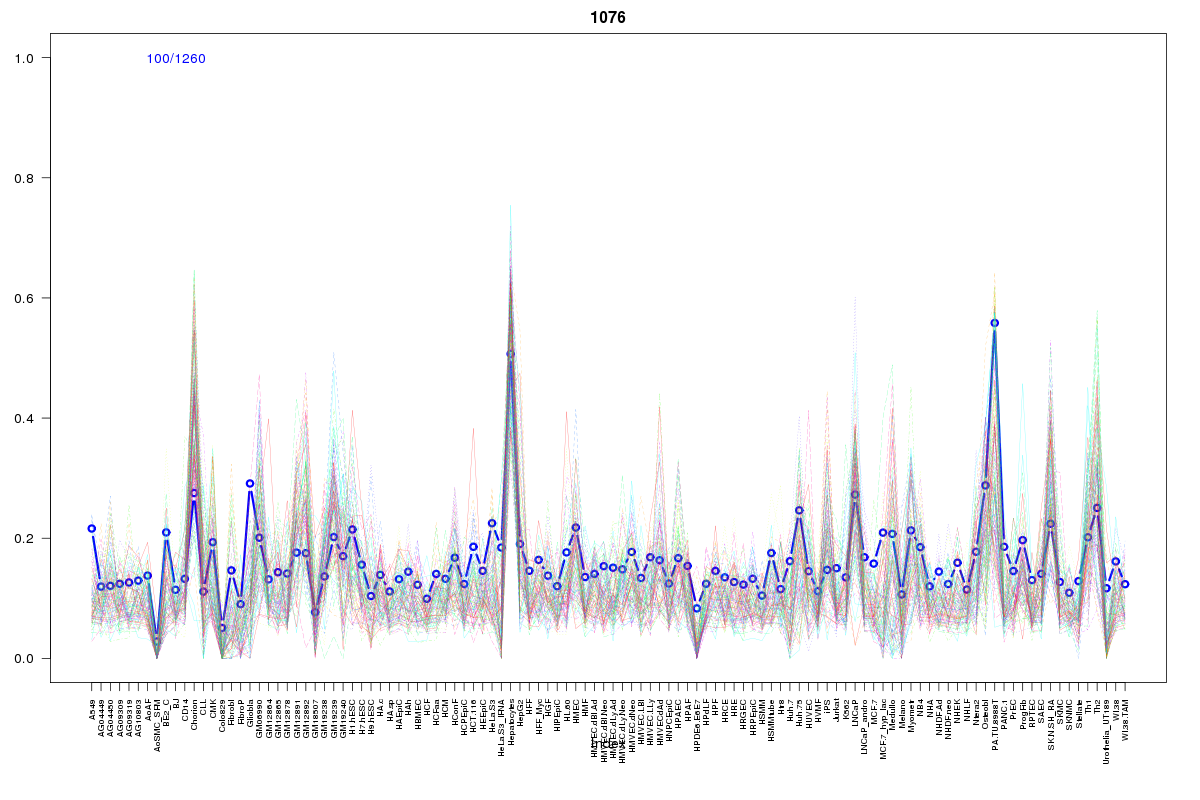 | 1076 | 1 |
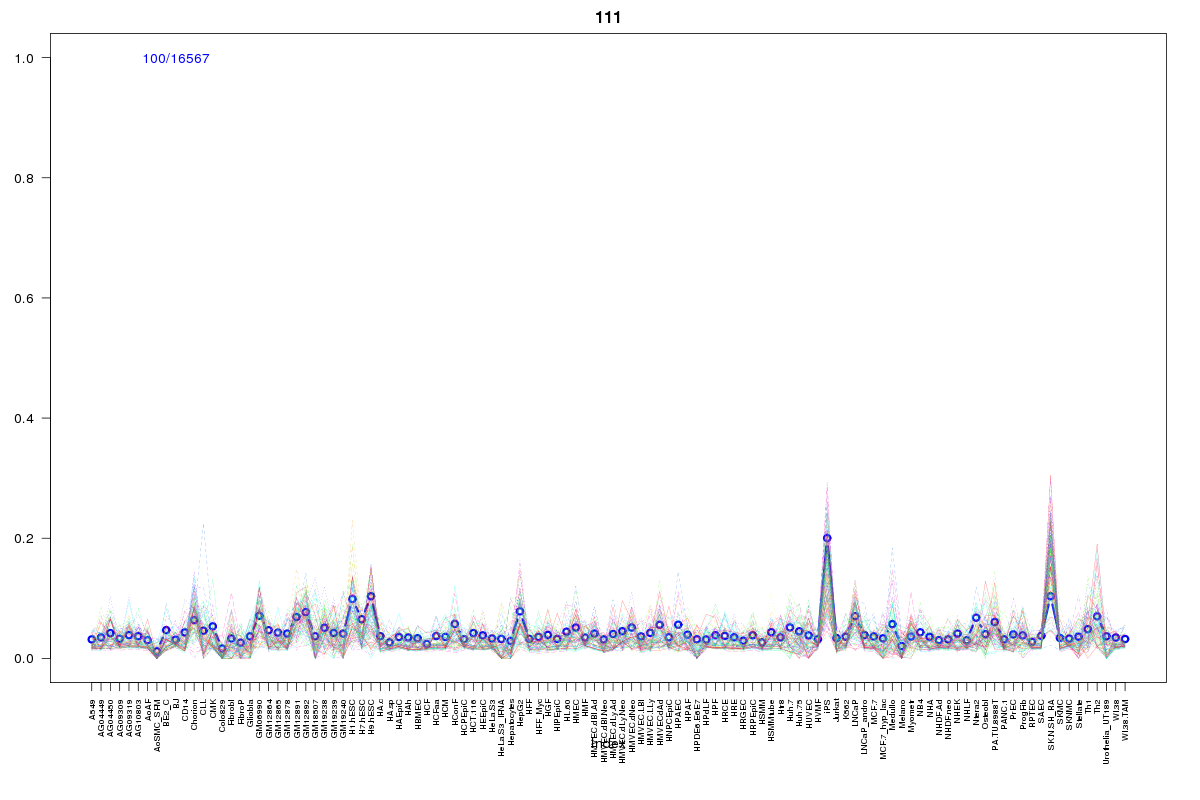 | 111 | 1 |
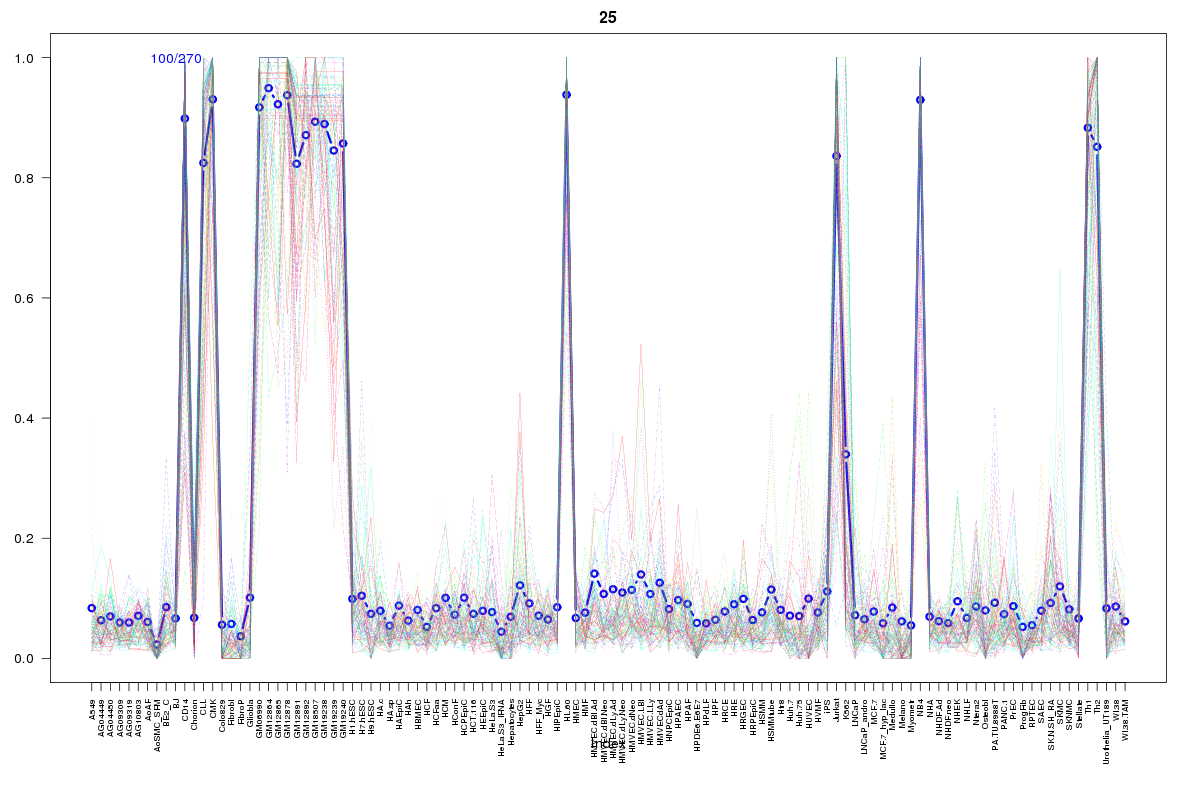 | 25 | 1 |
 | 1078 | 1 |
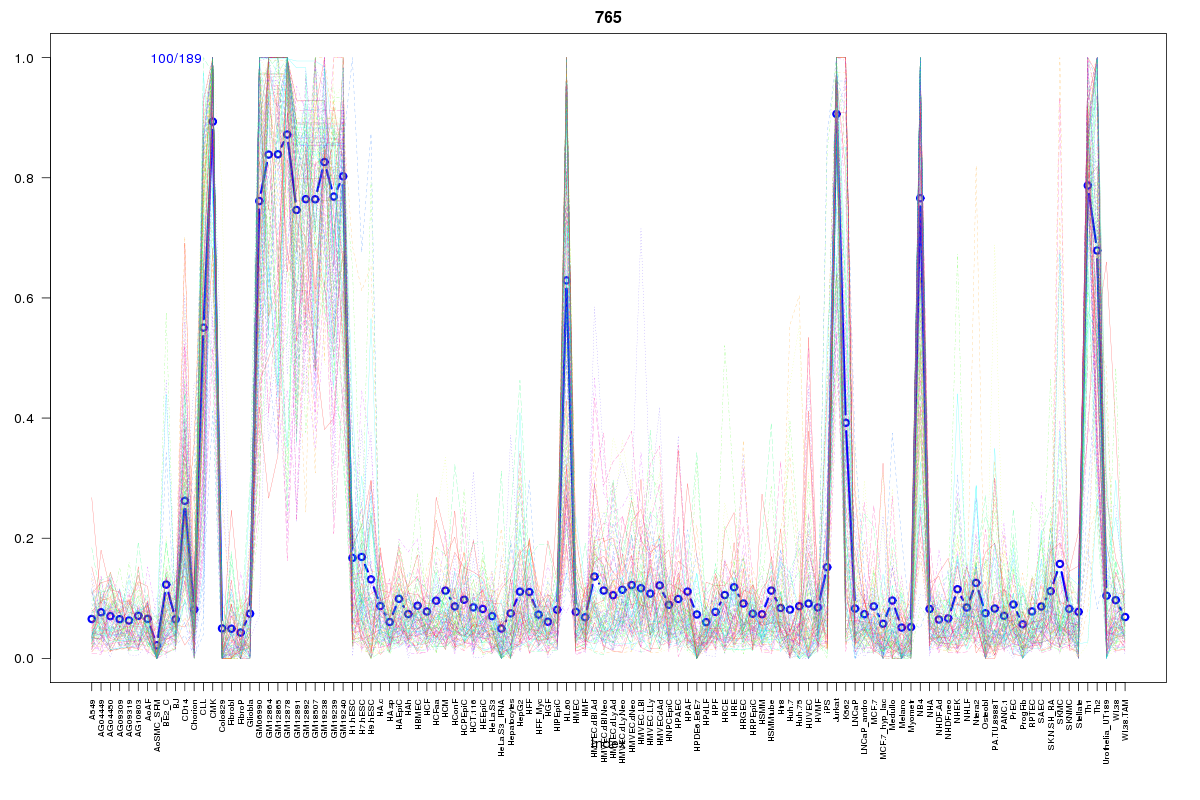 | 765 | 1 |
Resources
BED file downloads
Connects to 41 DHS sitesTop 10 Correlated DHS Sites
p-values indiciate significant higher or lower correlation| Location | Cluster | P-value |
|---|---|---|
| chr3:52305480-52305630 | 2062 | 0 |
| chr3:52256440-52256590 | 881 | 0.003 |
| chr3:52279320-52279470 | 1306 | 0.003 |
| chr3:52306660-52306810 | 1755 | 0.003 |
| chr3:52207345-52207495 | 1755 | 0.005 |
| chr3:52256020-52256170 | 1078 | 0.01 |
| chr3:52311680-52311830 | 336 | 0.01 |
| chr3:52287605-52287755 | 765 | 0.011 |
| chr3:52180725-52180875 | 1755 | 0.011 |
| chr3:52314605-52314755 | 1755 | 0.012 |
| chr3:52316000-52316150 | 521 | 0.012 |
External Databases
UCSCEnsembl (ENSG00000173366)