Gene: TTI1
chr20: 36611408-36661870Expression Profile
(log scale)
Graphical Connections
Distribution of linked clusters:
You may find it interesting if many of the connected DHS sites belong to the same cluster.| Cluster Profile | Cluster ID | Number of DHS sites in this cluster |
|---|---|---|
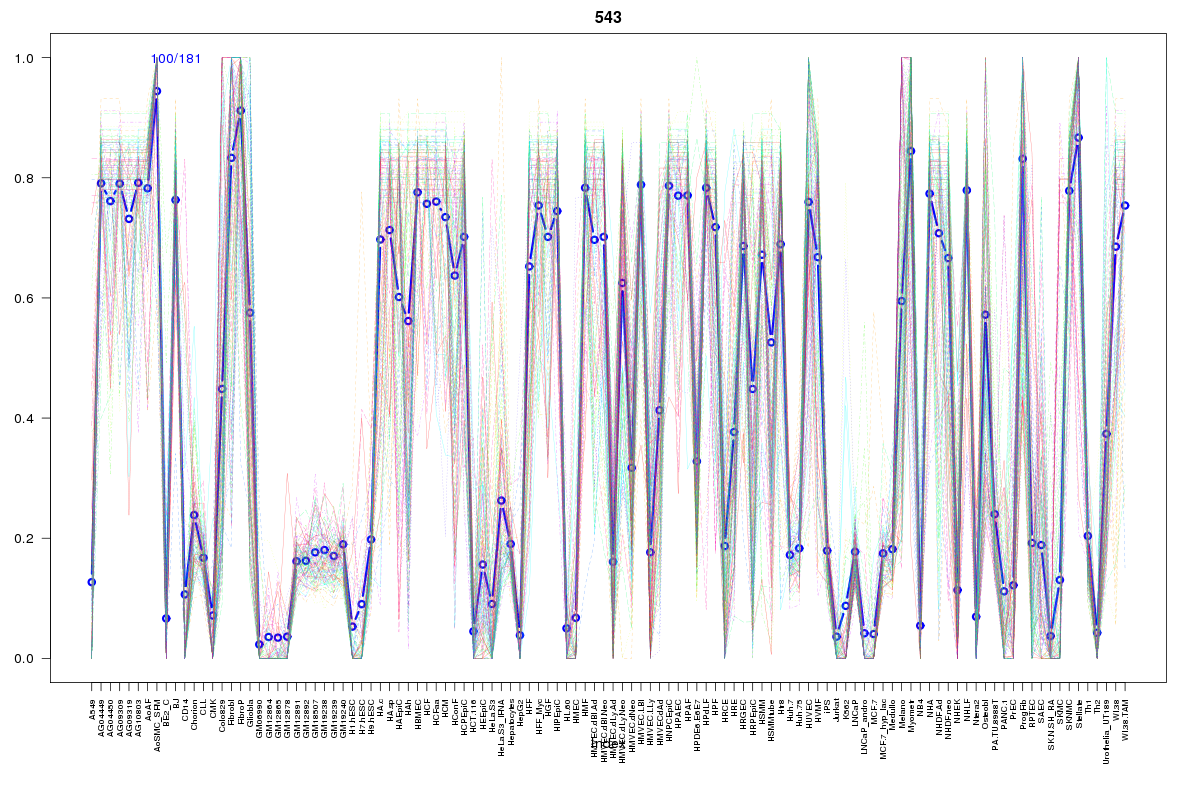 | 543 | 2 |
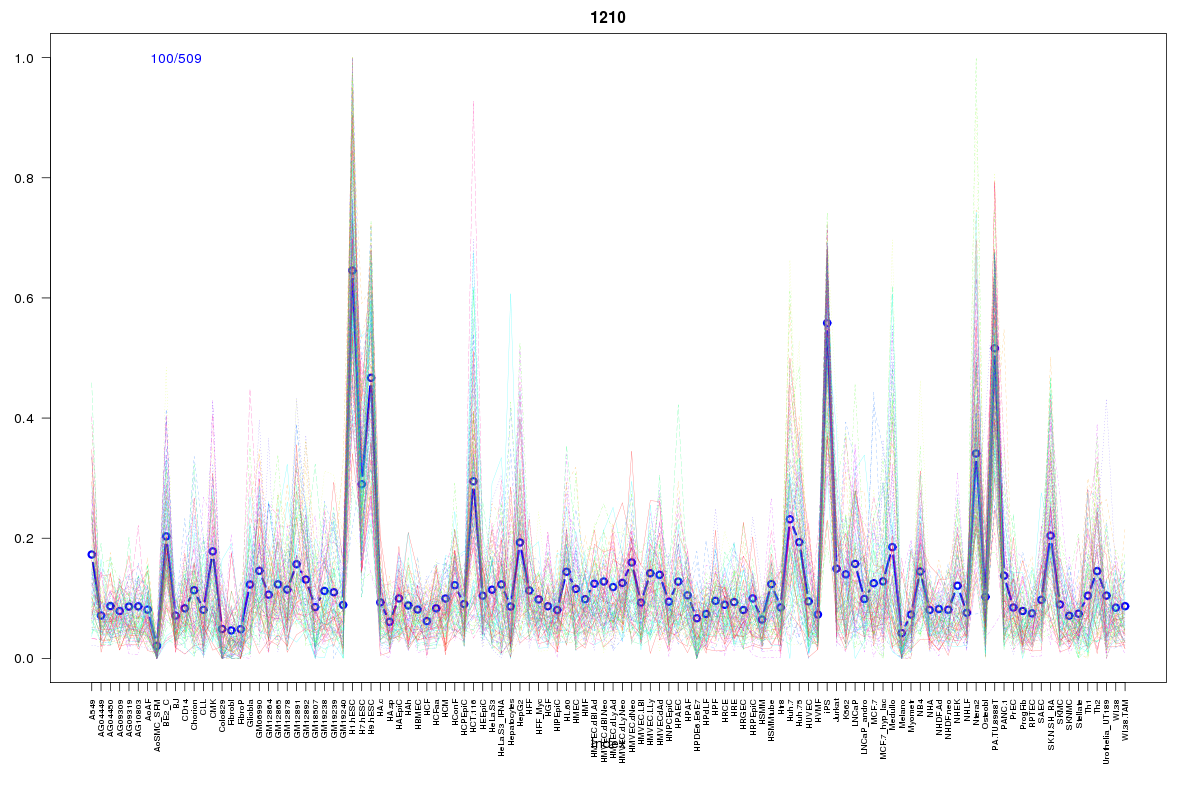 | 1210 | 2 |
 | 2114 | 2 |
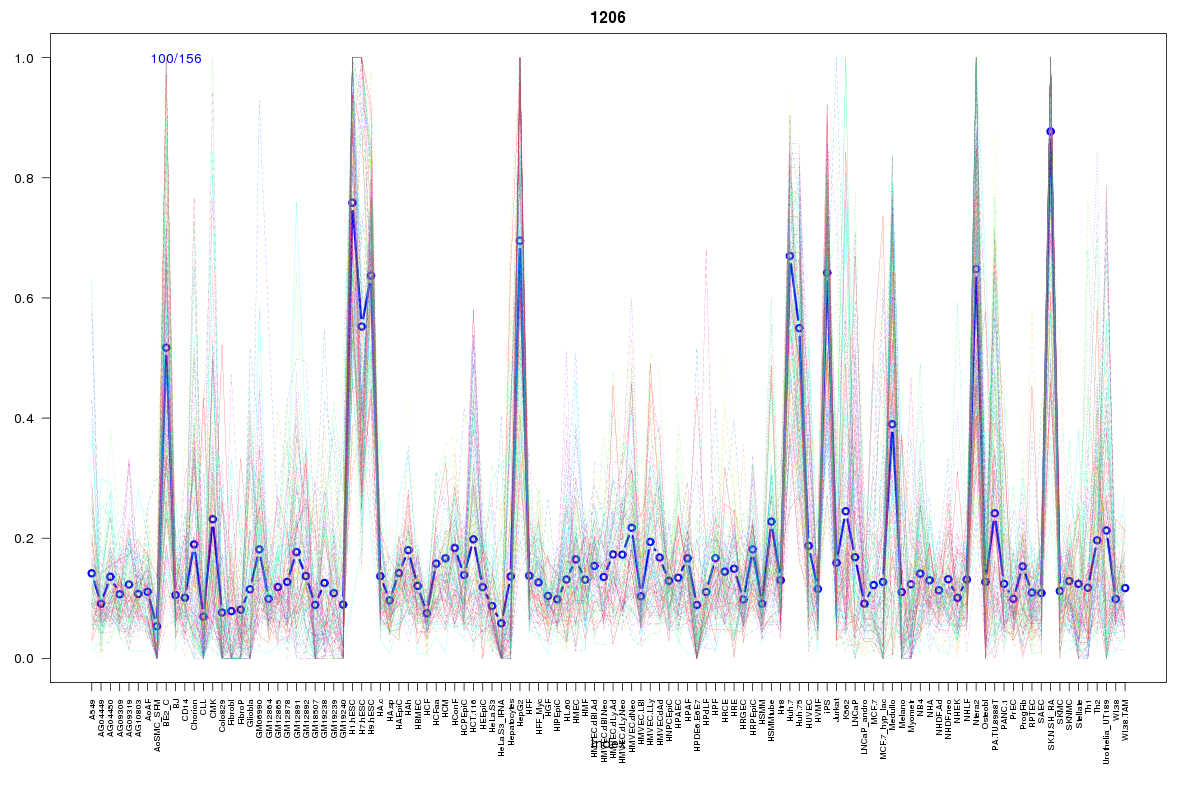 | 1206 | 2 |
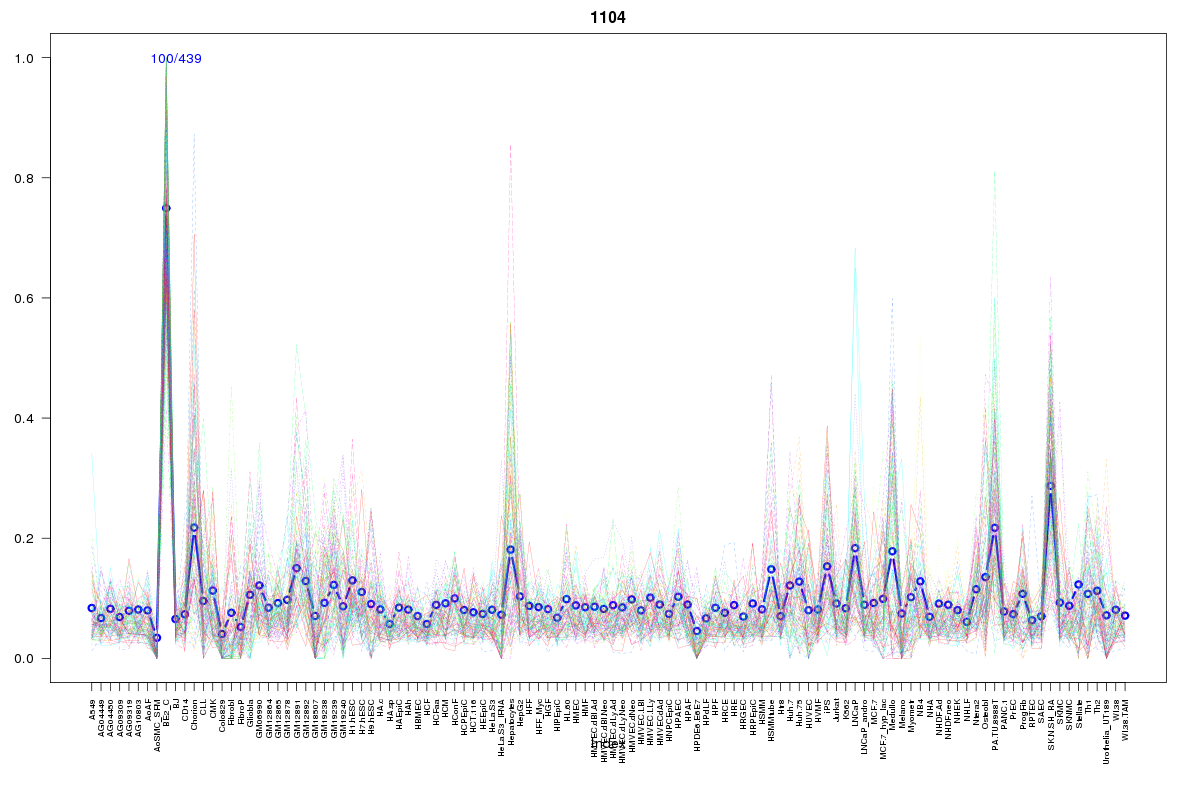 | 1104 | 1 |
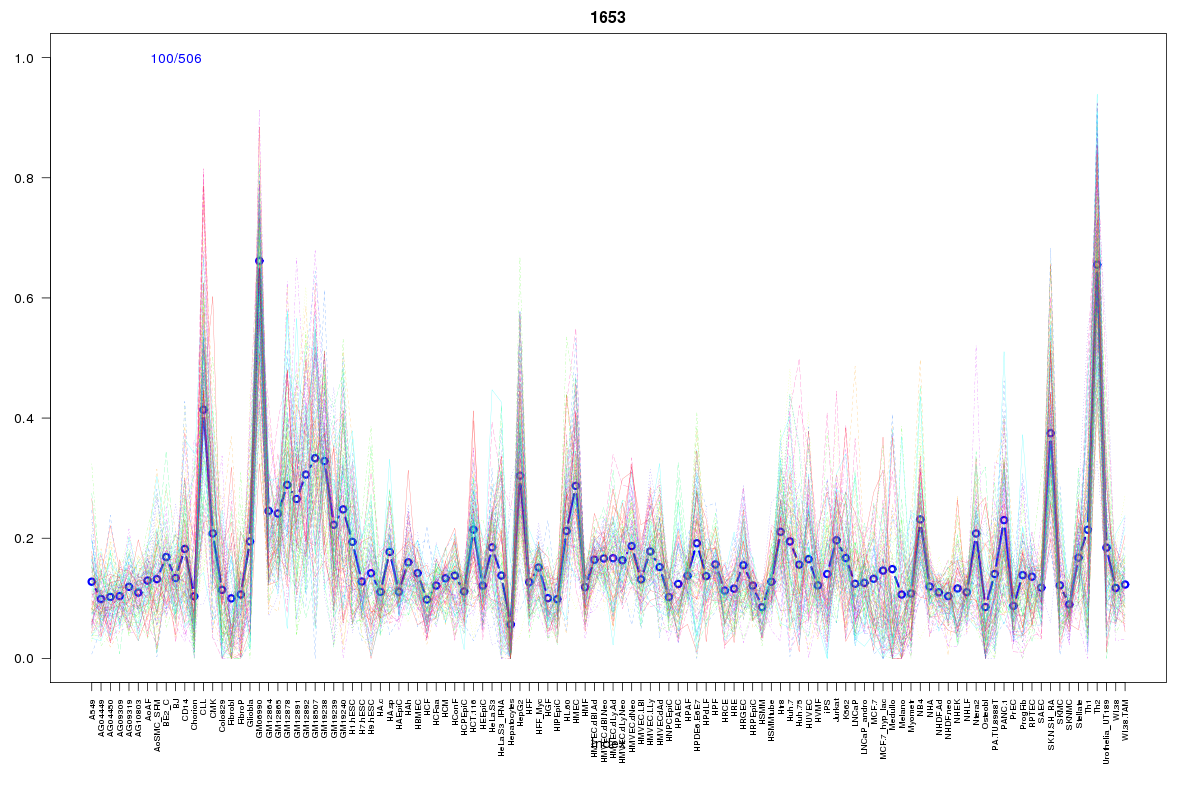 | 1653 | 1 |
 | 1008 | 1 |
 | 629 | 1 |
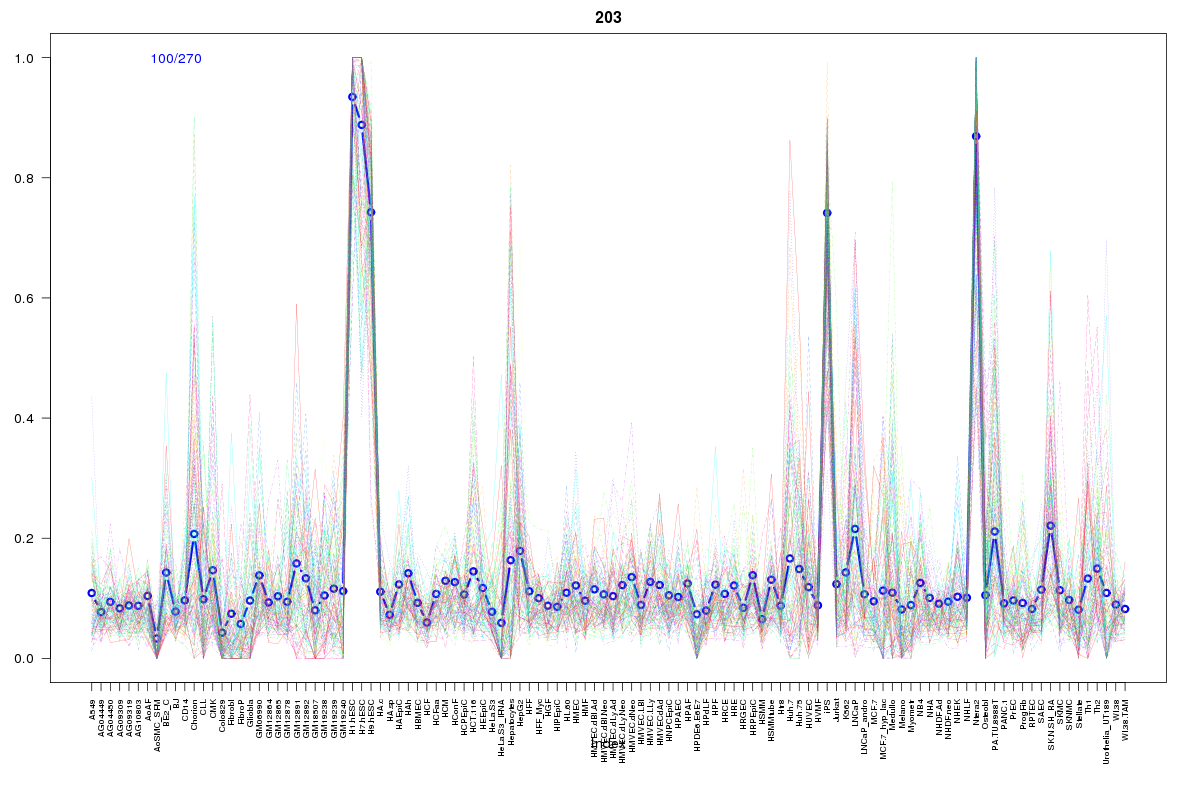 | 203 | 1 |
 | 2017 | 1 |
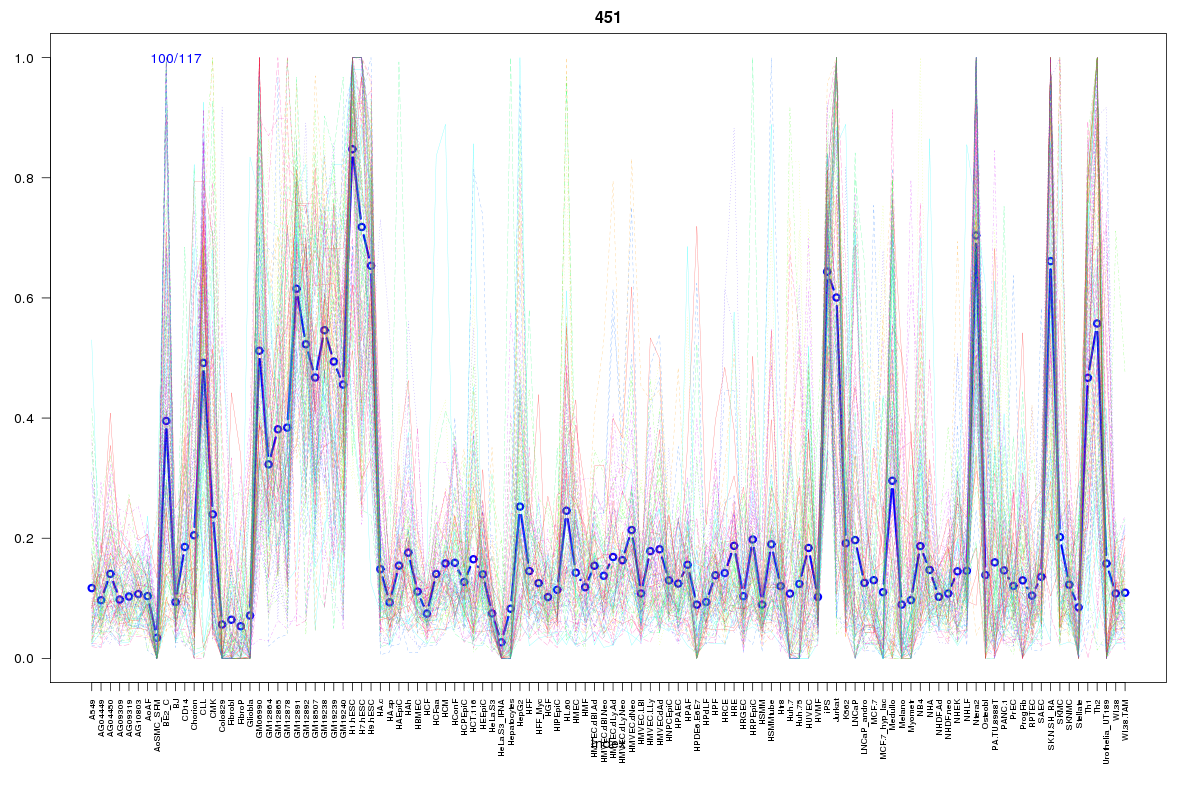 | 451 | 1 |
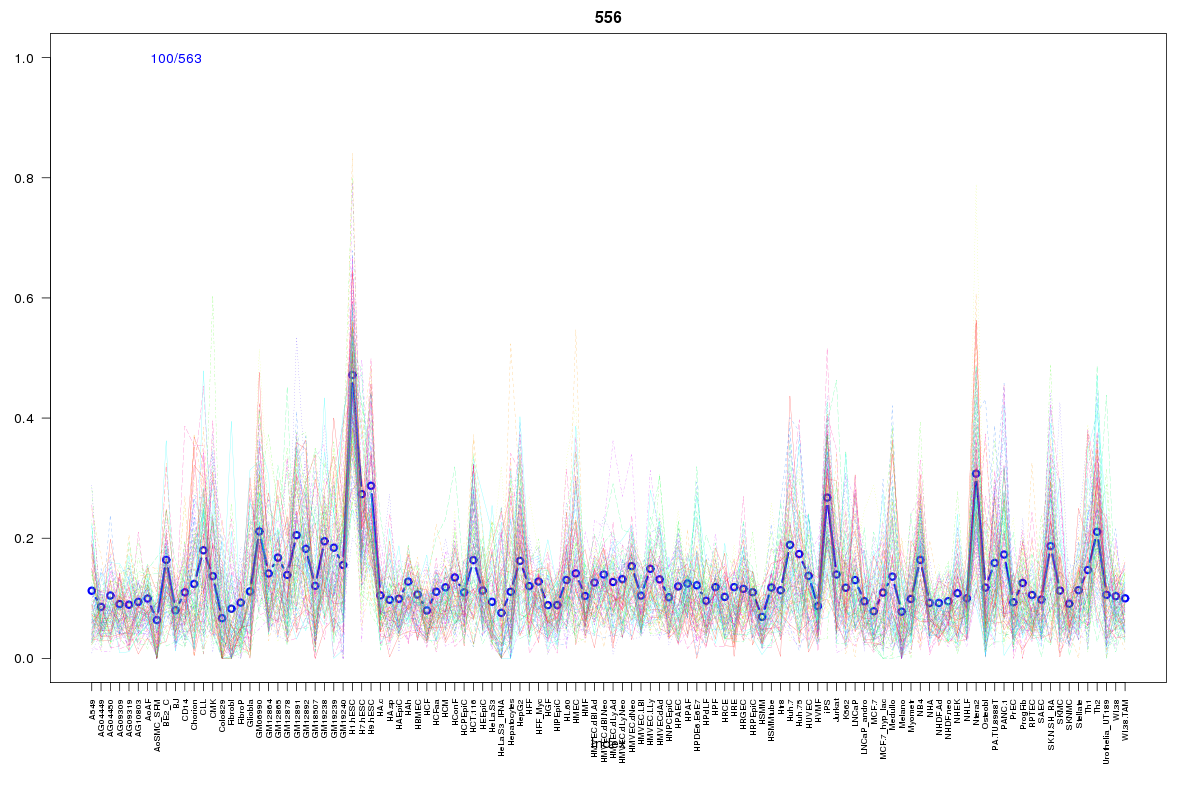 | 556 | 1 |
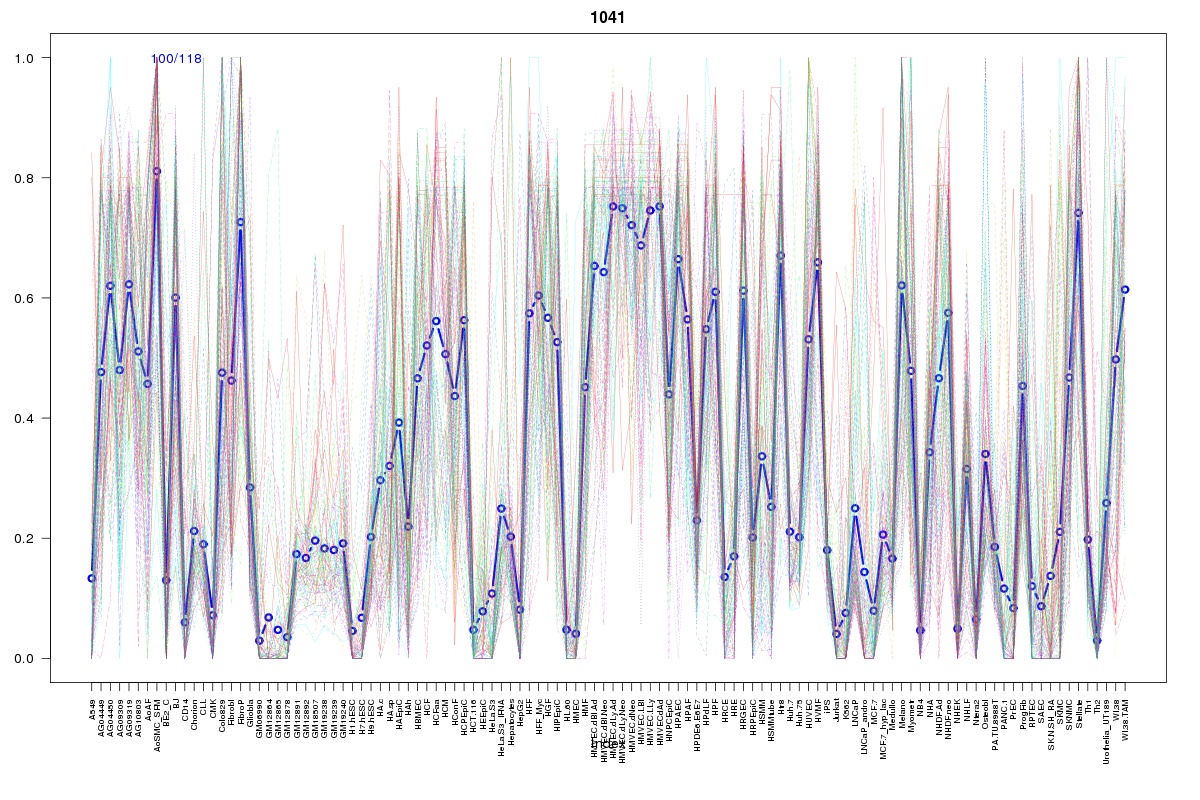 | 1041 | 1 |
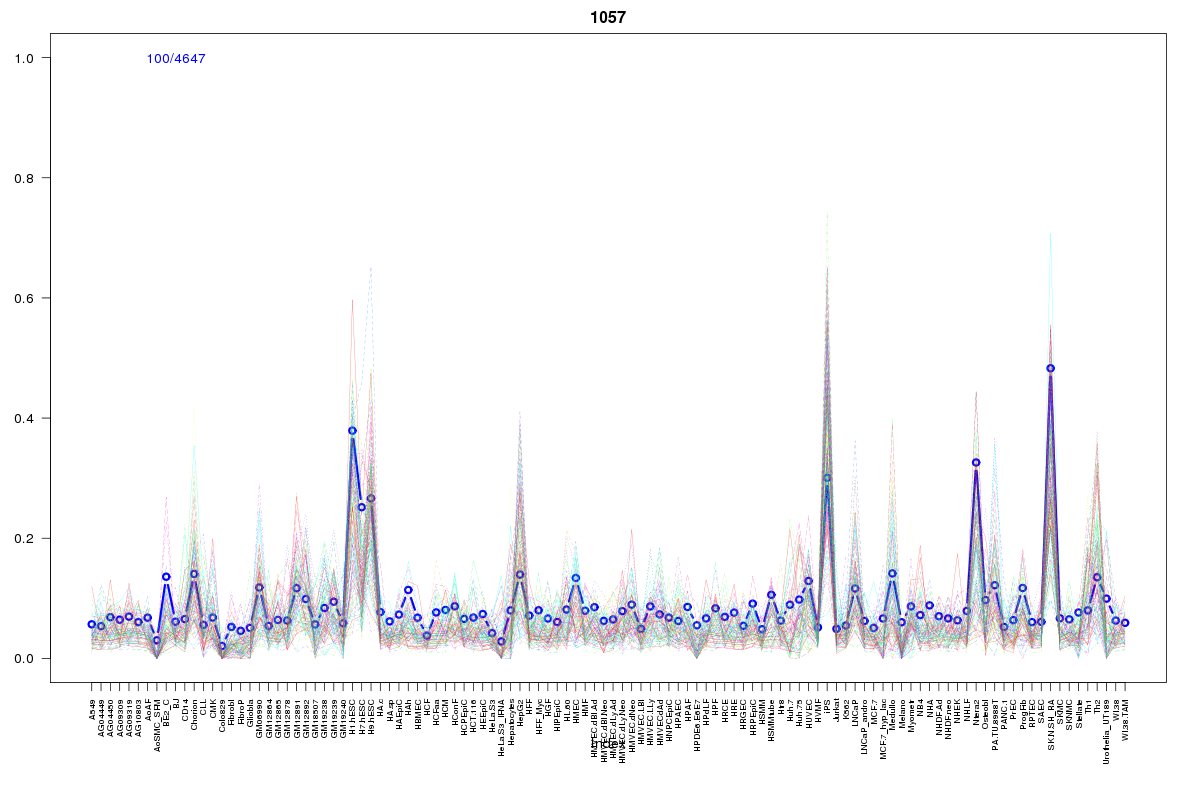 | 1057 | 1 |
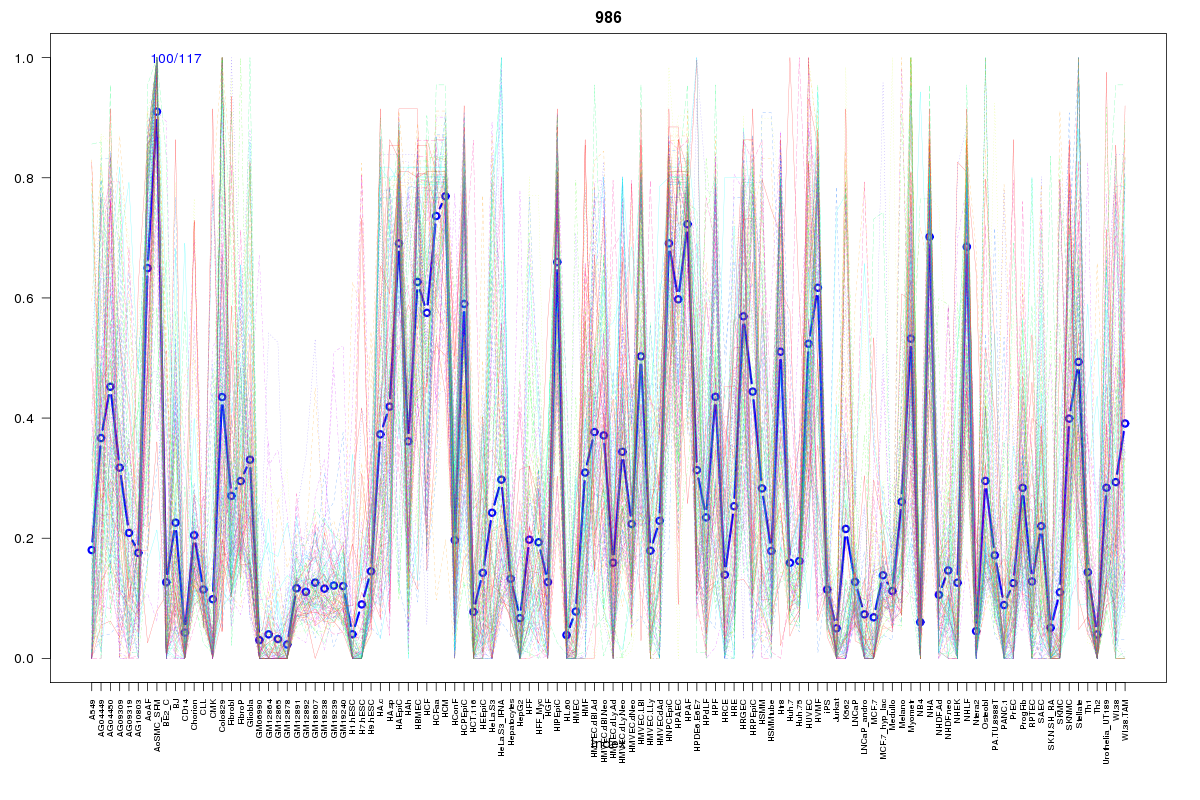 | 986 | 1 |
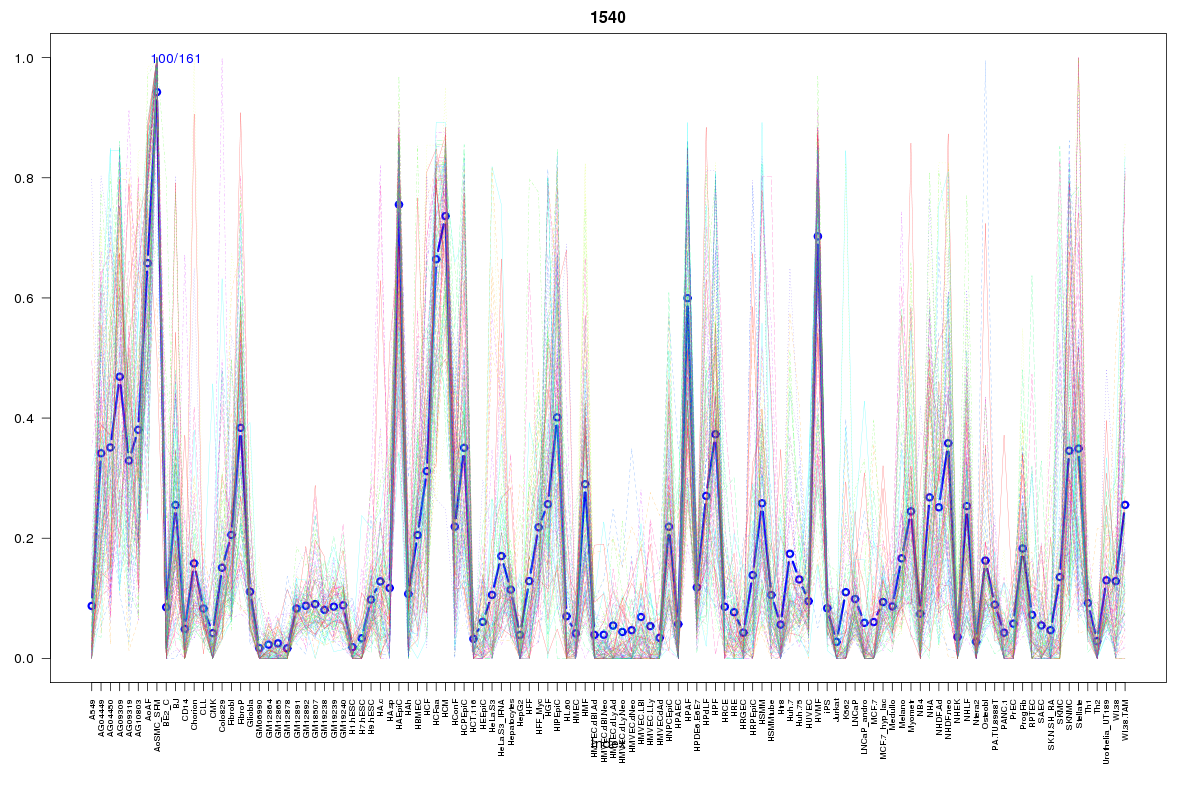 | 1540 | 1 |
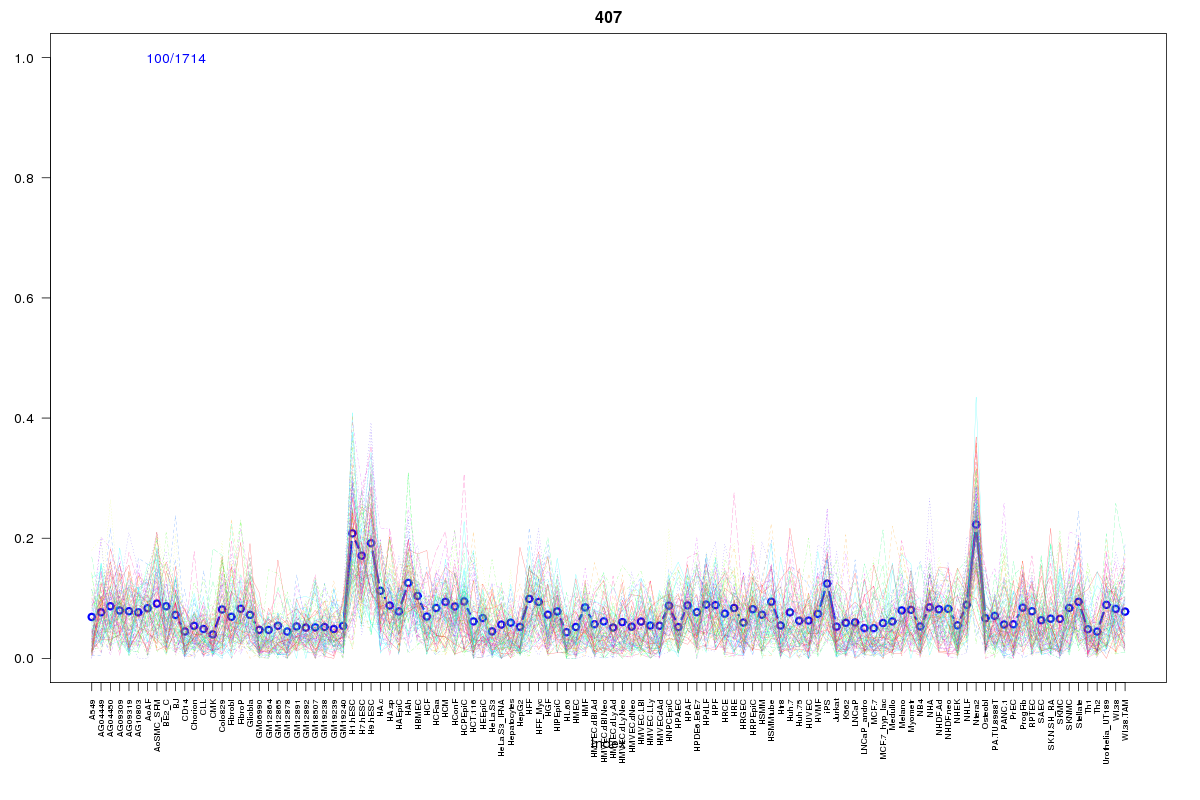 | 407 | 1 |
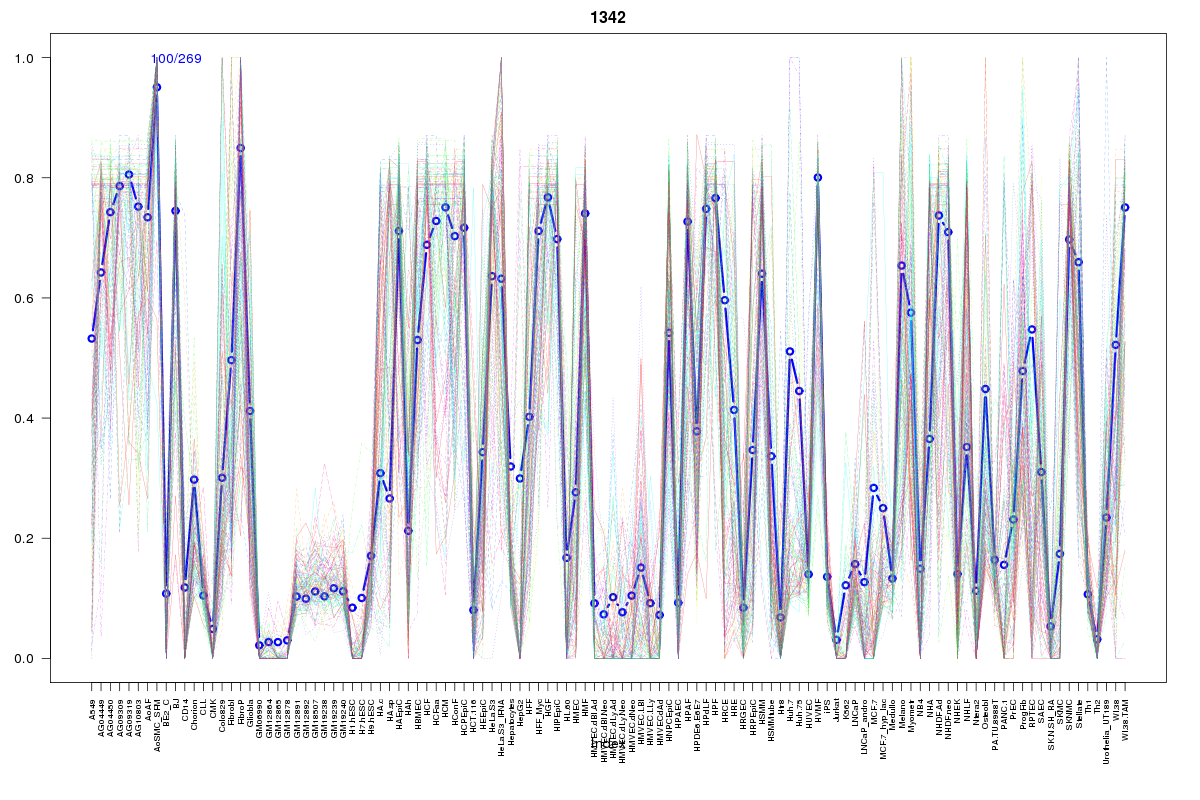 | 1342 | 1 |
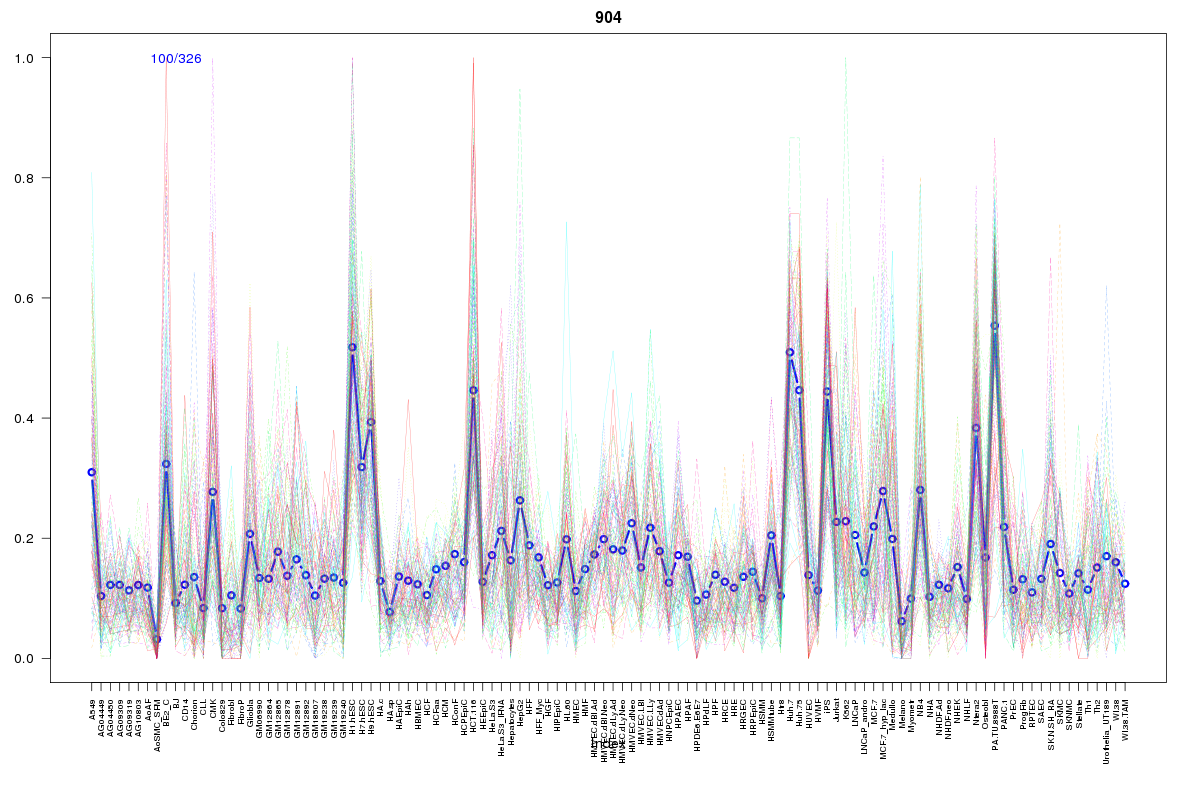 | 904 | 1 |
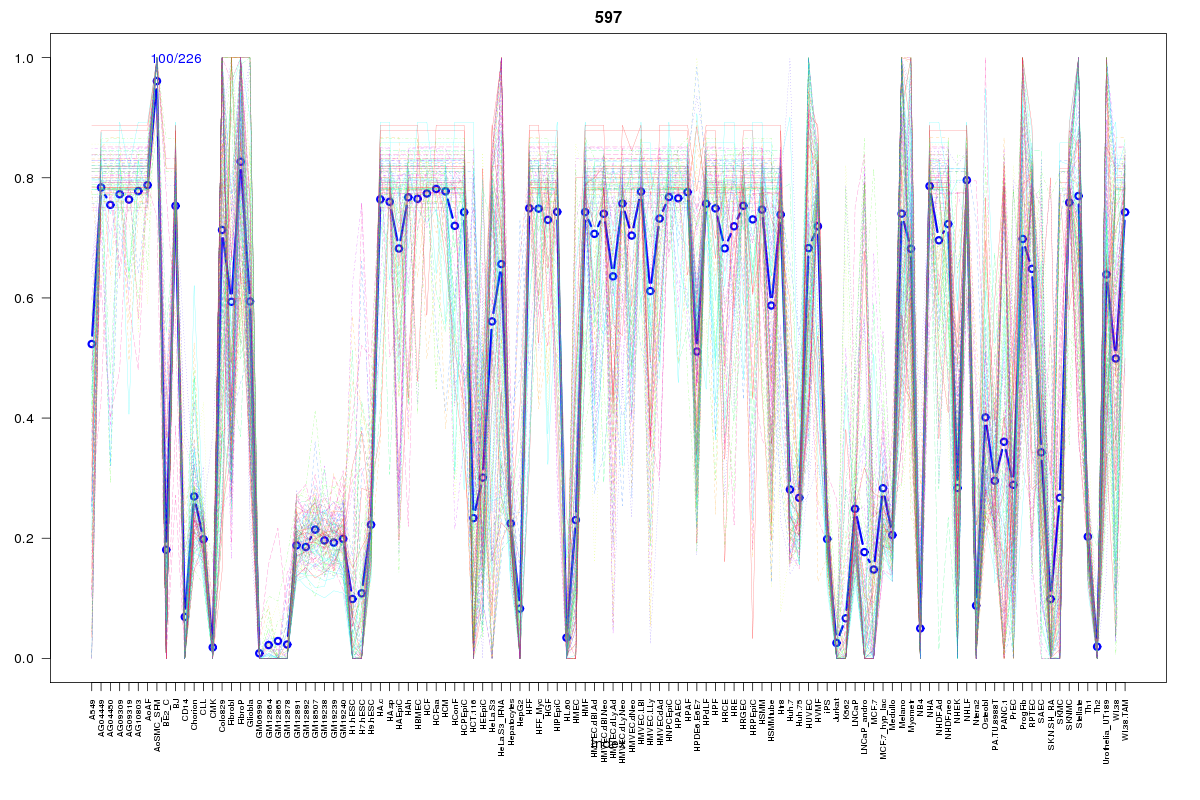 | 597 | 1 |
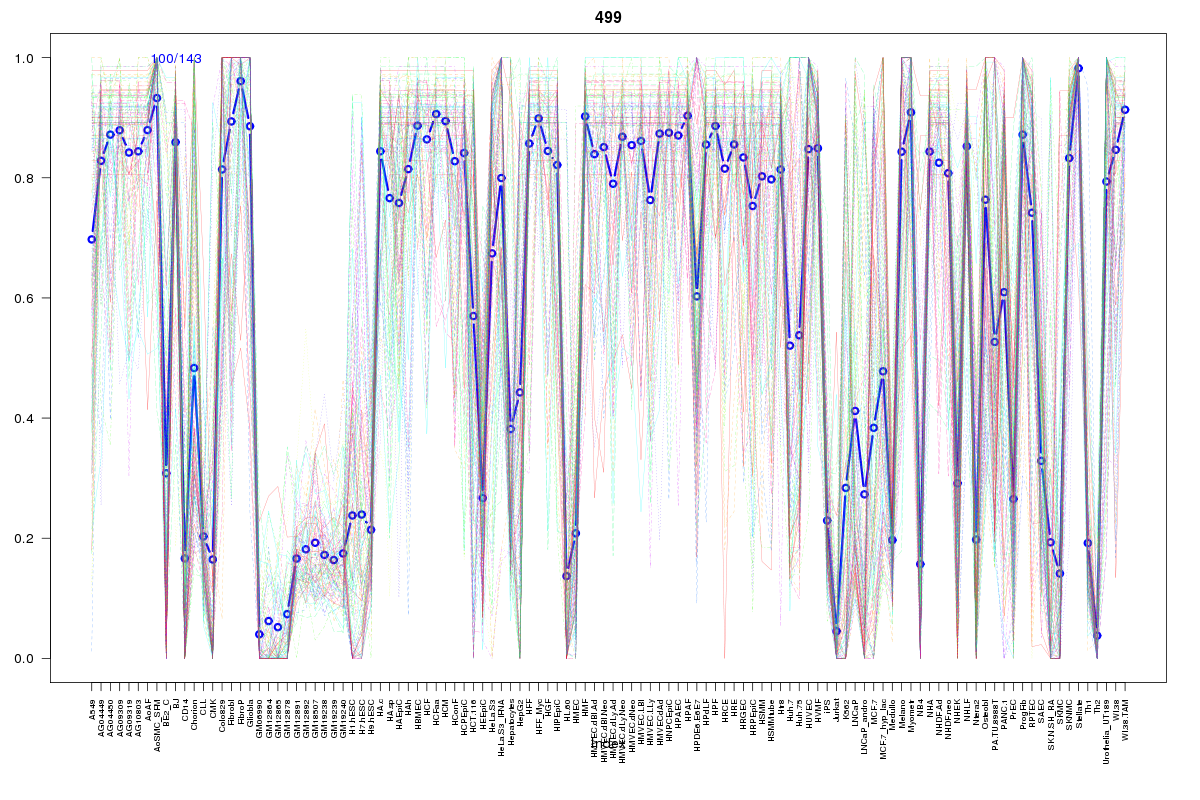 | 499 | 1 |
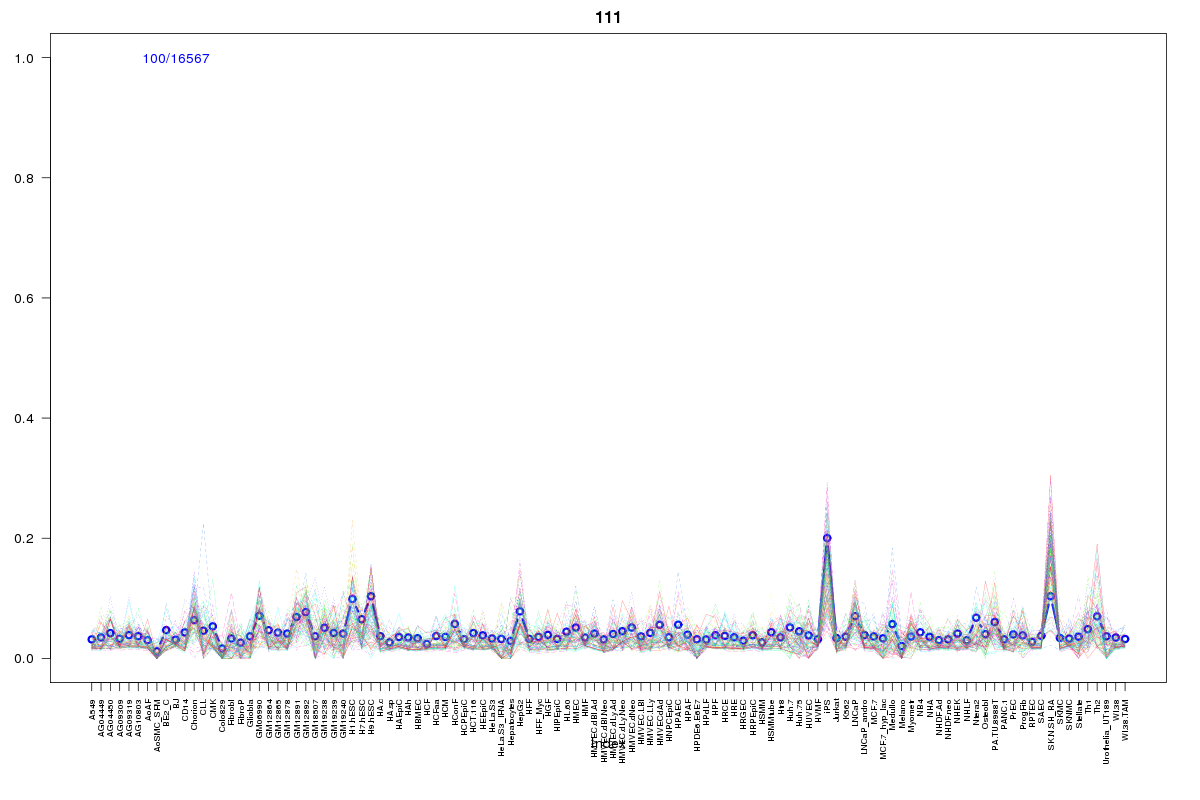 | 111 | 1 |
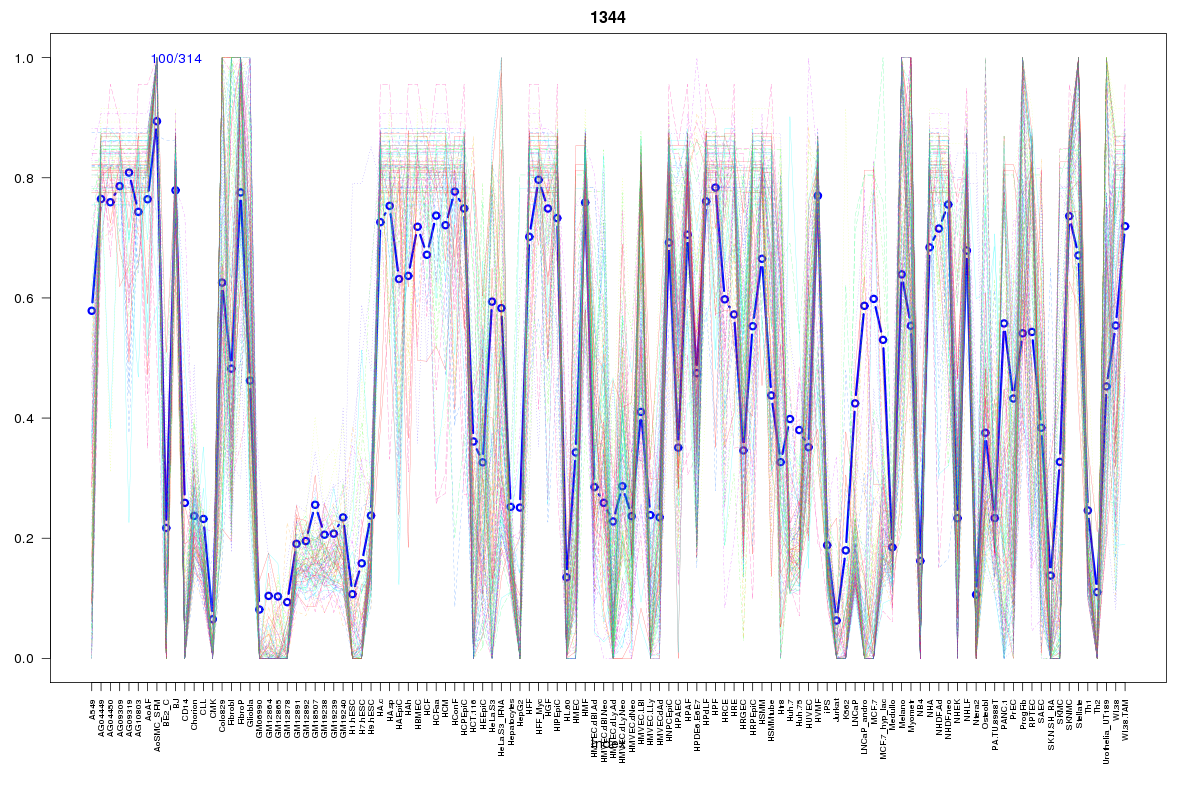 | 1344 | 1 |
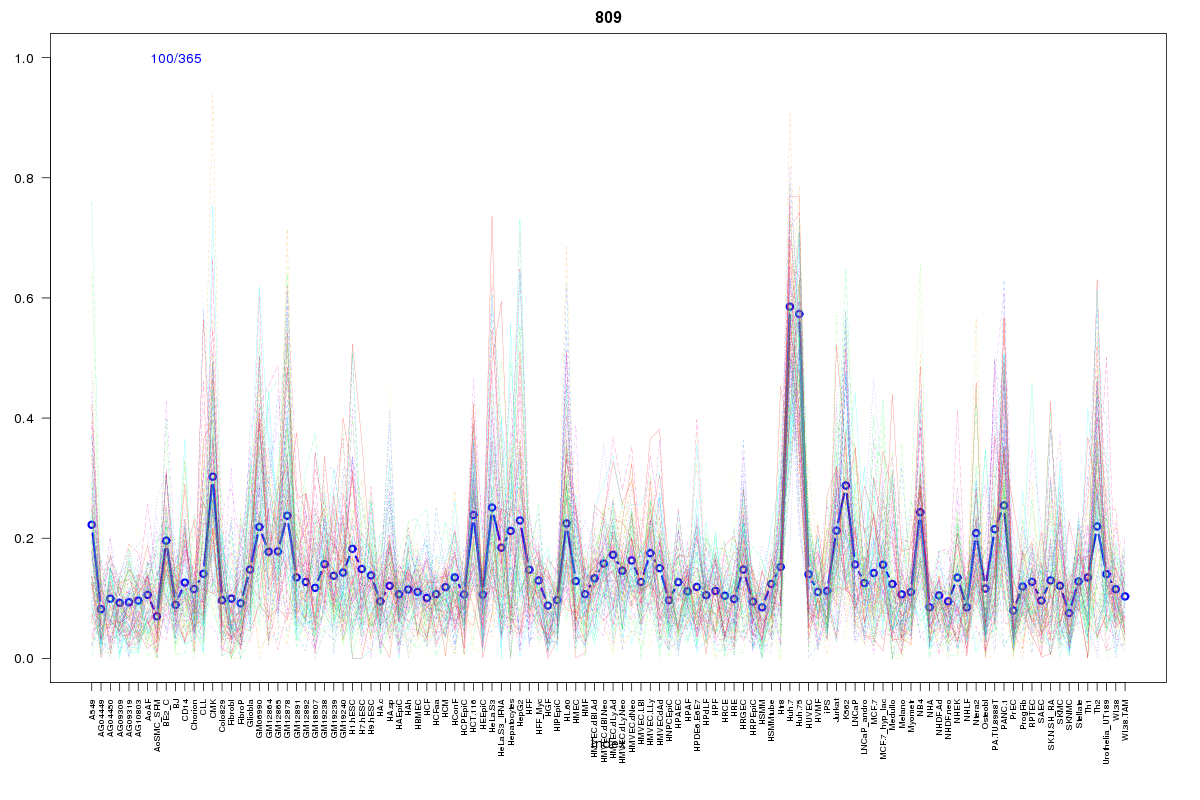 | 809 | 1 |
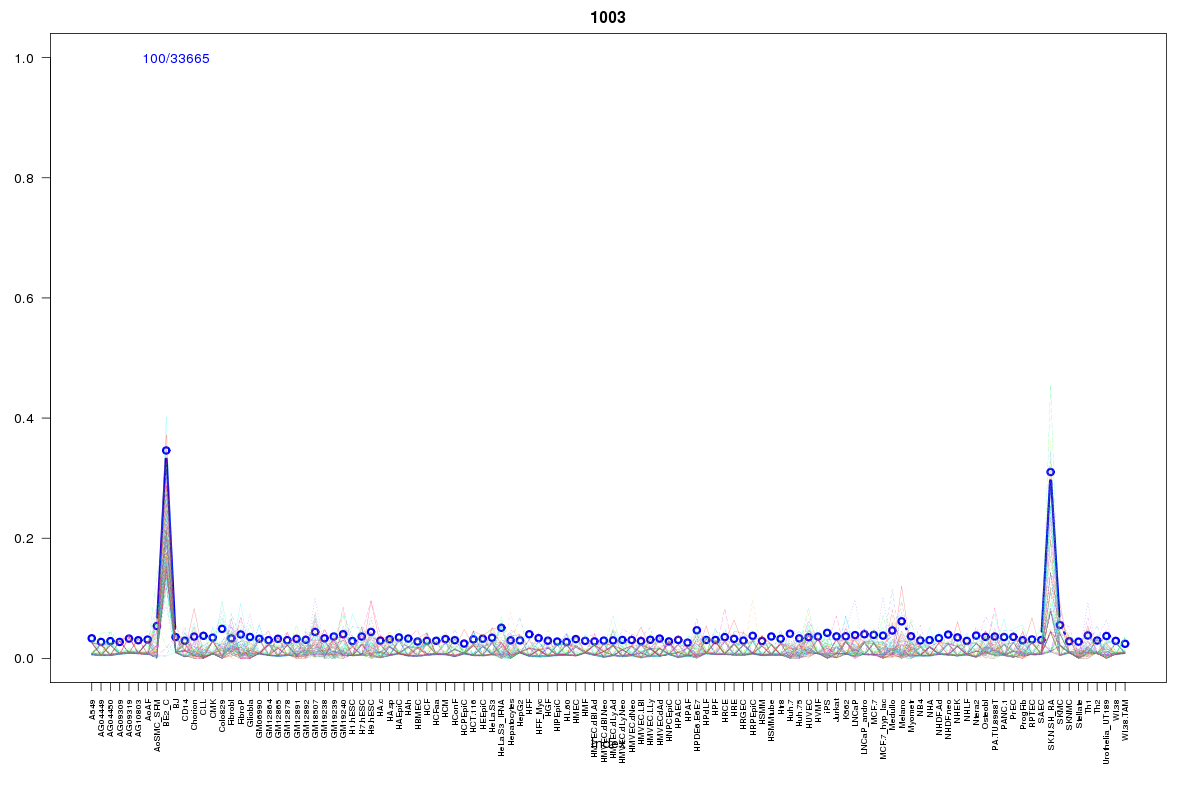 | 1003 | 1 |
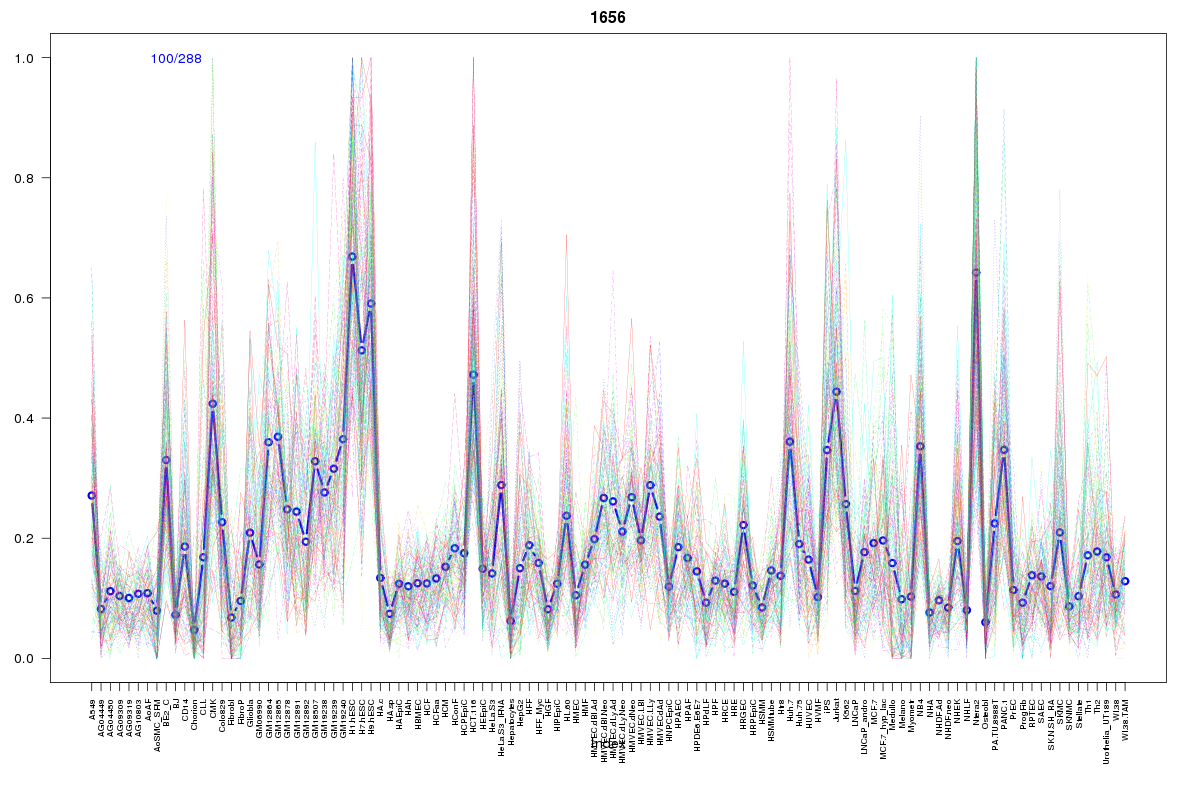 | 1656 | 1 |
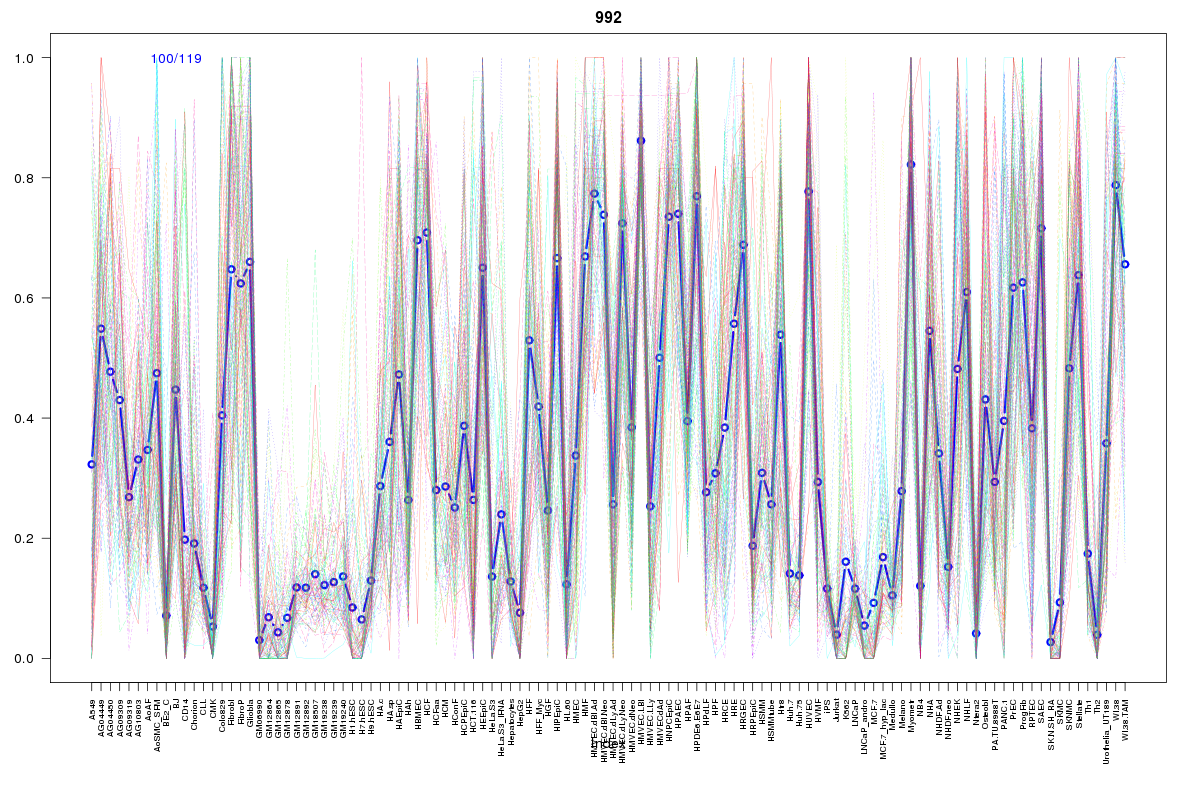 | 992 | 1 |
 | 1422 | 1 |
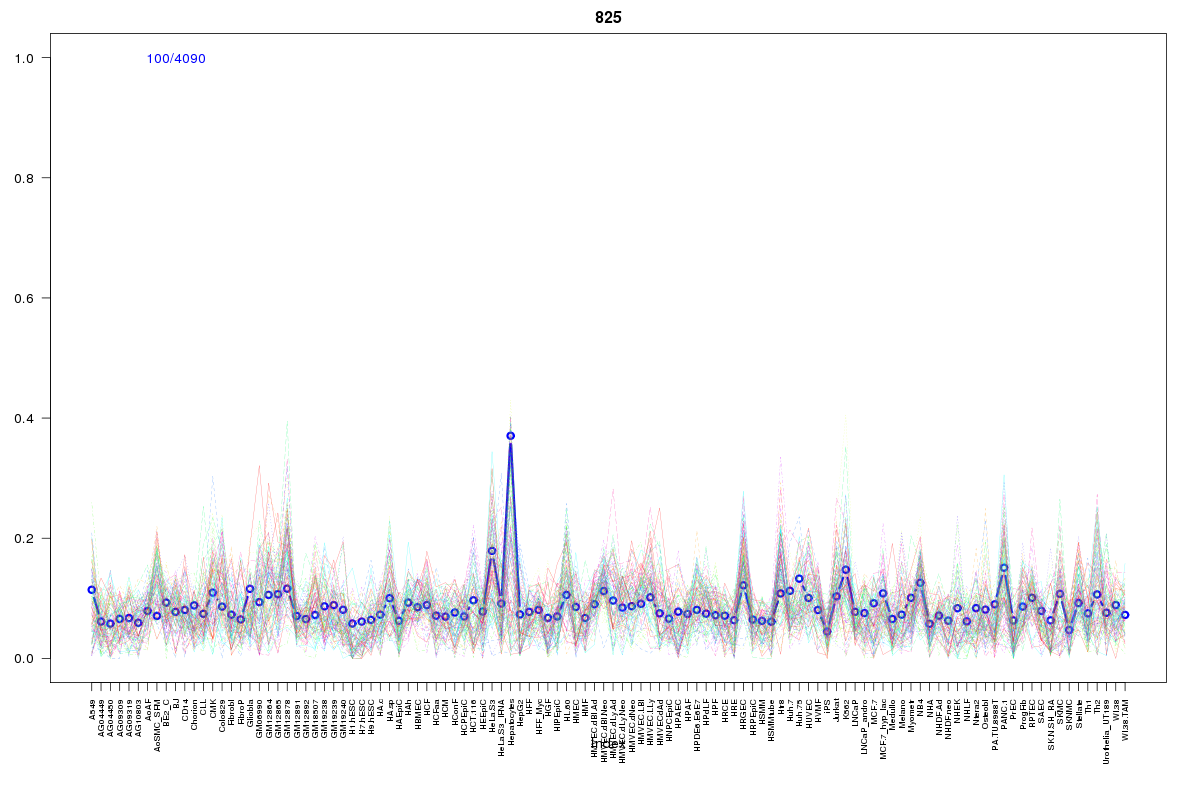 | 825 | 1 |
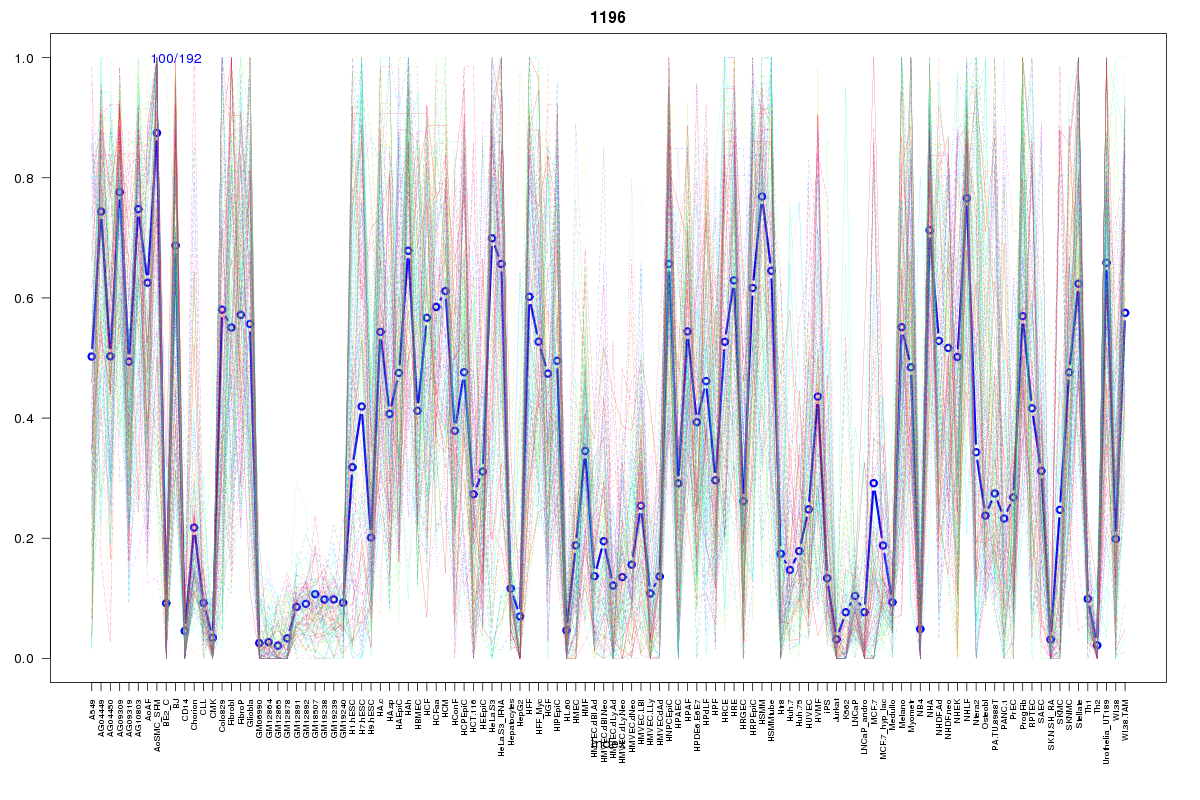 | 1196 | 1 |
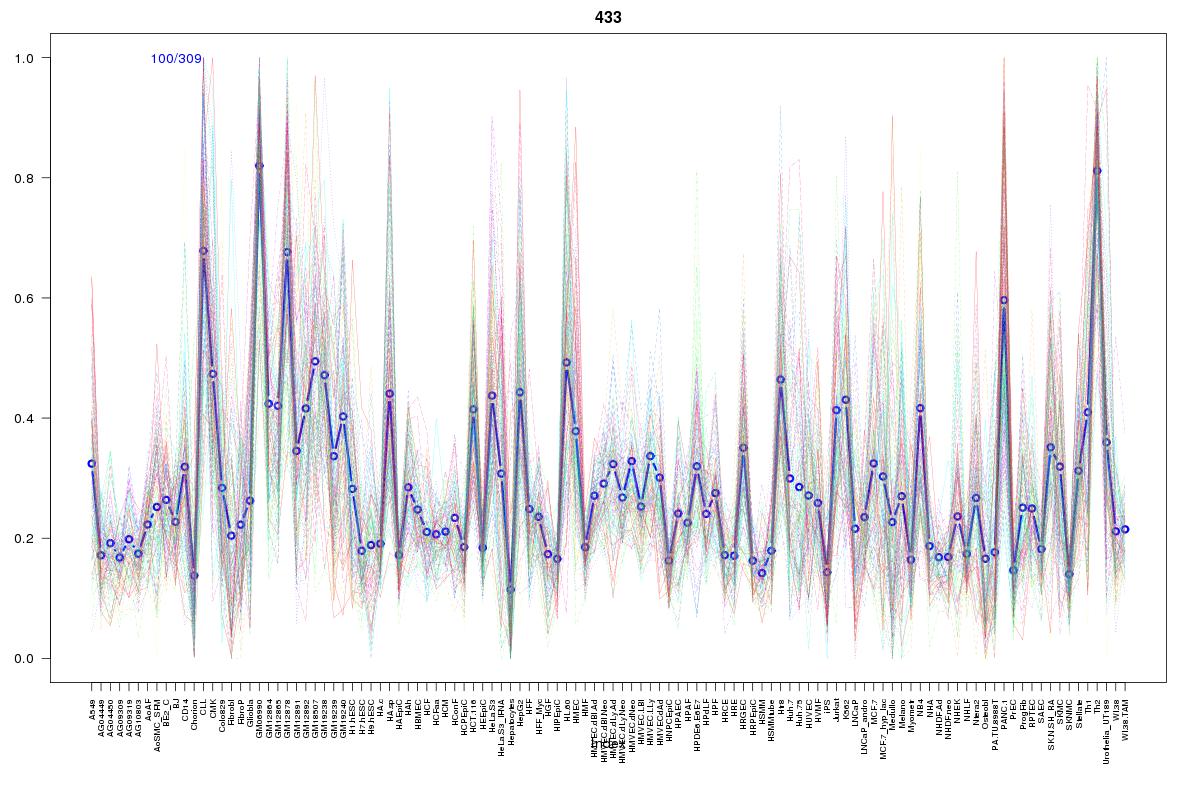 | 433 | 1 |
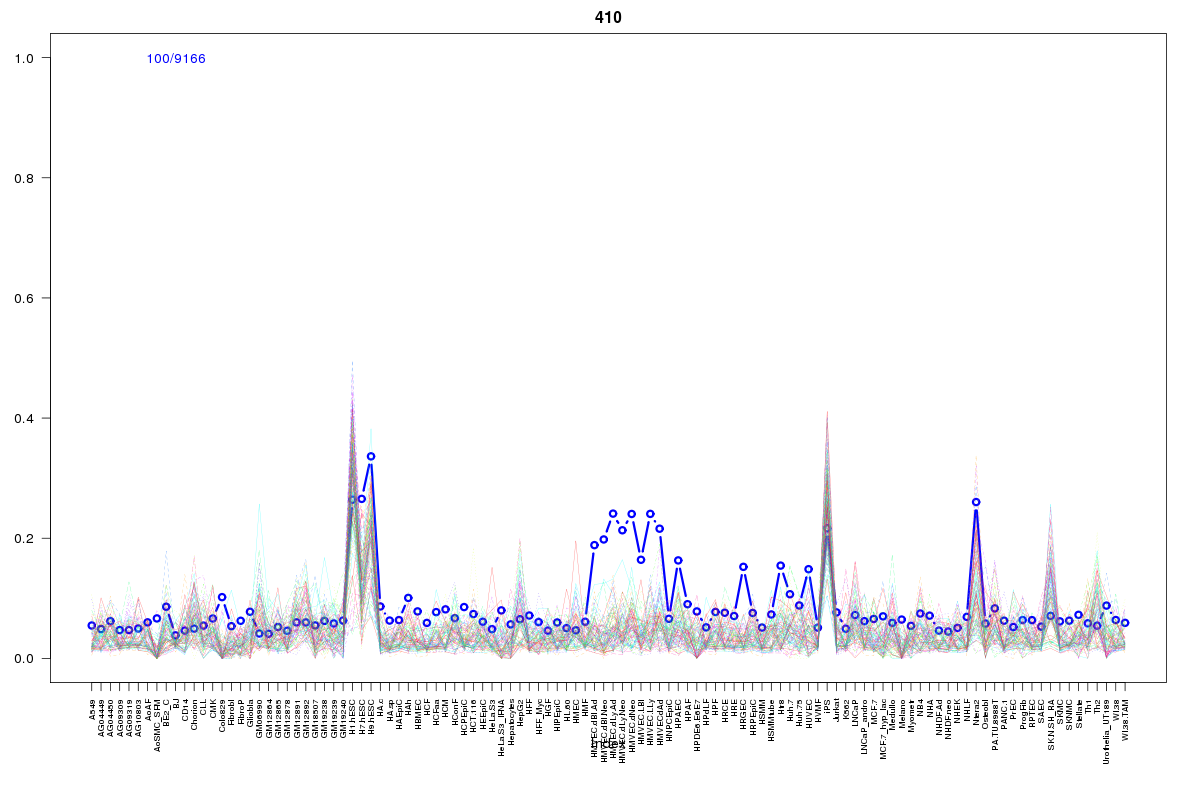 | 410 | 1 |
 | 1269 | 1 |
Resources
BED file downloads
Connects to 37 DHS sitesTop 10 Correlated DHS Sites
p-values indiciate significant higher or lower correlation| Location | Cluster | P-value |
|---|---|---|
| chr20:36662080-36662230 | 1269 | 0 |
| chr20:36661540-36661690 | 433 | 0 |
| chr20:36569905-36570055 | 904 | 0 |
| chr20:36741980-36742130 | 1656 | 0.001 |
| chr20:36662425-36662575 | 629 | 0.001 |
| chr20:36541845-36541995 | 410 | 0.001 |
| chr20:36515460-36515610 | 809 | 0.004 |
| chr20:36544020-36544170 | 1057 | 0.004 |
| chr20:36543340-36543490 | 451 | 0.006 |
| chr20:36571020-36571170 | 2114 | 0.006 |
| chr20:36544380-36544530 | 1210 | 0.006 |
External Databases
UCSCEnsembl (ENSG00000101407)