Gene: TIMM13
chr19: 2425621-2427892Expression Profile
(log scale)
Graphical Connections
Distribution of linked clusters:
You may find it interesting if many of the connected DHS sites belong to the same cluster.| Cluster Profile | Cluster ID | Number of DHS sites in this cluster |
|---|---|---|
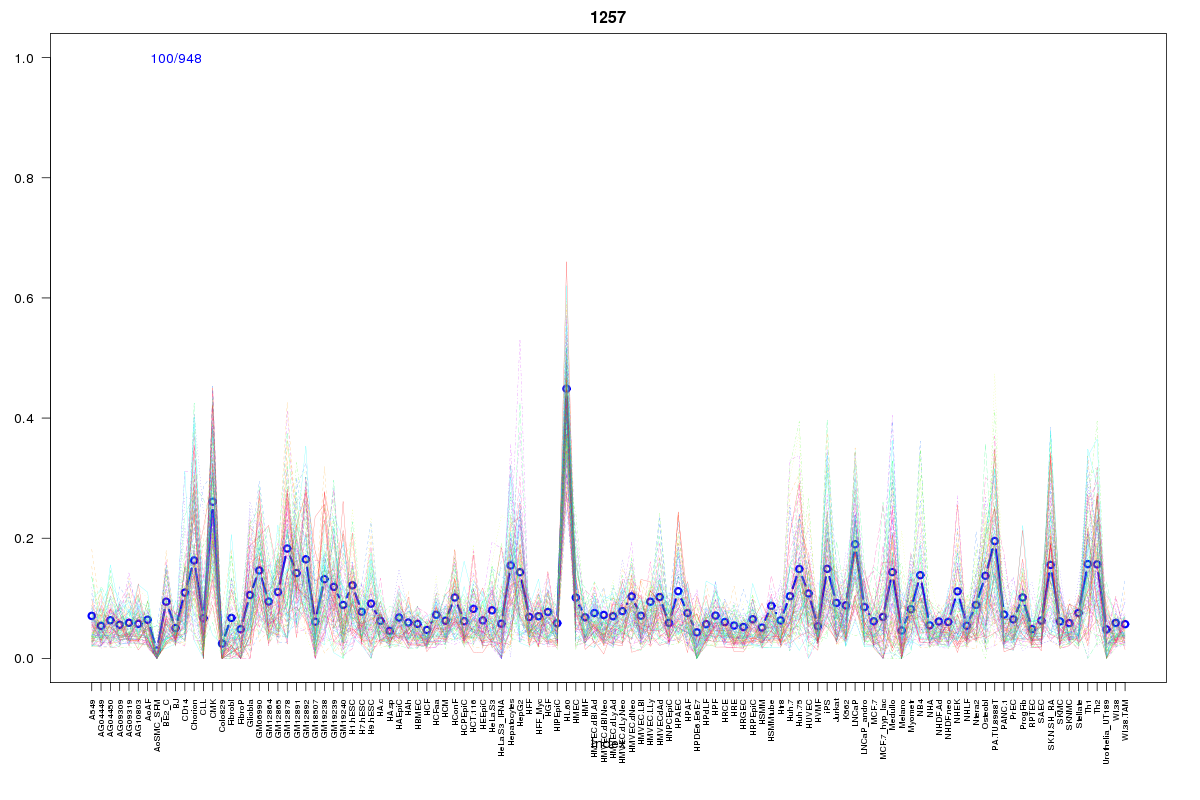 | 1257 | 5 |
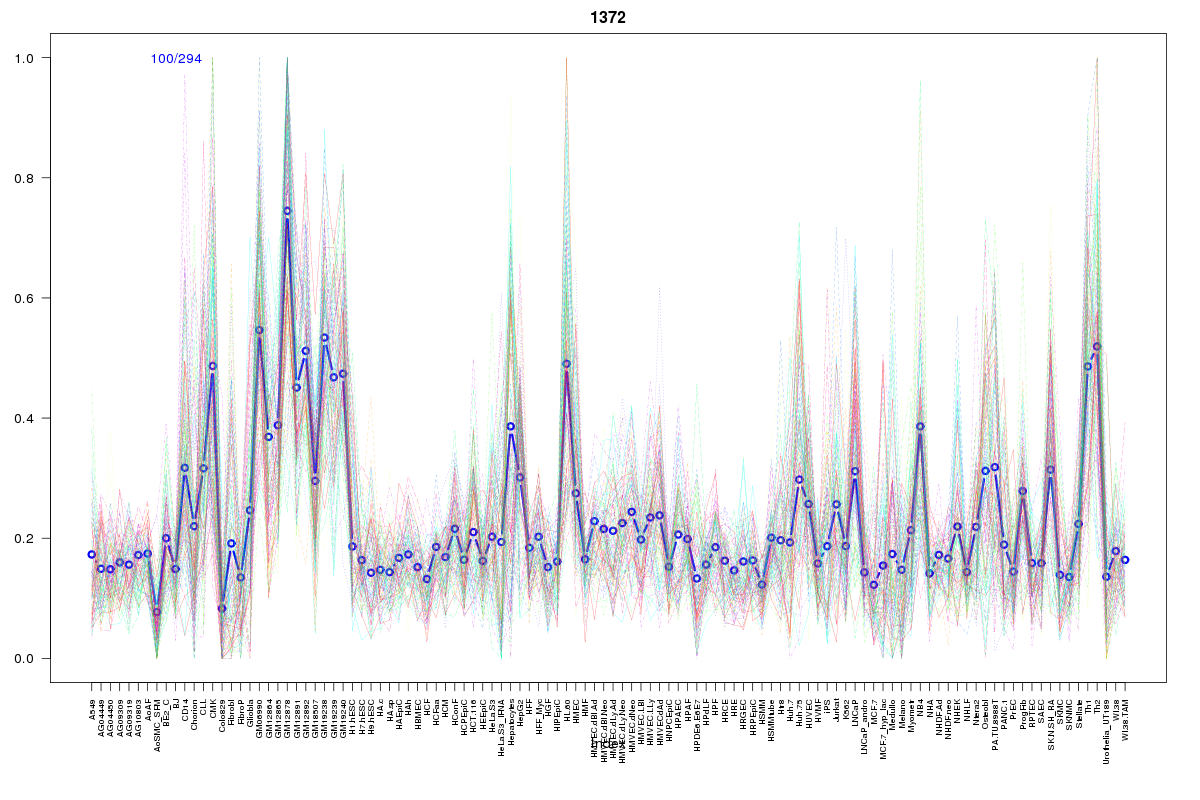 | 1372 | 2 |
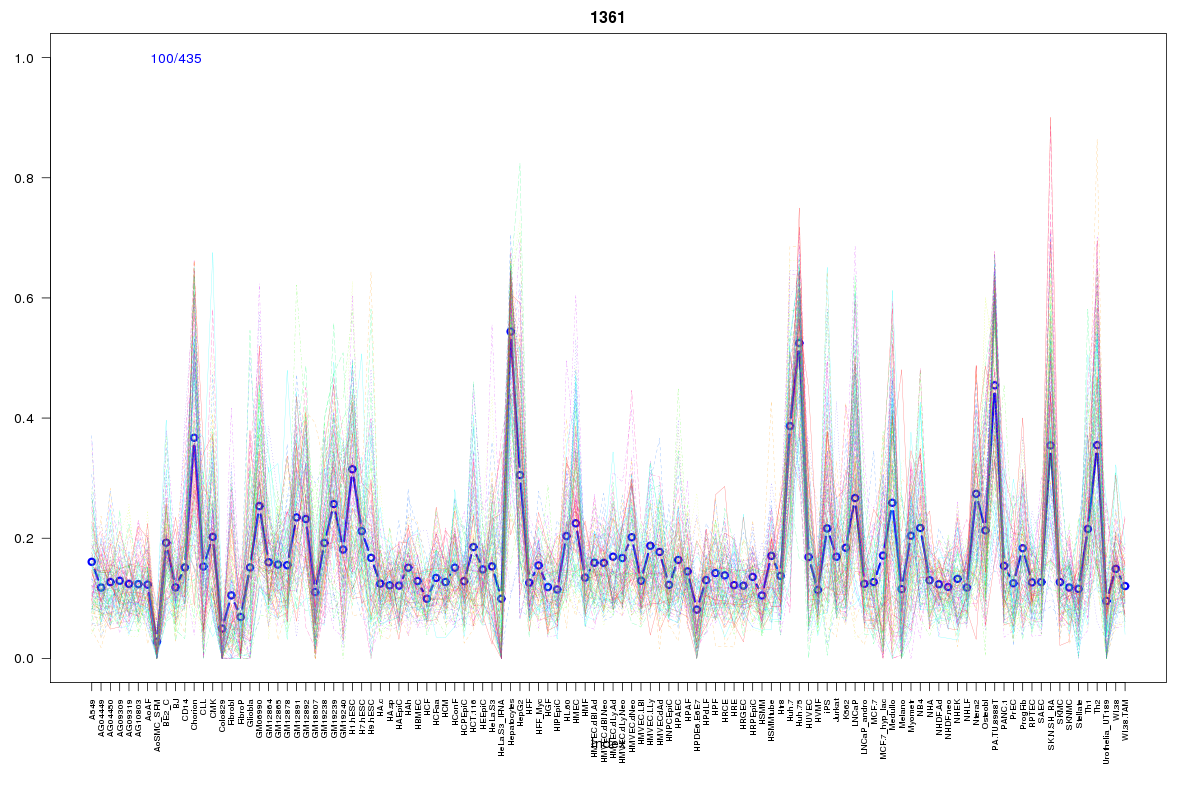 | 1361 | 1 |
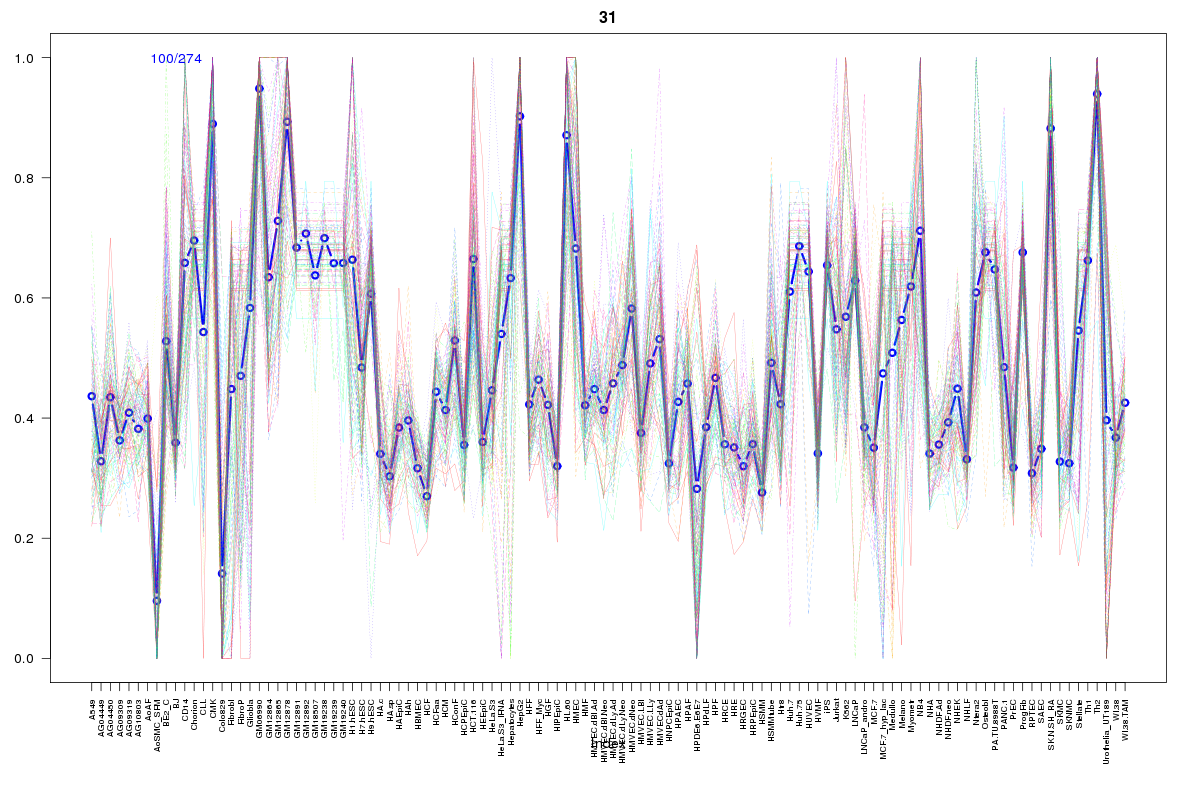 | 31 | 1 |
 | 570 | 1 |
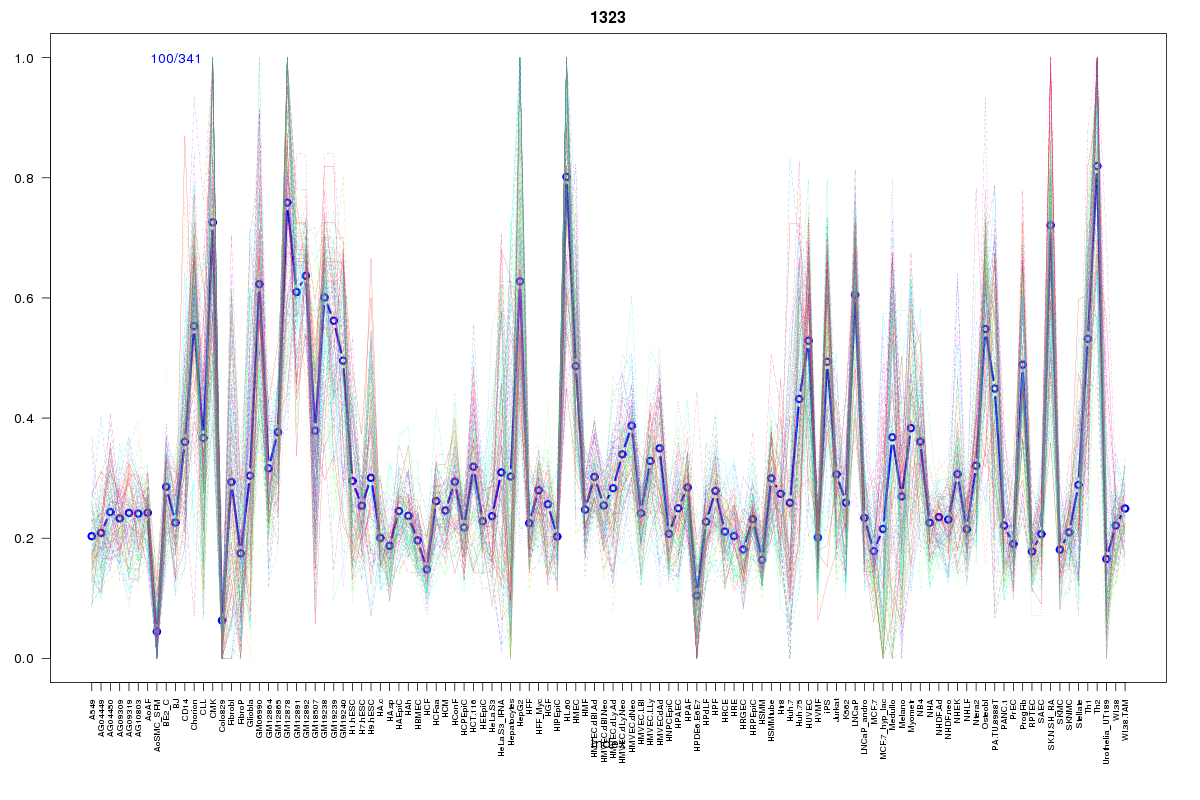 | 1323 | 1 |
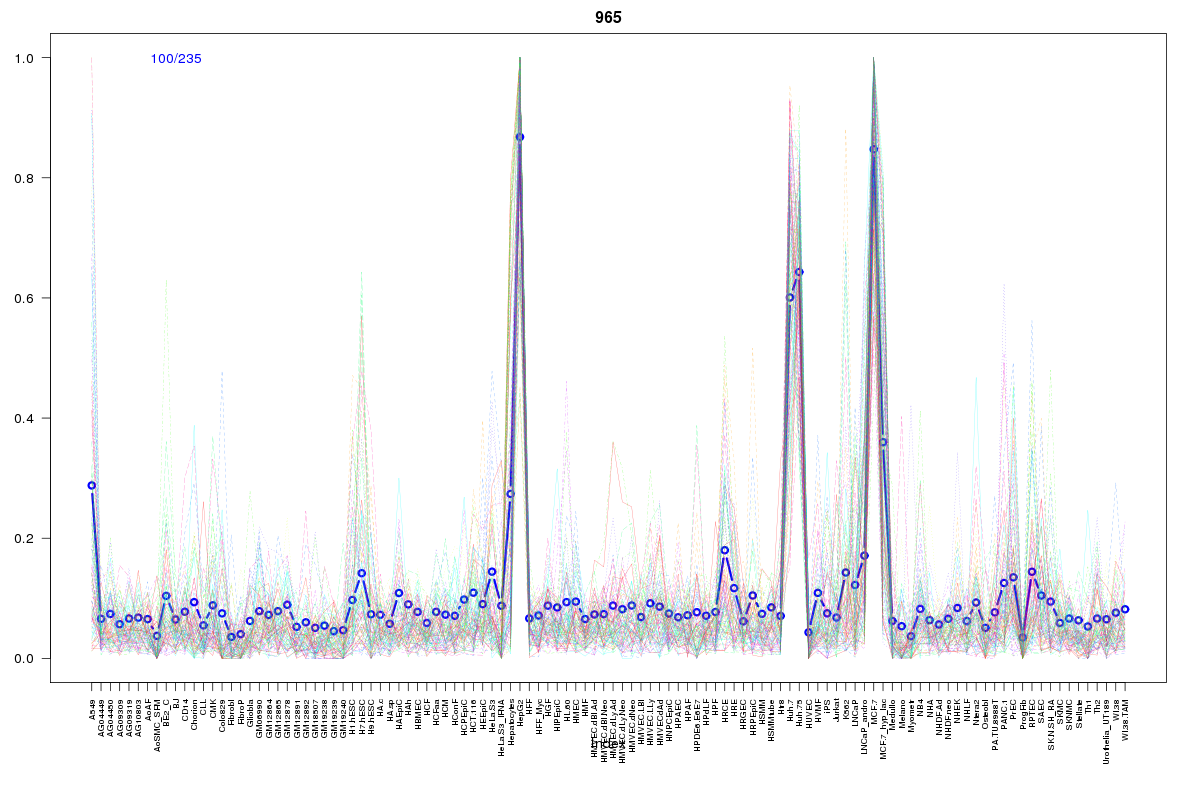 | 965 | 1 |
 | 2279 | 1 |
 | 770 | 1 |
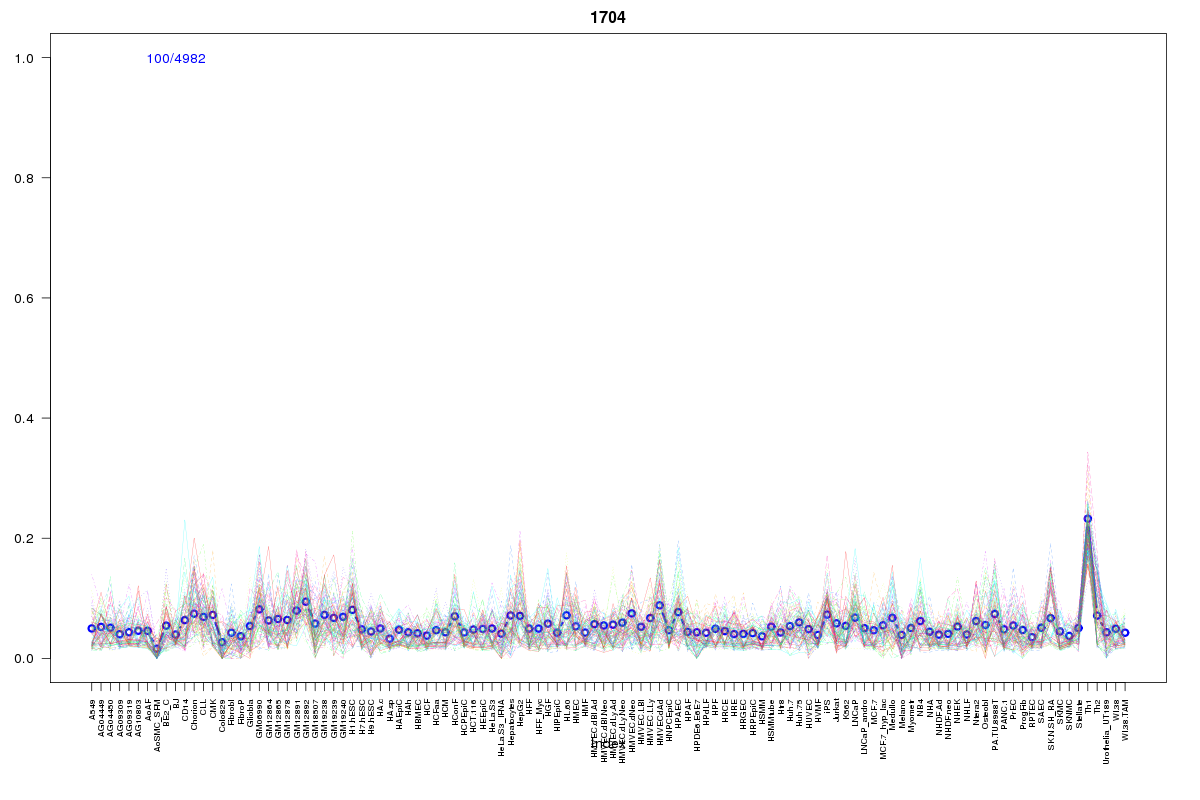 | 1704 | 1 |
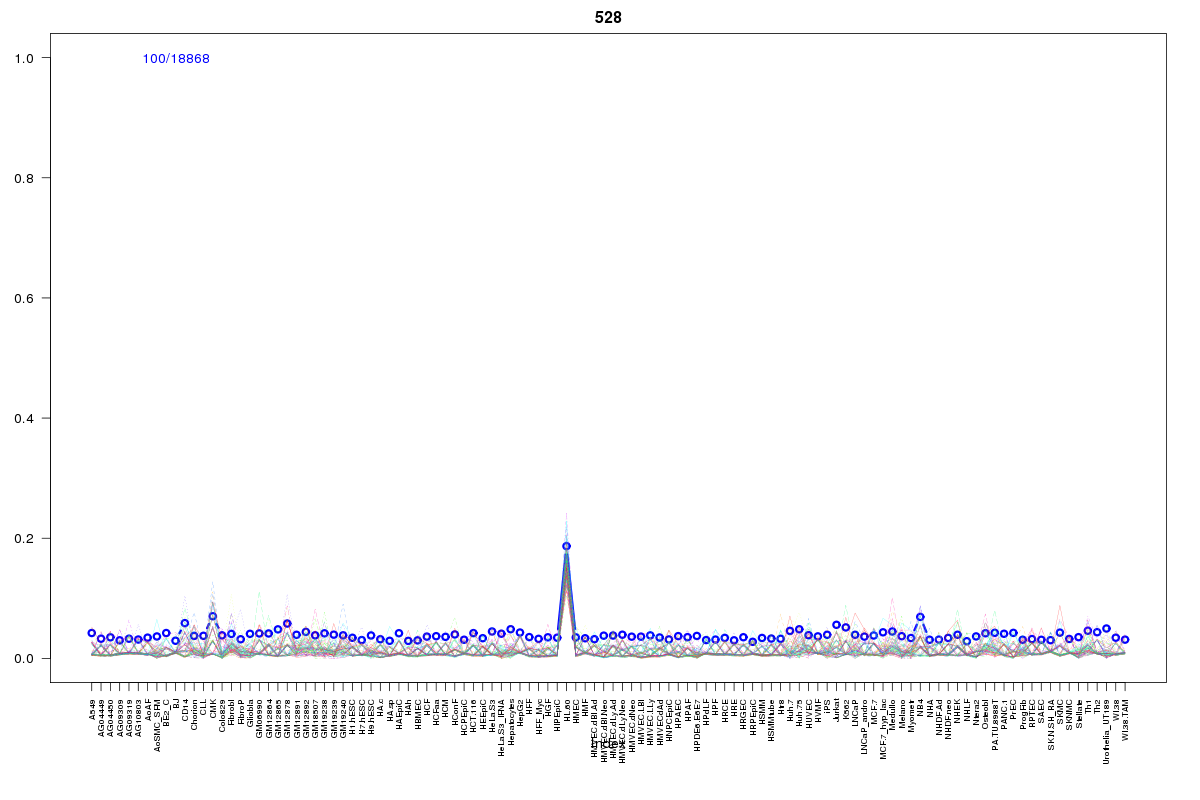 | 528 | 1 |
 | 1604 | 1 |
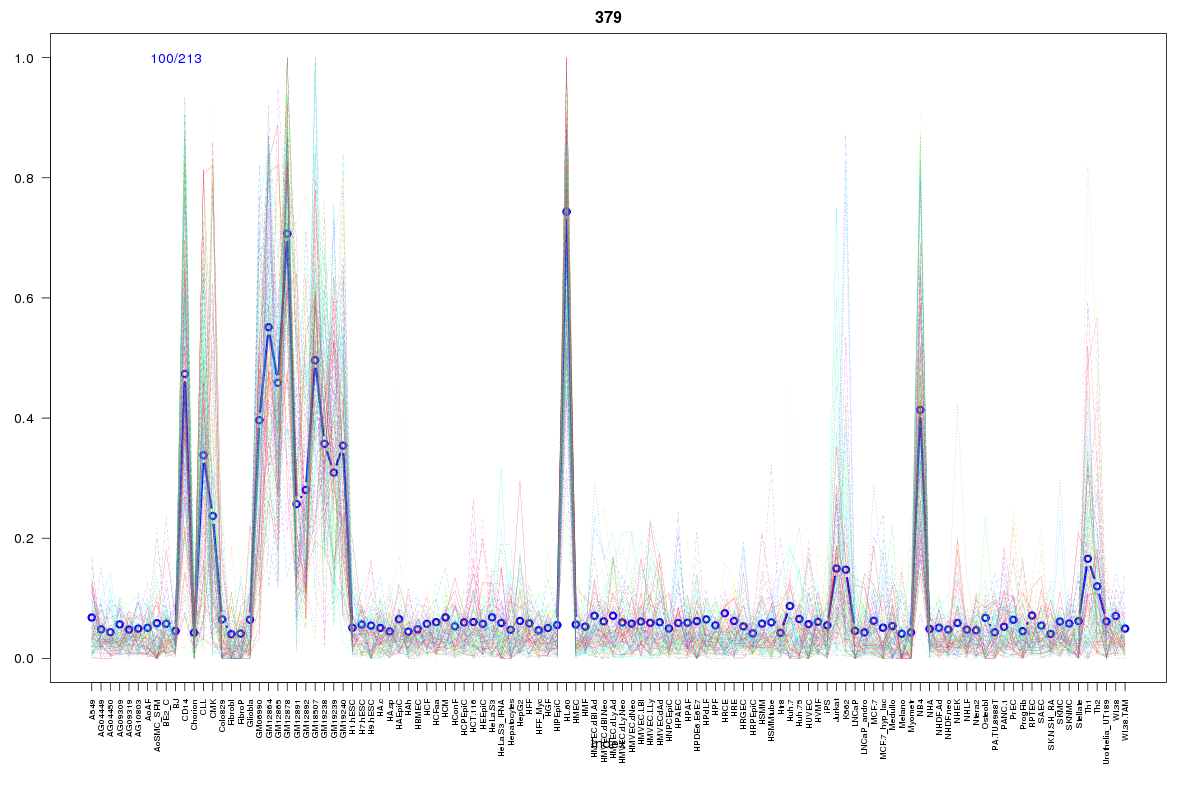 | 379 | 1 |
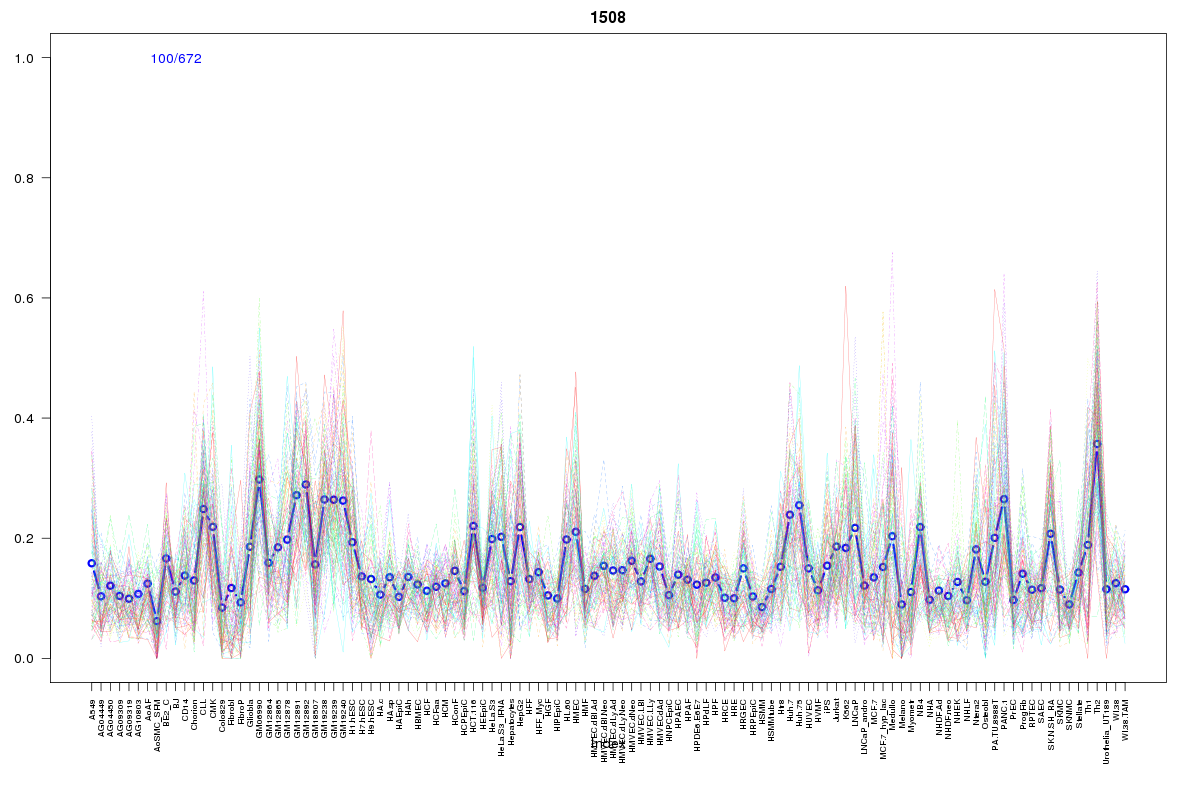 | 1508 | 1 |
 | 1008 | 1 |
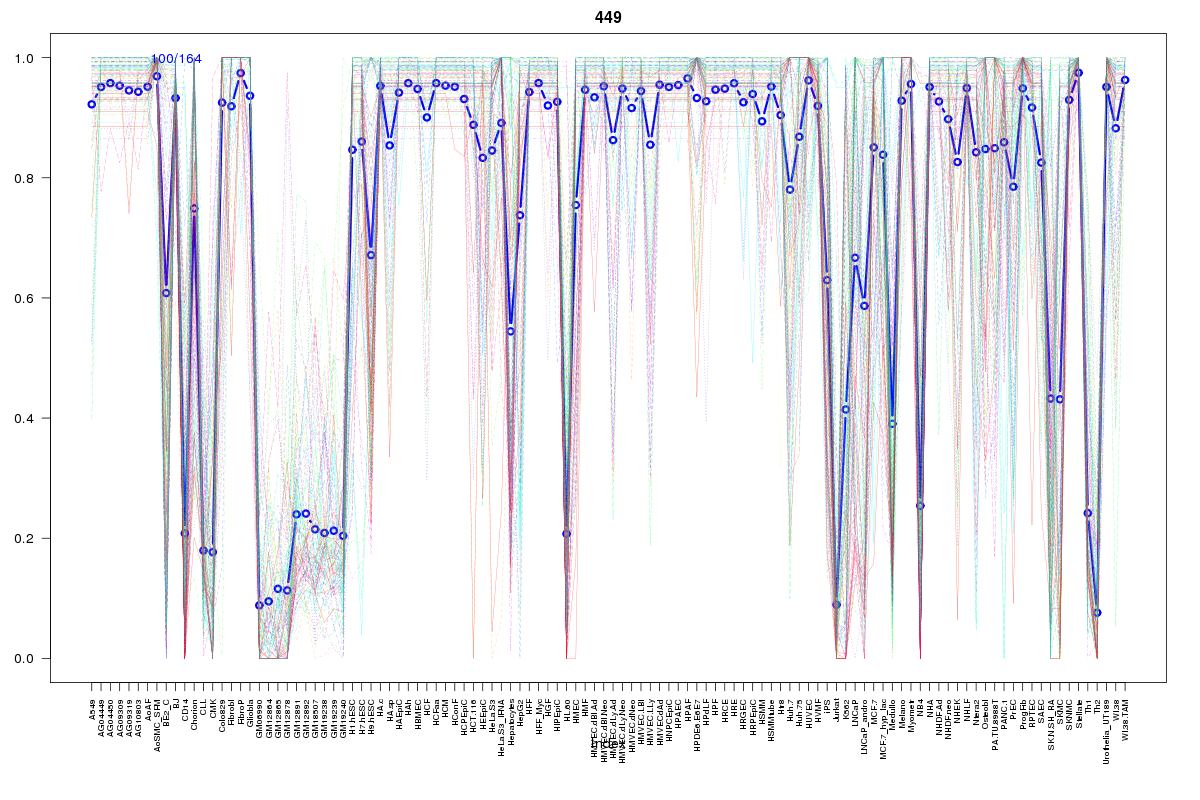 | 449 | 1 |
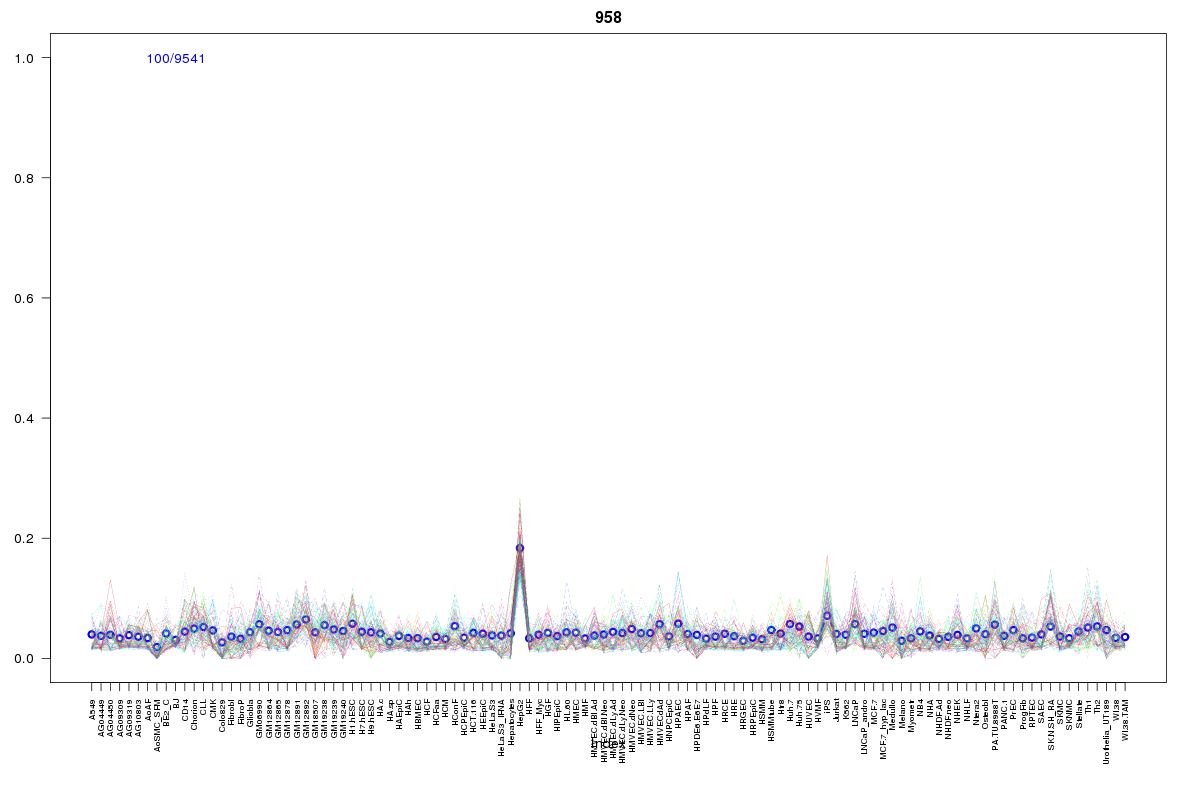 | 958 | 1 |
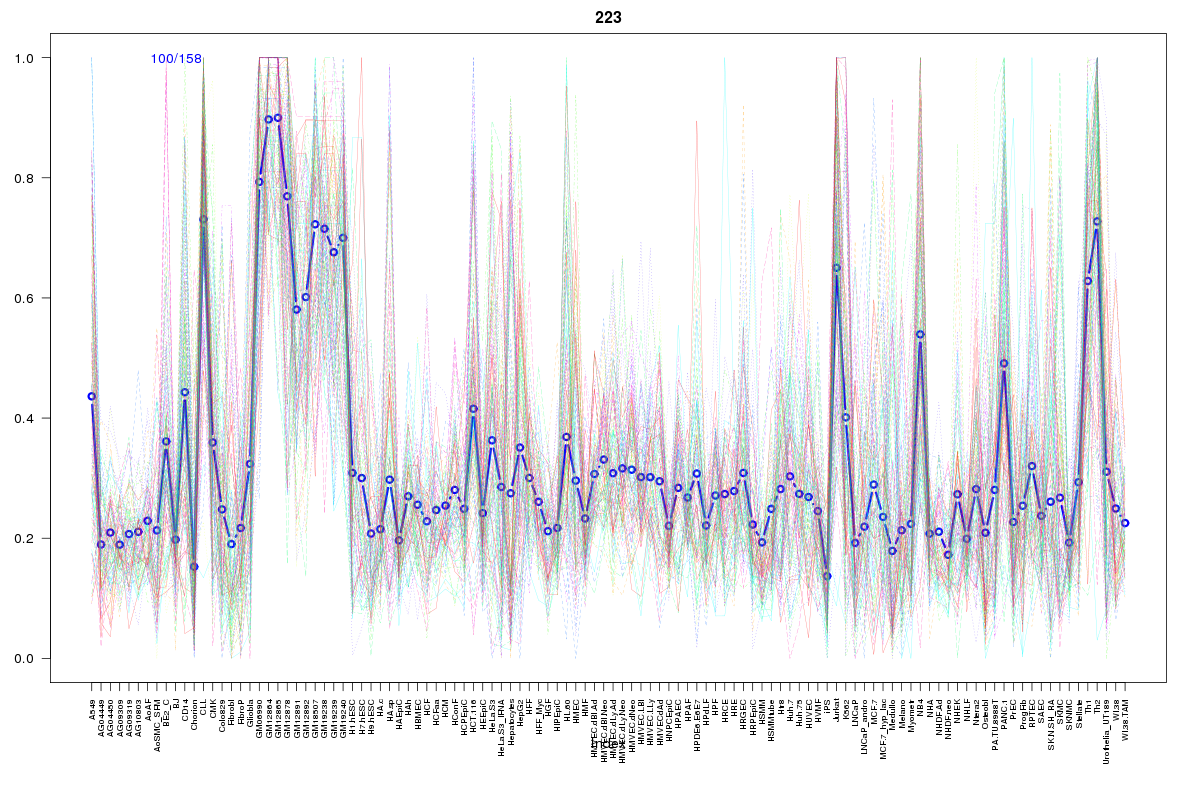 | 223 | 1 |
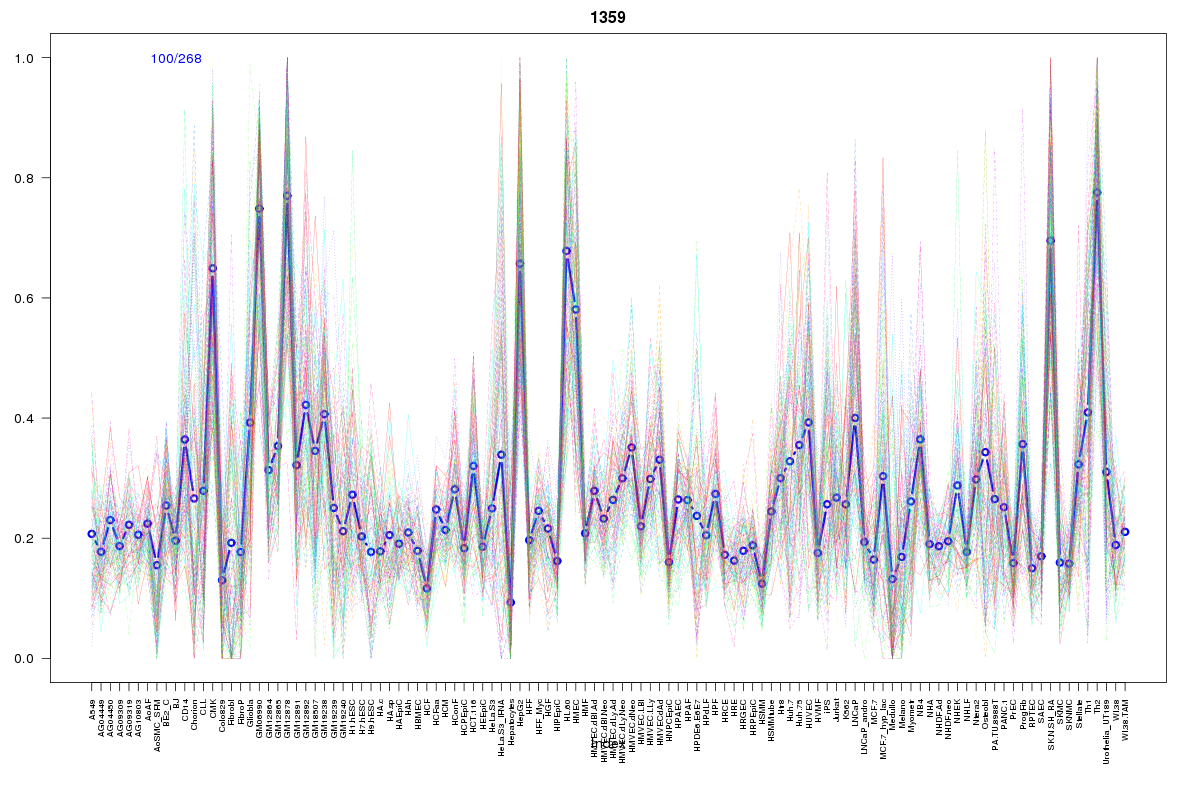 | 1359 | 1 |
 | 927 | 1 |
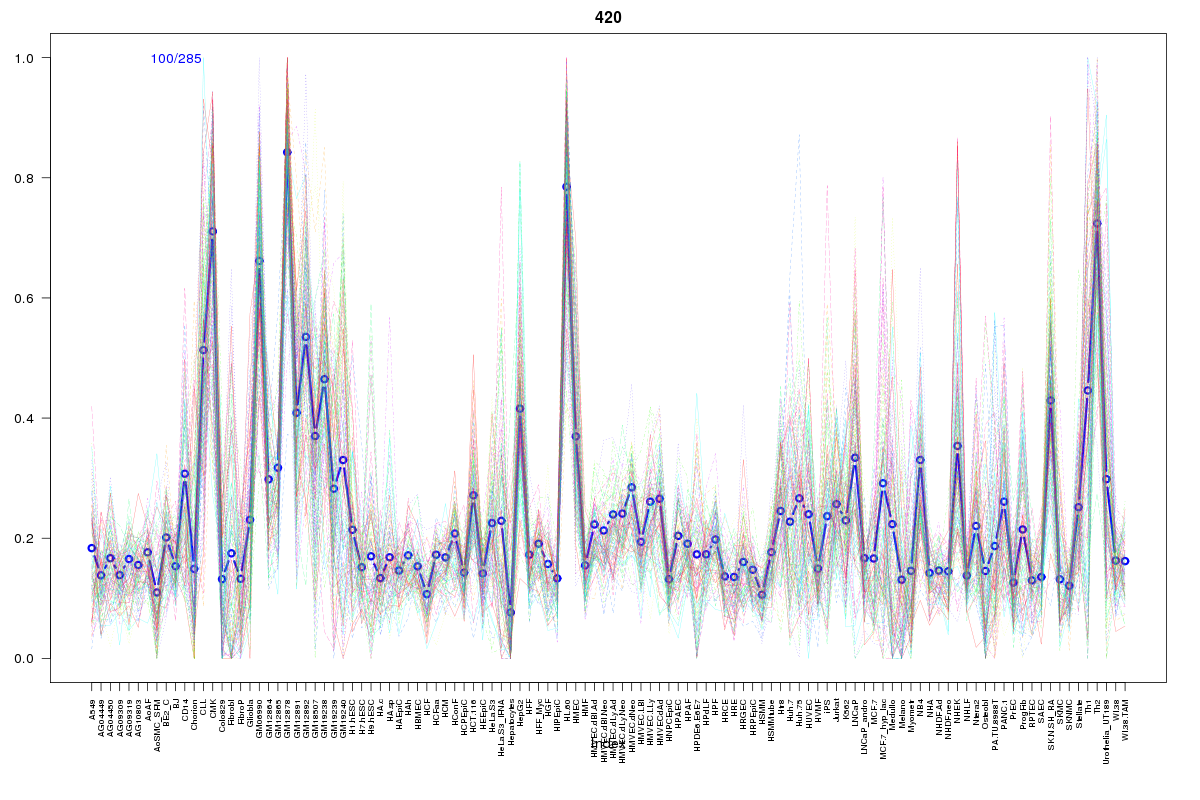 | 420 | 1 |
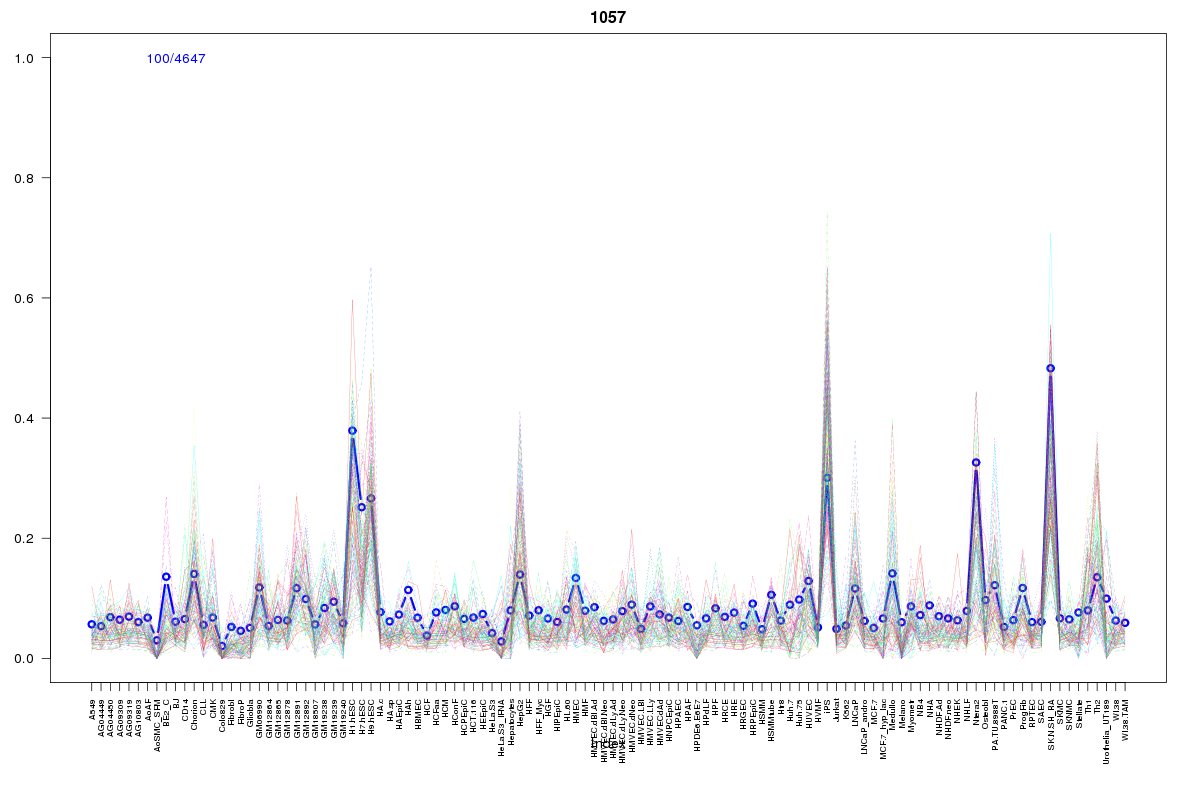 | 1057 | 1 |
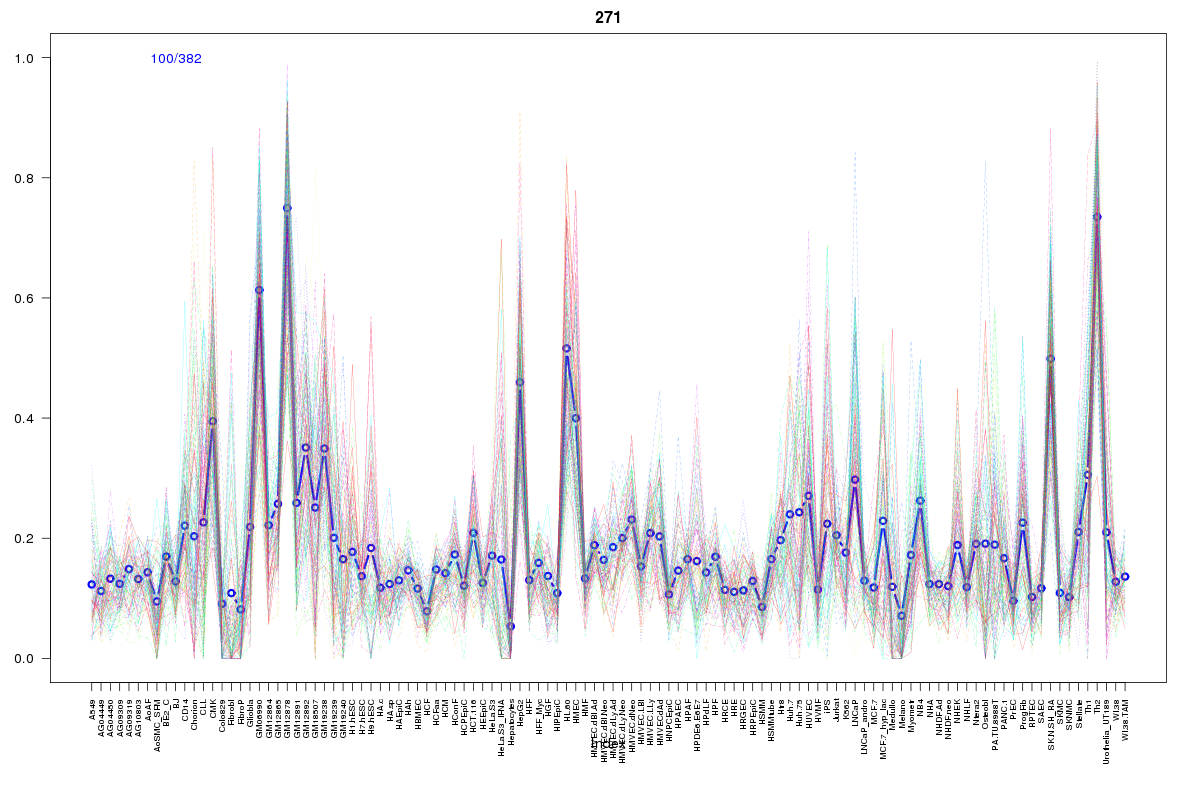 | 271 | 1 |
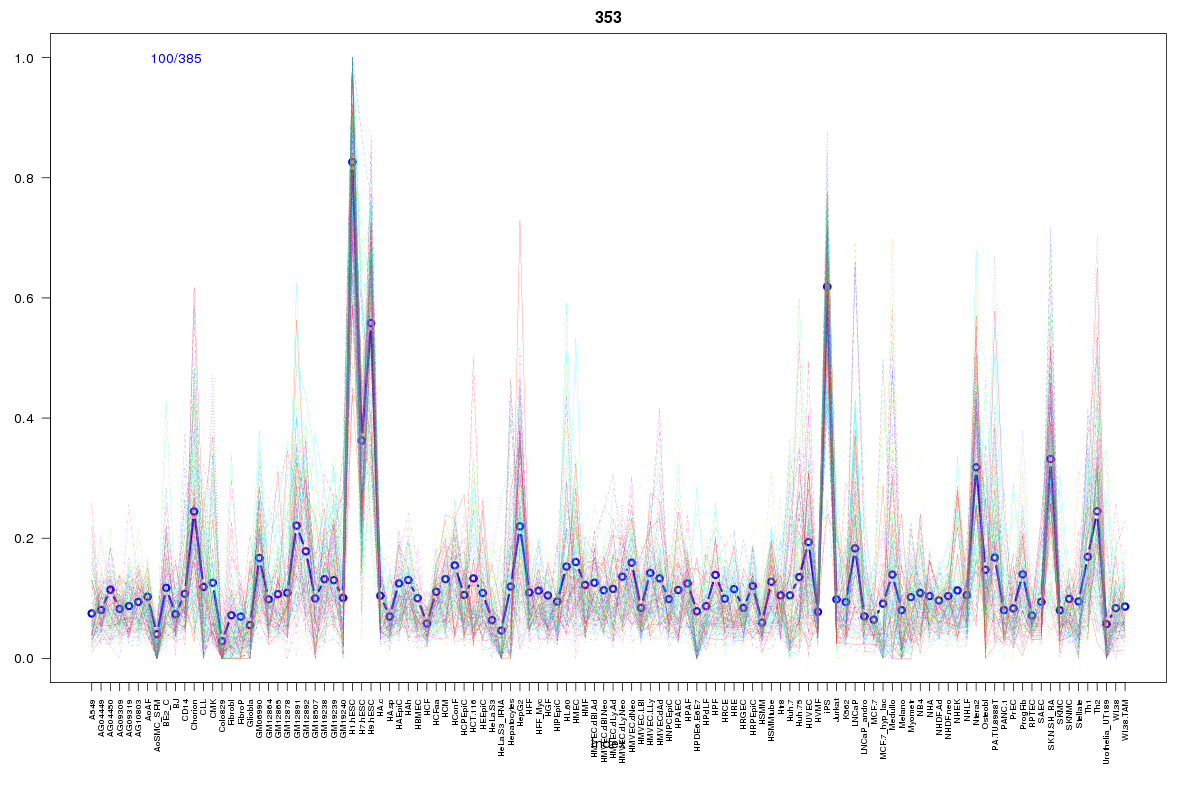 | 353 | 1 |
 | 629 | 1 |
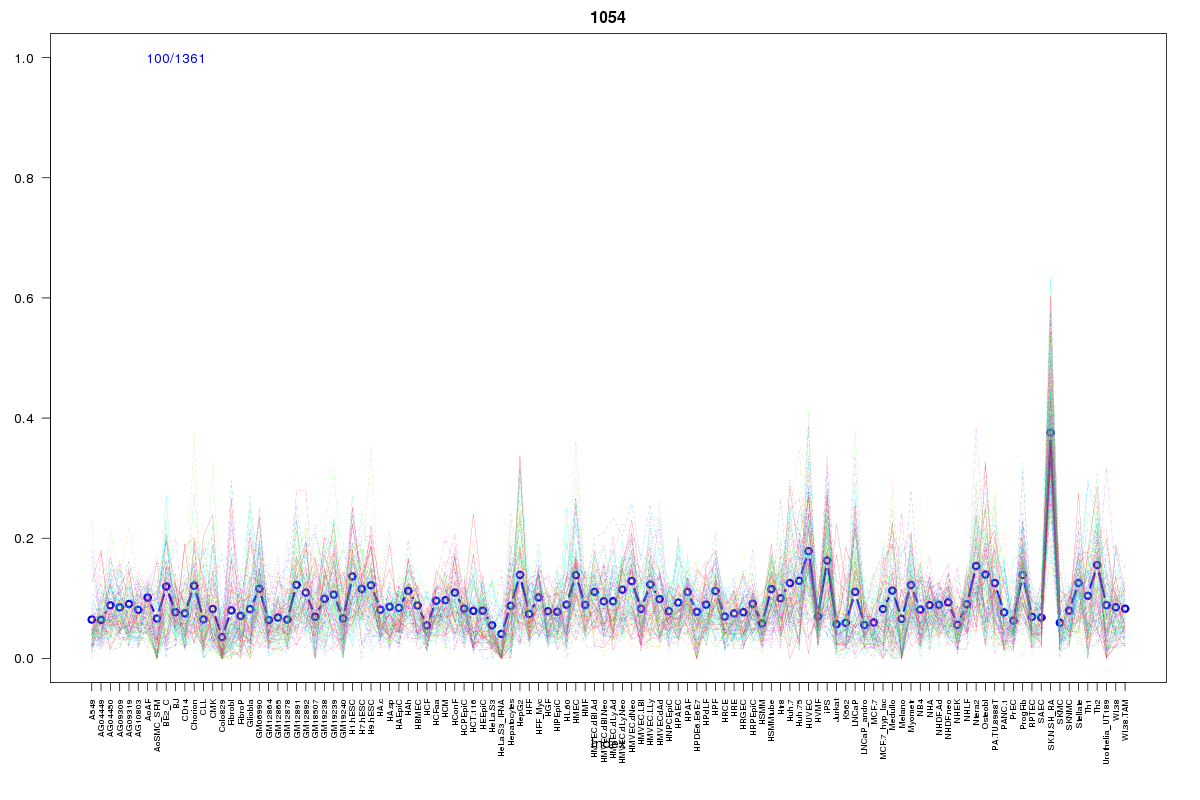 | 1054 | 1 |
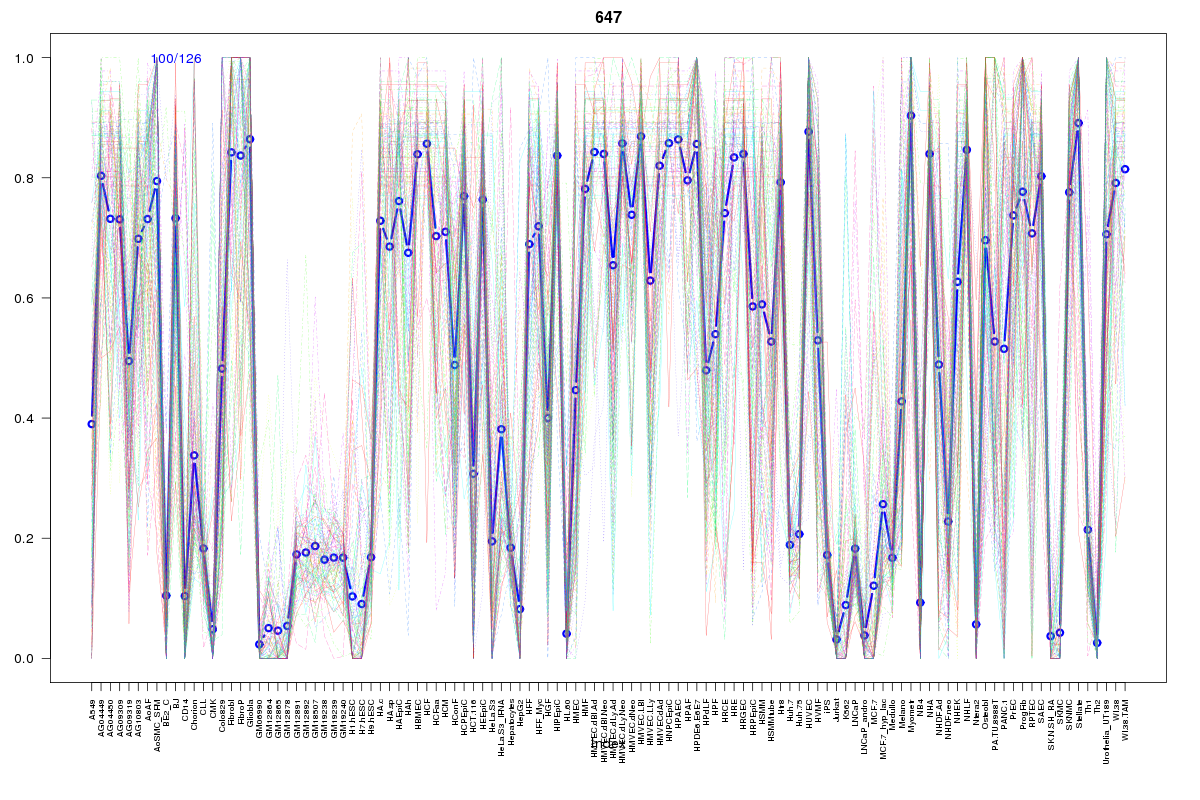 | 647 | 1 |
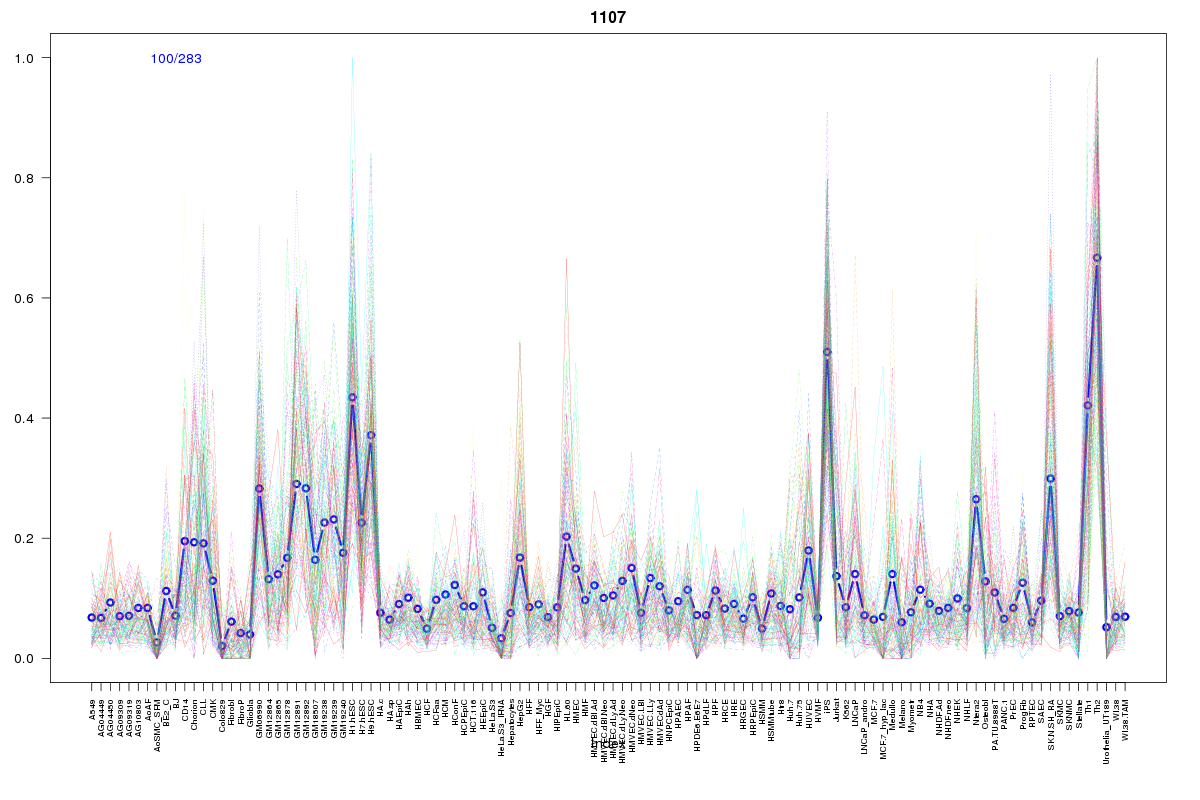 | 1107 | 1 |
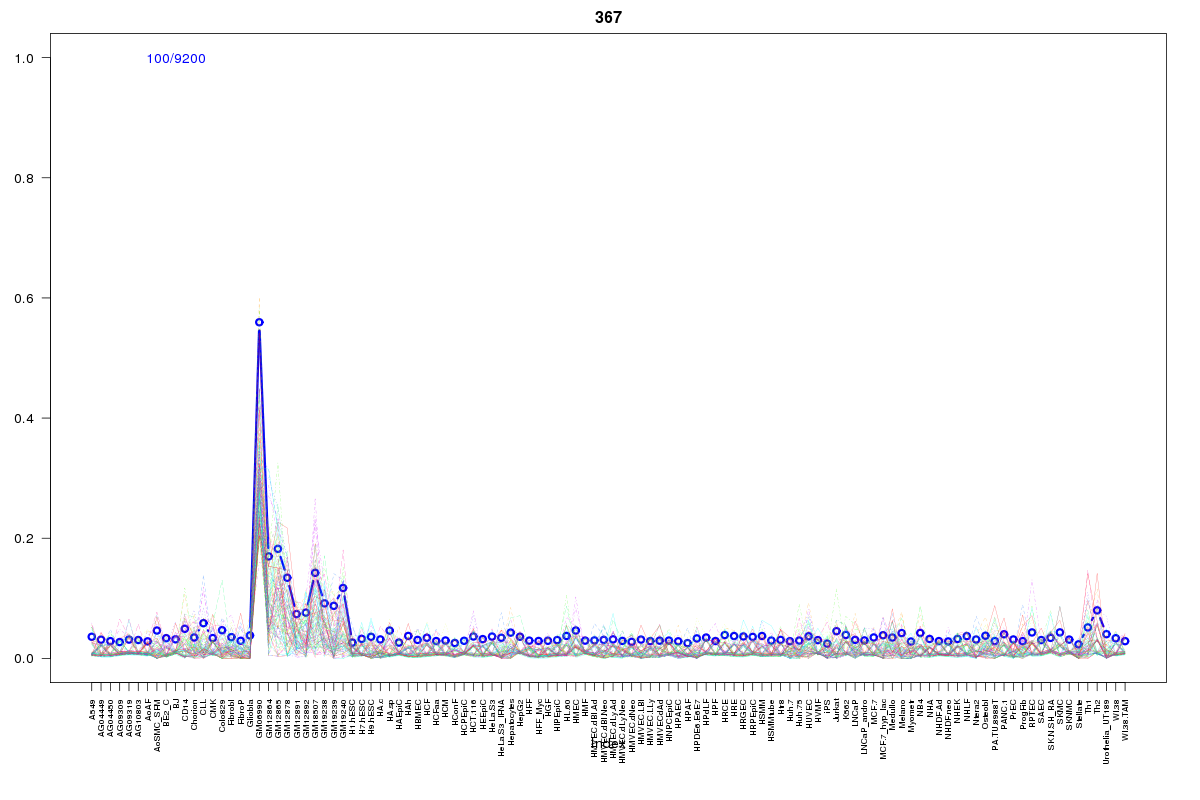 | 367 | 1 |
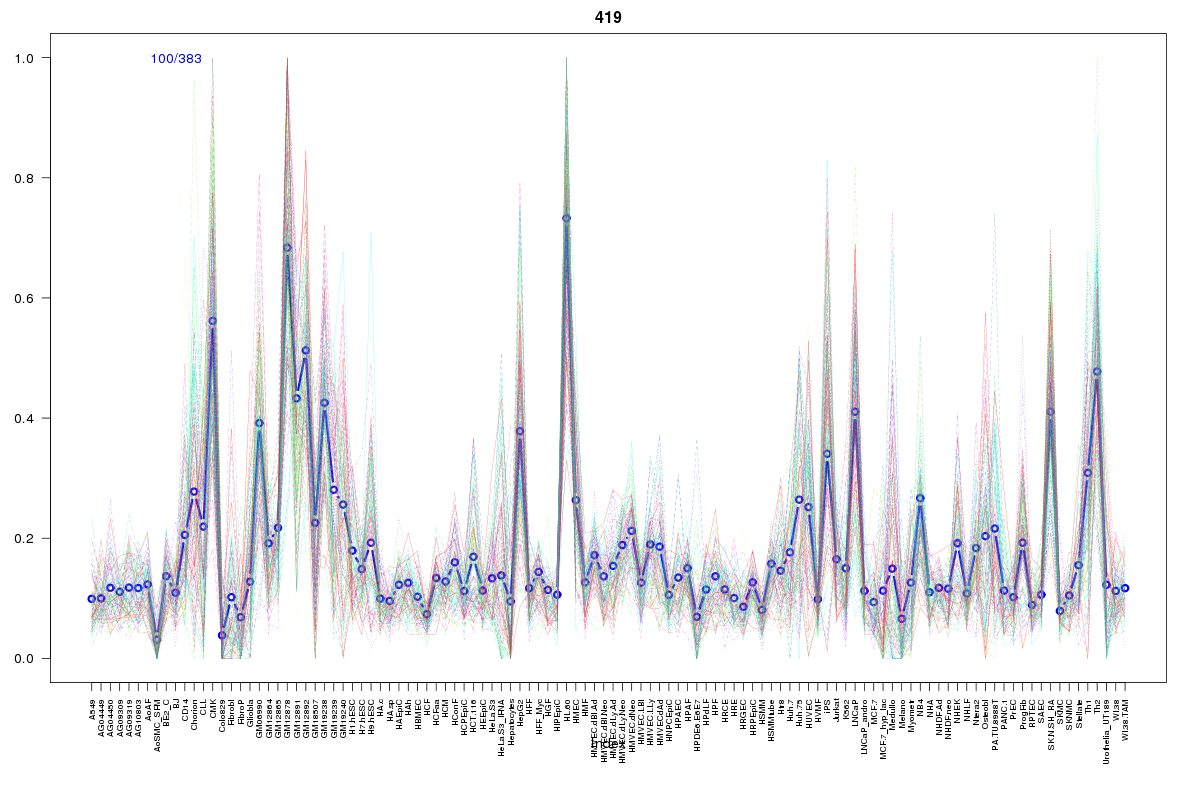 | 419 | 1 |
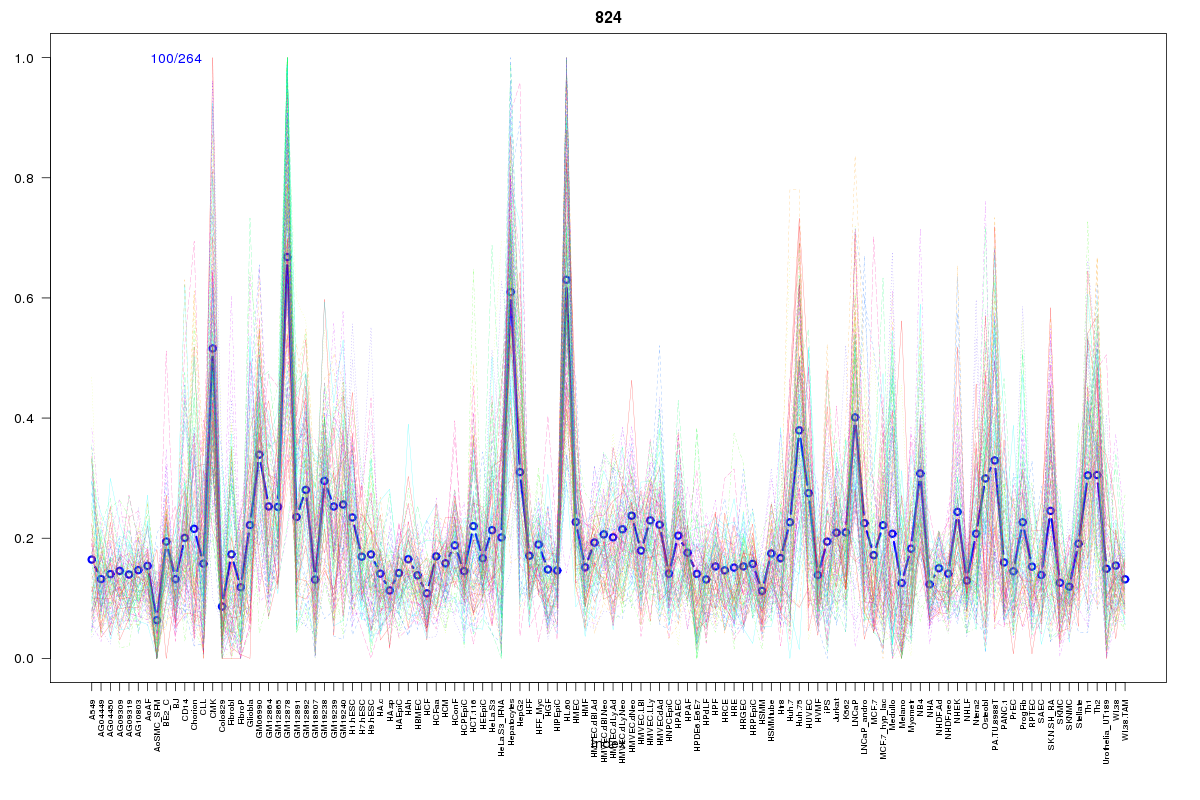 | 824 | 1 |
 | 2122 | 1 |
Resources
BED file downloads
Connects to 37 DHS sitesTop 10 Correlated DHS Sites
p-values indiciate significant higher or lower correlation| Location | Cluster | P-value |
|---|---|---|
| chr19:2426665-2426815 | 824 | 0.002 |
| chr19:2426305-2426455 | 1257 | 0.003 |
| chr19:2426900-2427050 | 1372 | 0.003 |
| chr19:2427140-2427290 | 31 | 0.003 |
| chr19:2457205-2457355 | 1508 | 0.004 |
| chr19:2424080-2424230 | 1057 | 0.005 |
| chr19:2425185-2425335 | 1107 | 0.006 |
| chr19:2329065-2329215 | 2122 | 0.006 |
| chr19:2418980-2419130 | 958 | 0.006 |
| chr19:2477085-2477235 | 271 | 0.006 |
| chr19:2476760-2476910 | 420 | 0.007 |
External Databases
UCSCEnsembl (ENSG00000099800)